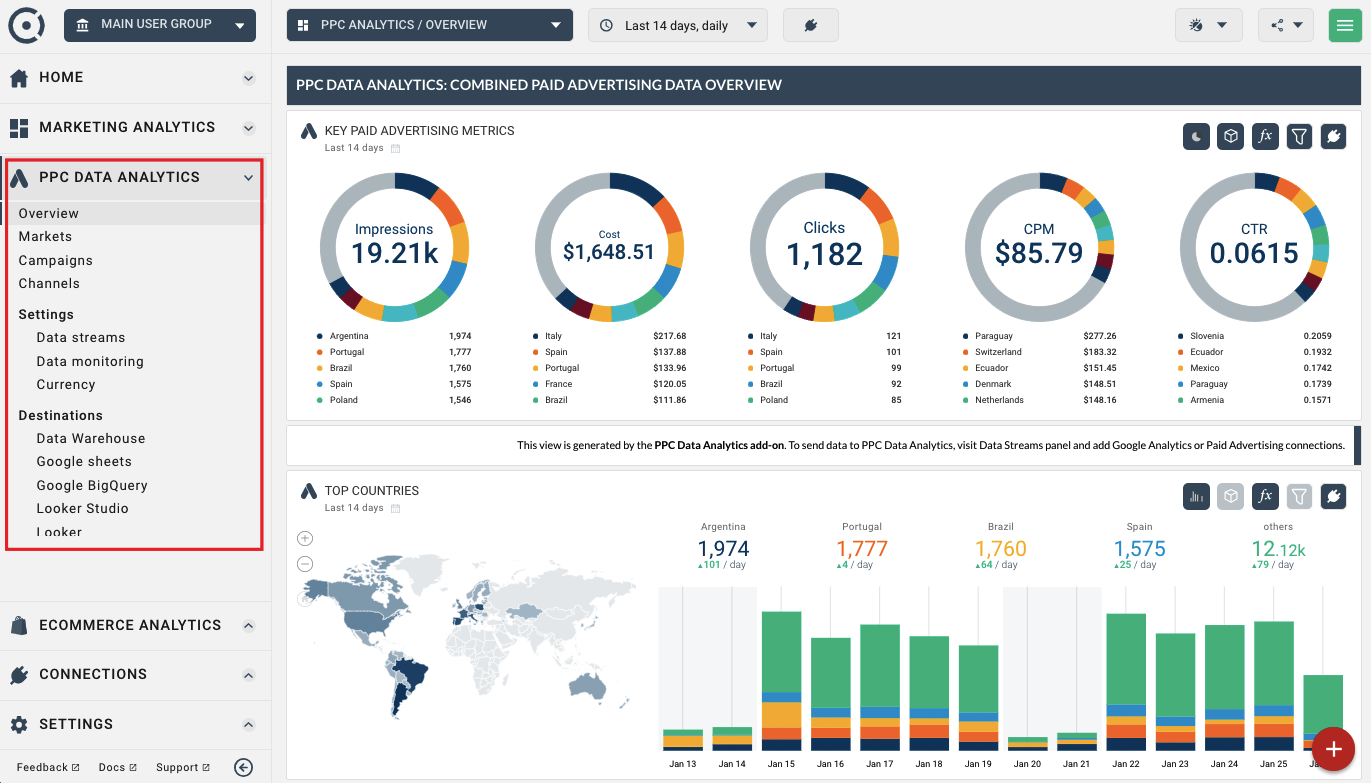
PPC Data Analytics overview
The PPC Analytics Product is an advanced Octoboard module that combines data from paid advertising accounts and Google Analytics properties. It allows Octoboard clients to combine, clean and transform data as well as build new metrics and dimensions across connected PPC platforms.
These are some of the PPC Analytics features available in Octoboard:
- Multi-channel PPC data analytics and custom dimensions support
- Custom data transformations: rules, datasets and advanced formulas
- Ability to create new metrics, formulas and data dimensions
- Reporting in over 140 currencies with daily exchange rates support
- Shared and embedded dashboards and automated reports with fully customizable data templates
- Premium feature: data exports to Google Data Studio, Google BigQuery and Google Sheets
- Premium feature: access to normalised data in Octoboard Data Warehouse
PPC Analytics dashboards, data sources, data transformations and exports can be located in the left panel.
If you have not purchased a license for PPC Data Analytics or if you are not using the add-on and would like to hide its features, use the Settings > Add-Ons panel to modify PPC Data Analytics visibility settings:
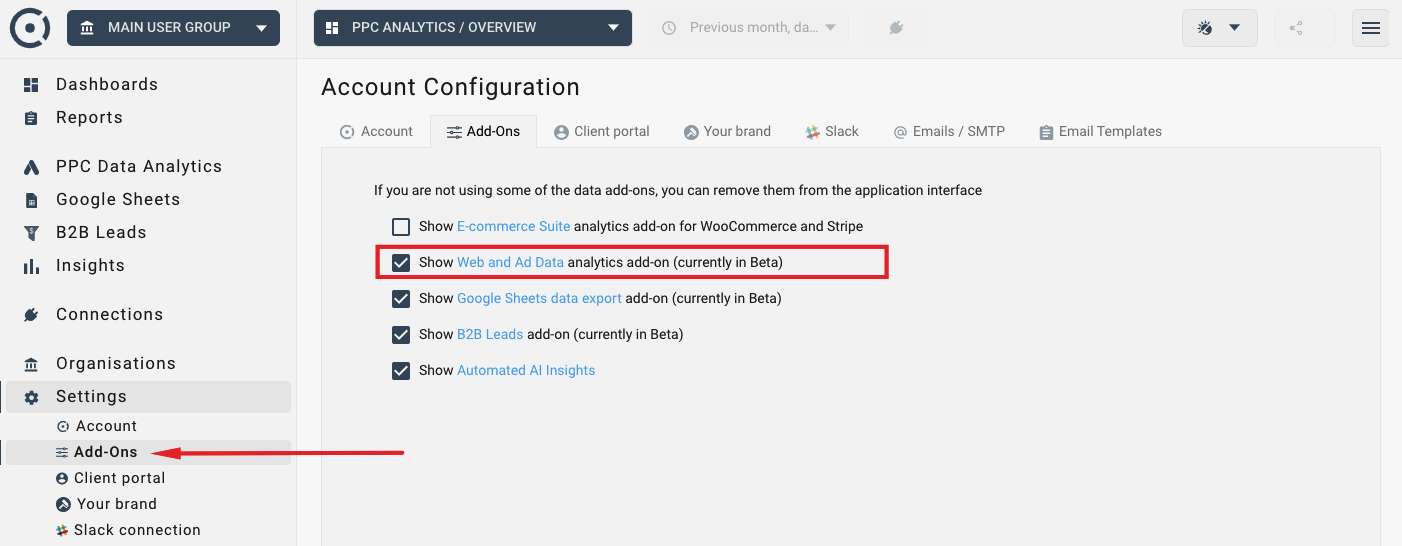
Once you tick the PPC Analytics check box, the add-on will be displayed in the left panel.
The PPC Data Analytics Product currently works with the following sources:: Google Analytics (UA and GA4), Google Ads, Facebook Ads, LinkedIn Ads, Bing Ads and Criteo. We have all major paid advertising platforms on our roadmap and will add more integrations in our future releases.
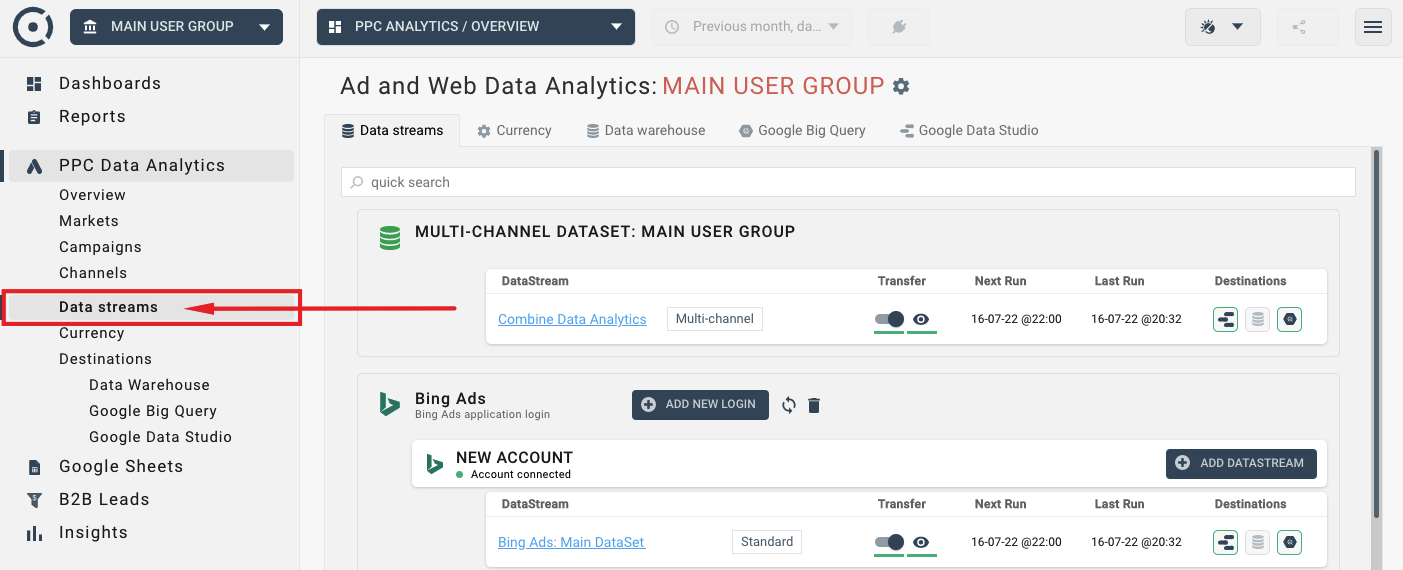
To start sending paid advertising or Google Analytics data to the PPC Data Add-on, use the “Data Streams” option in the left panel:
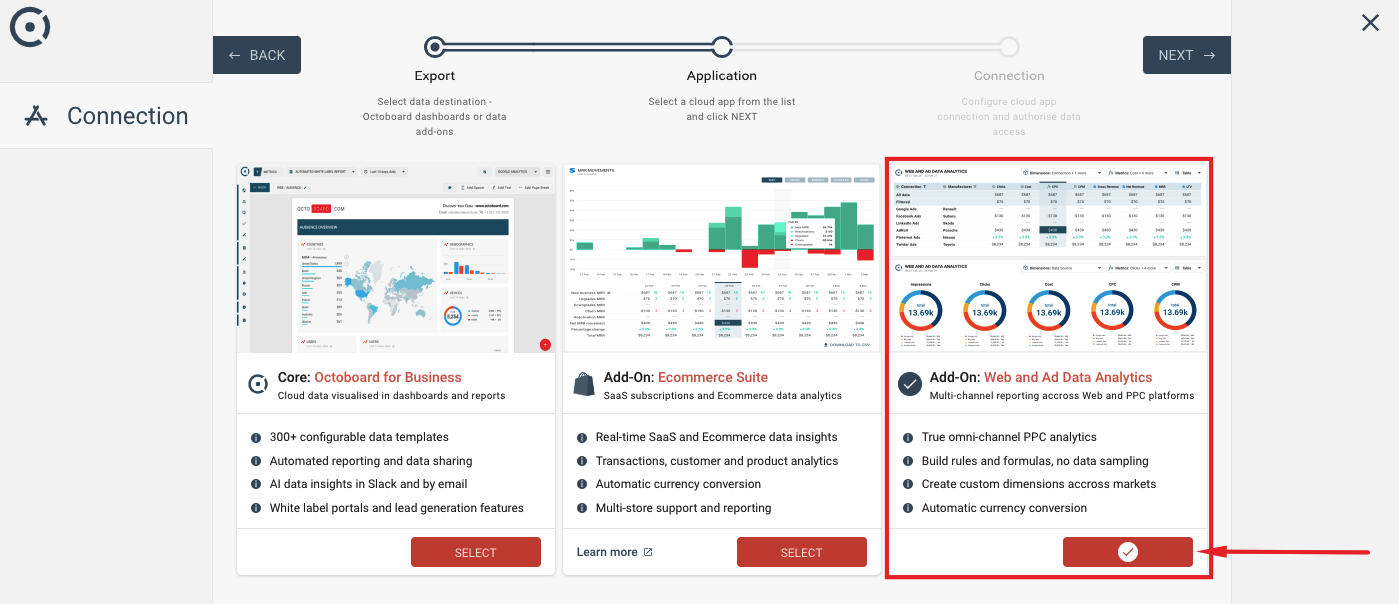
When you click the “ADD CONNECTION” button, you will be presented with the connection wizard that will guide you through the process of connecting a new data source such as Google Ads, Facebook Ads, Google Analytics and others.
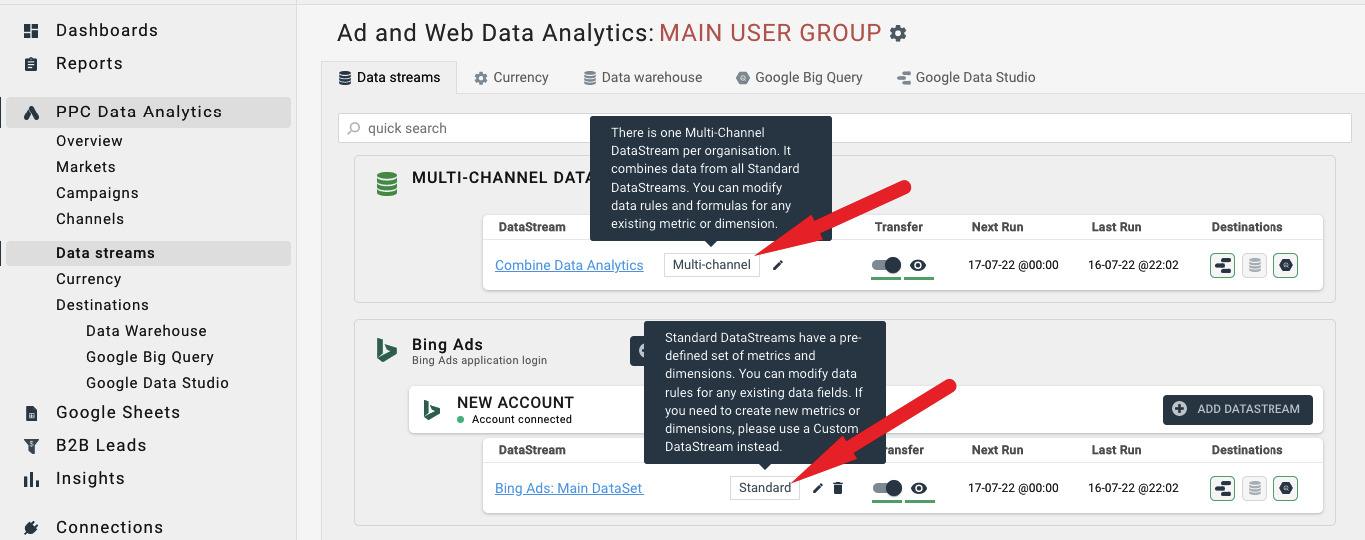
Every newly connected source sends data to a default data stream. You can use data streams to modify received data and to view it in Octoboard dashboards and reports. You can also send data streams to Google Data Studio, Google BigQuery, Data Warehouse and other systems.
Data Streams can be of the following types:
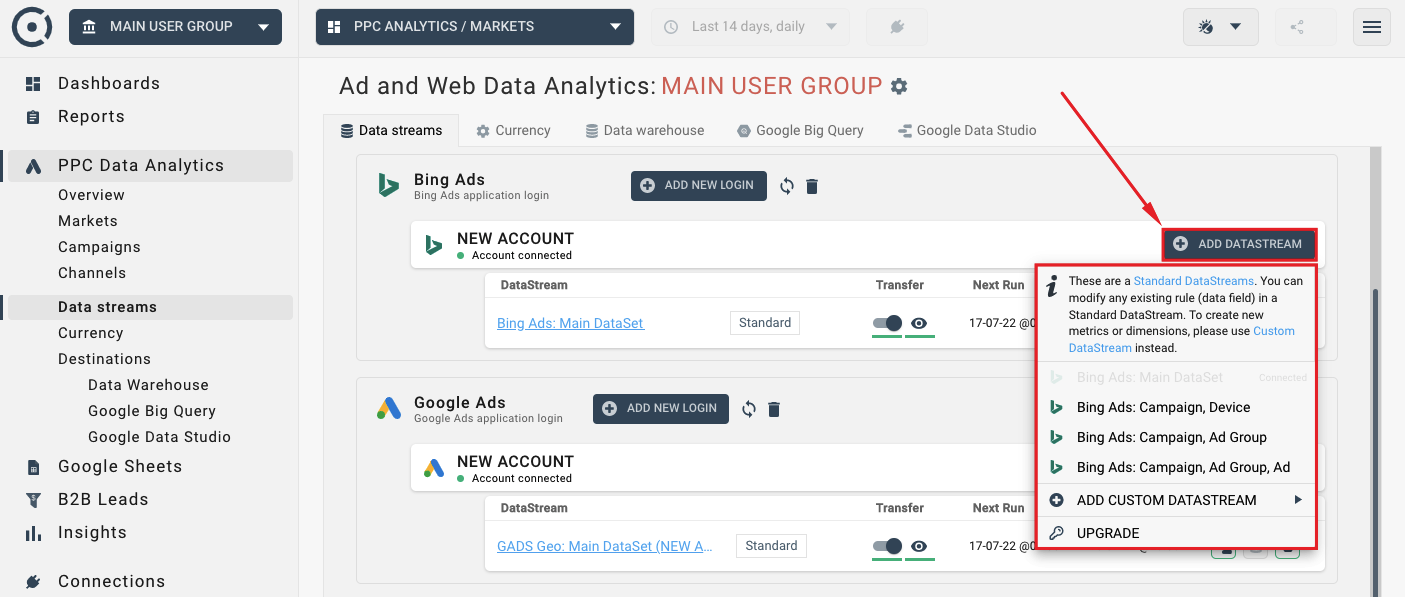
- Standard Data Stream - a pre-defined stream that has a set number of metrics and dimensions. You can modify any existing metric, dimension or formula in a Standard data stream but you cannot create new dimensions. One standard data stream is created with every new connection.
- Custom Data Stream - fully customizable stream that allows the creation of new metrics, dimensions and formulas. New custom data streams can be added at any time.
- Default Combined Multi-Channel Data Stream - combined data stream is created by the system automatically. Thre is one combined stream per organisation (client or team) that receives all the PPC and Goolge Analytics data that you connect to the PPC Data Analytics Product. Combined multi-channel stream cannot be deleted but you can modify any rule, metric or dimension in that stream.
The data connection can be configured separately for every Octoboard client or team. For more details on the process of managing data connection in PPC Data Analytics please read this tutorial.
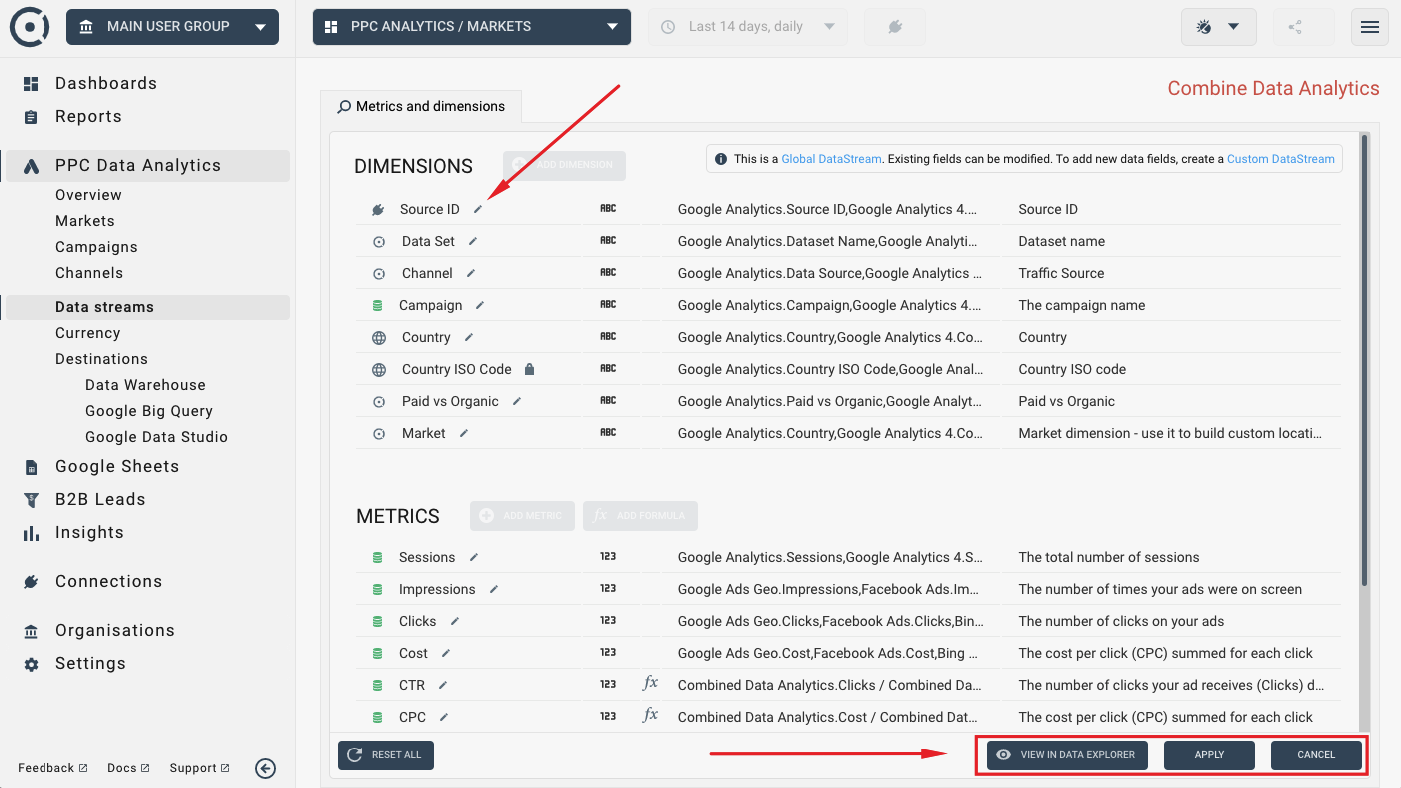
There is a number of pre-defined dashboards and report templates available for you in Octoboard. They are fully configurable. Data Explorer widgets will show the data for selected Streams. You can always add more data sources, select different streams or modify custom streams to add new metrics, formulas and custom dimensions. Use the CONNECT icon in the Data Explorer to switch the data view to a different stream or select a new data source:
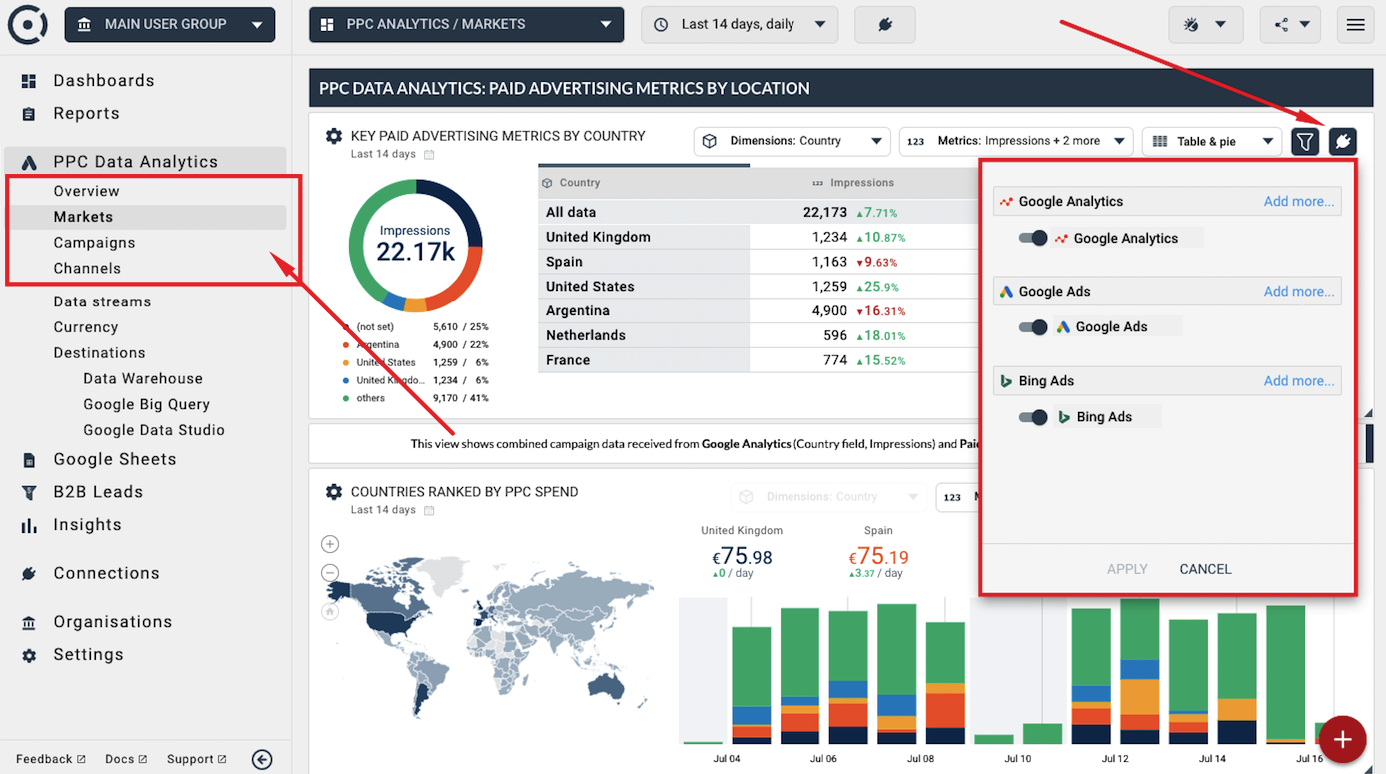
Select metrics and formulas that you want to see in the Data Explorer by using the drop-down controls in the header of the widget as shown in the image below:
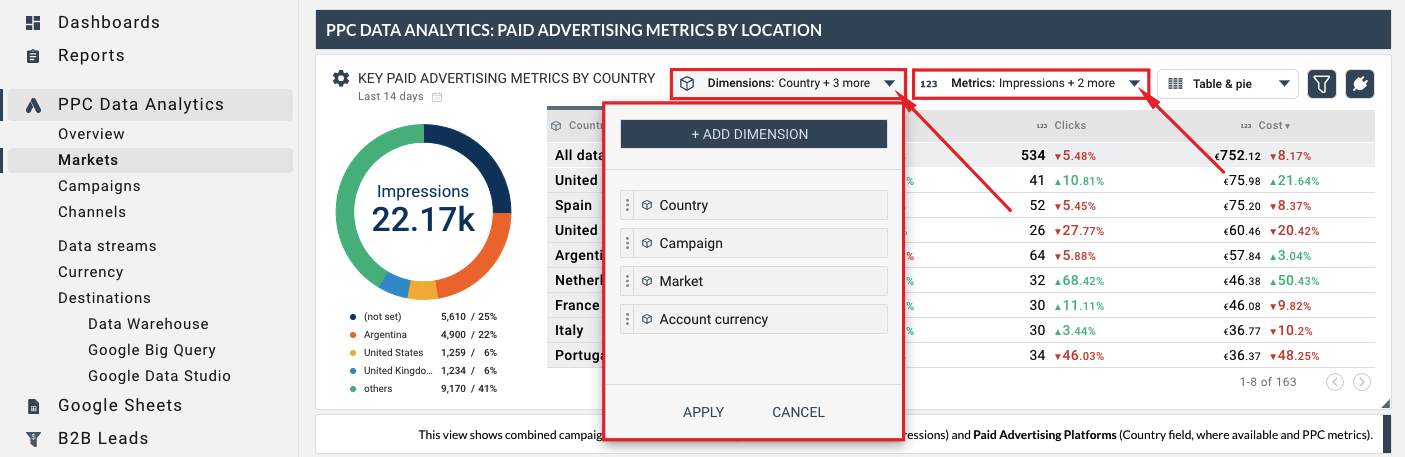
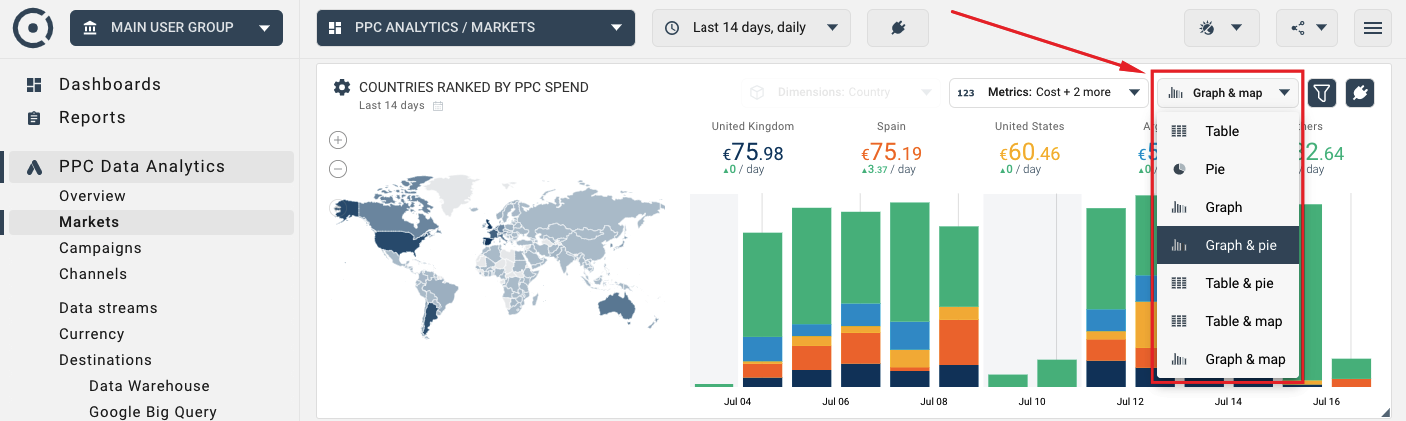
Data Explorers support combinations of graphs, pie charts and tables. If the selected data source contains a country dimension, the data explorer will allow you to display geographical maps.
You can use or modify pre-defined PPC Data Analytics templates as well as create new dashboards and reports using PPC Data Analytics widgets. As with any dashboard or report in Octoboard, you can always share data with your peers and clients by creating a white-label data portal or sending automated reports.
For more details on data sharing options in Octoboard, please read this tutorial.
For information on PPC Data Analytics visualisation options in Octoboard dashboards and reports please read this tutorial.
When you connect a data source such as Google Analytics, Facebook Ads or Google Ads, a default data stream is created by the PPC Data Analytics Add-on. Data streams can be used to view the data in Octoboard dashboards and reports or to send it to Google Data Studio, Google BigQuery, Data Warehouse and other systems.
Data Streams can be of the following types:
- Standard Data Stream - a pre-defined stream created automatically for every new data connection. It has a set of pre-defined metrics and dimensions. You can modify any existing metric, dimension or formula in a Standard data stream but you cannot create new dimensions.
- Custom Data Stream - fully customizable stream that allows the creation of new metrics, dimensions and formulas.
- Default Combined or Multi-Channel Data Stream - automatically created stream that combines data from all connected data sources.
Data Streams consist of metrics and dimensions. Any existing metric or dimension can be modified by you. You can also create your own data fields in Custom and Combined Streams. You do so by defining data rules. Data rules (formulas or calculations) that can be as simple as extracting a data value without modification or as complex as combining data values from different data streams, having IF-ELSE statements, text and numeric functions as well as data value lookups using external Google Sheets documents.
Any data source can have many data streams. You can add a new stream by clicking the ADD DATASTREAM button. Select either Standard or Custom stream type:
To modify an existing stream, use the EDIT button shown below.
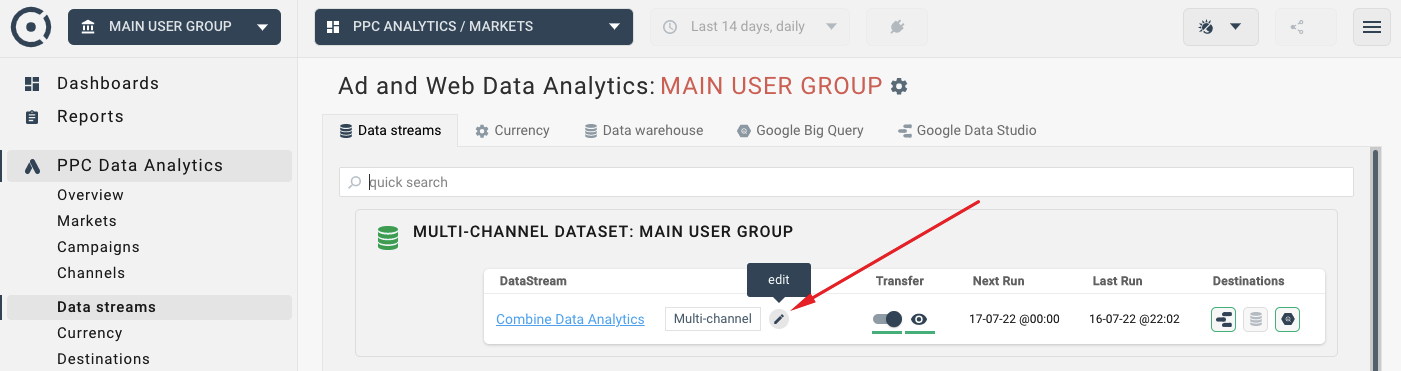
The list of metrics and dimensions will allow you to make changes to the selected data source. You can modify existing logic of any stream. You can add new metrics or dimensions to Custom and Combined Data Streams.
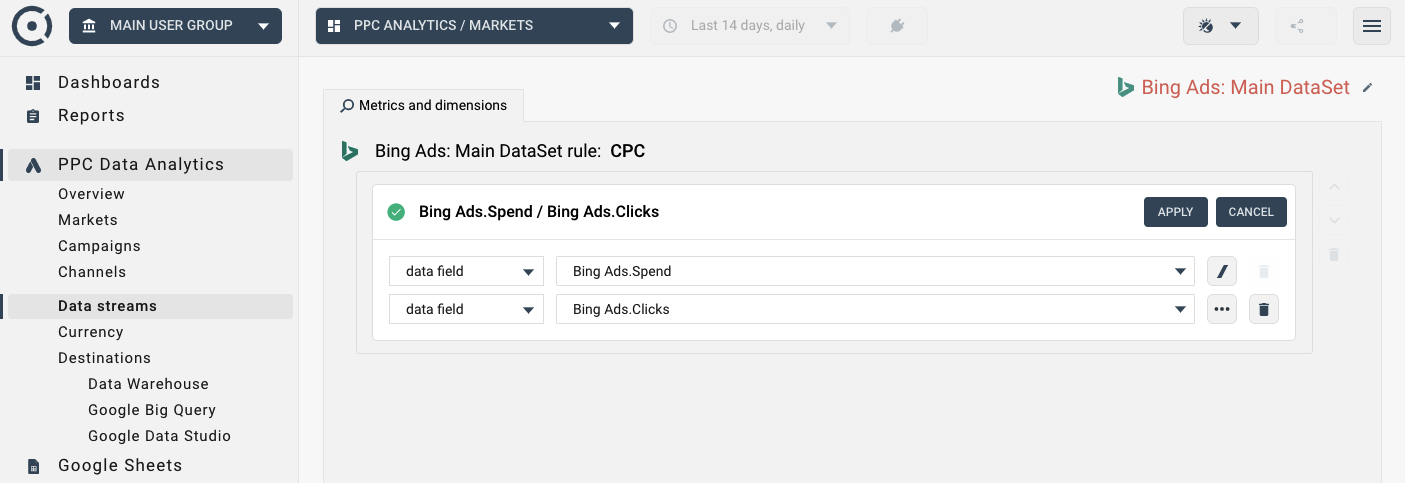
When you click the EDIT field button, you will be presented with options to change existing data transformation rules. Below is an example of the Click-Through Rate (CTR) formula rule that can be modified.
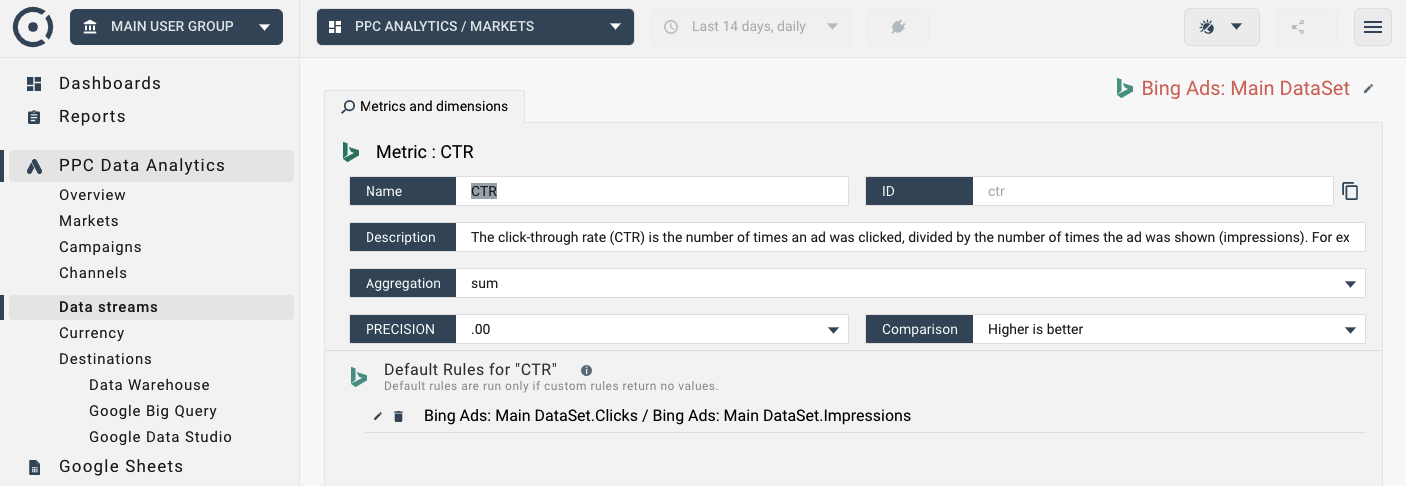
Here is an example of the formula edit screen for the Bing Ads Cost Per Click (CPC) data metric:
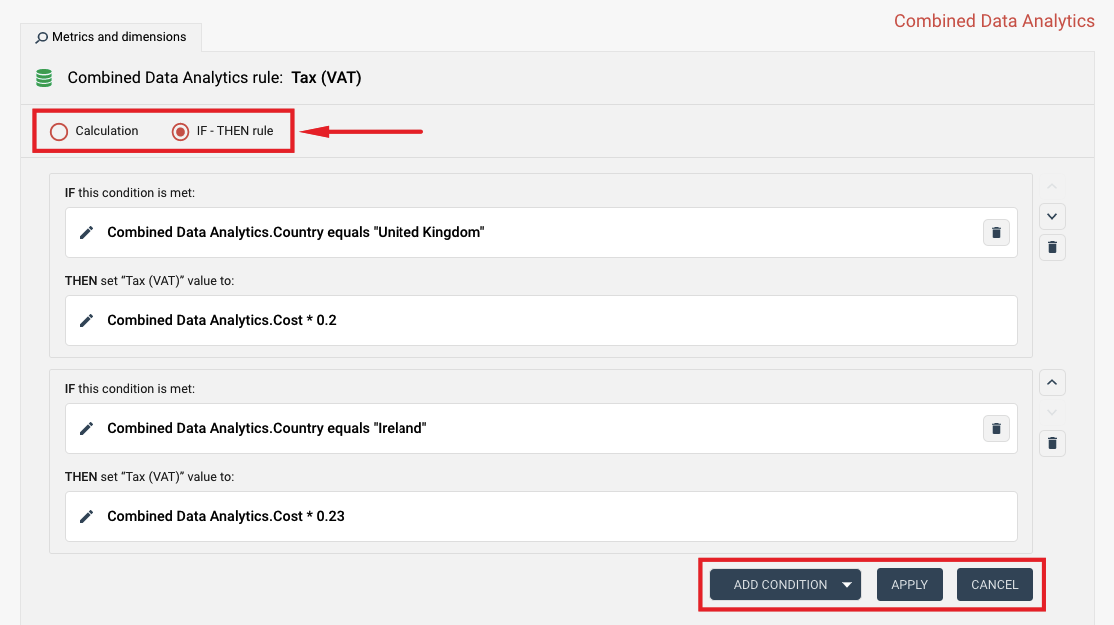
Here is another example of a more complex rule that calculates advertising costs that include VAT for campaigns run in the United Kingdom and Ireland. The rule increases combined ad cost values by 20% and 23% for these countries.
Data transformations can be configured separately for every Octoboard client or team. For more details on data streams and how to use data transformations in Octoboard, please read this tutorial.
Any selected data source - Custom, Standard or Multi-Channel - can be viewed in Octoboard dashboards and reports or sent to an external data destination such as Google Data Studio or Google BigQuery. To access data export features use the left panel area:
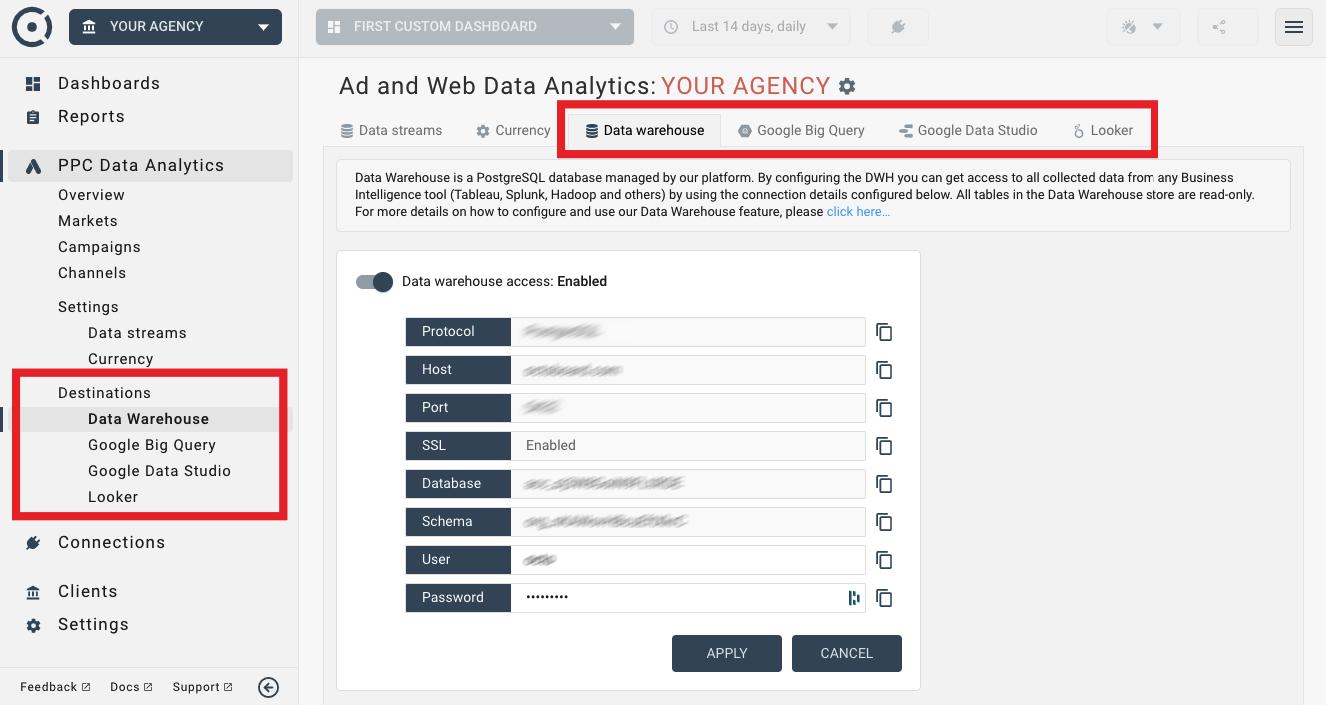
The following tutorials cover export configurations for every currently available data destination:
When you connect a PPC data source such as Google Ads or Bing Ads, our platform identifies its original (source) currency. Since you can connect different data sources and combine data in multi-channel data streams, we need a currency conversion mechanism to present total financial values in the same output (presentation) currency. Octoboard uses historical currency exchange rates to convert values of financial metrics to the presentation currency.
To modify the presentation currency for your clients, use the Currency option in the left panel:
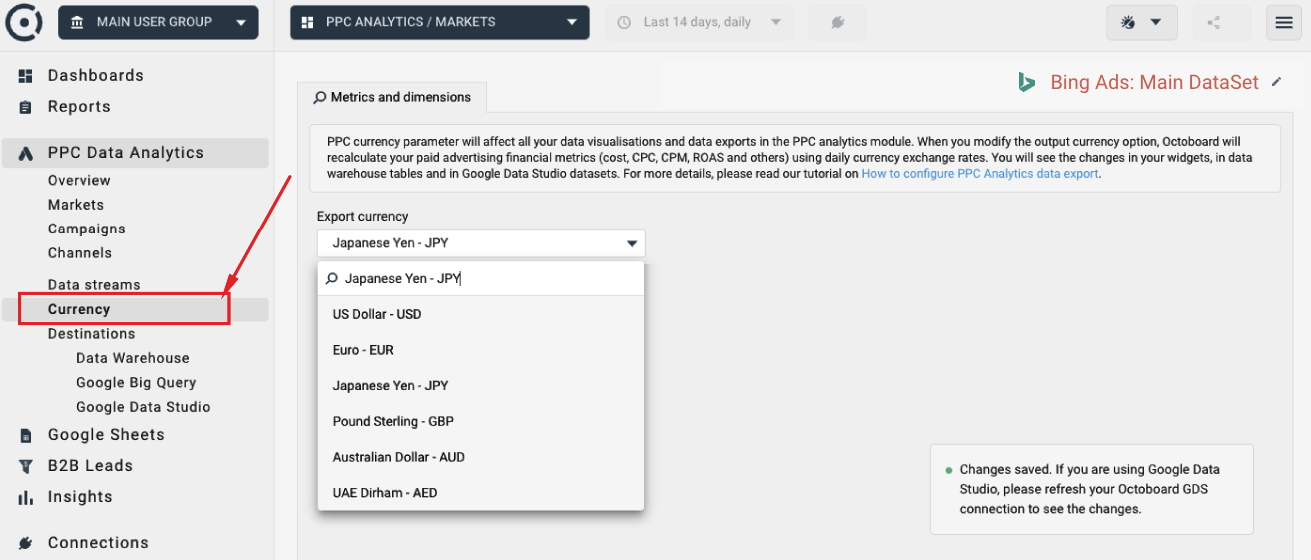
The PPC presentation currency parameter affects all data visualisations and data exports in the PPC analytics module. When you modify the presentation currency, Octoboard will recalculate your paid advertising financial metrics (cost, CPC, CPM, ROAS and others) using accurate daily currency exchange rates. You will see the changes in your widgets, in data warehouse tables and Google Data Studio datasets.
If you are using Google Data Studio, please refresh your Octoboard GDS connection to see the changes. The currency changes made in the PPC Analytics module do not affect the currency conversion in the Octoboard Marketing Analytics product (non-PPC Analytics dashboards and reports).
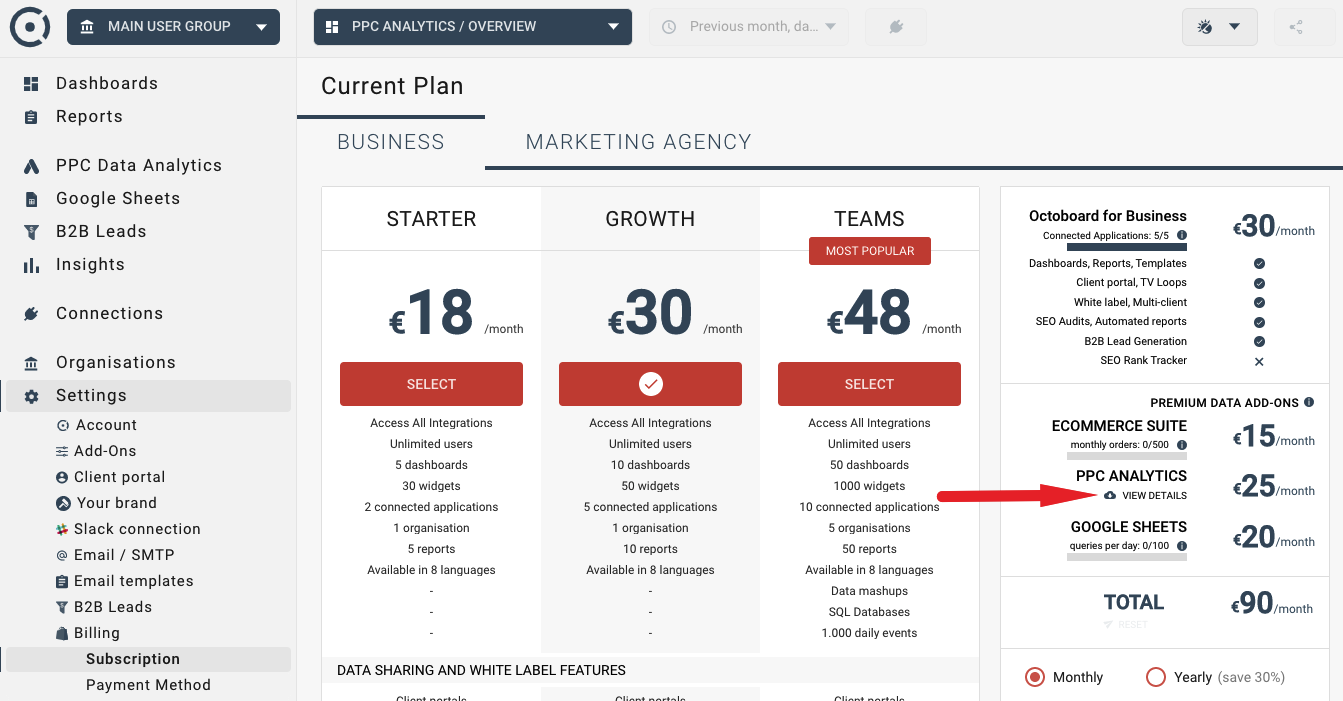
PPC Data Analytics is priced based on the total advertising spend found in active data streams. Octoboard looks at all data streams across all data sources and Octoboard organisations (clients and teams) processed in the last 30 days.
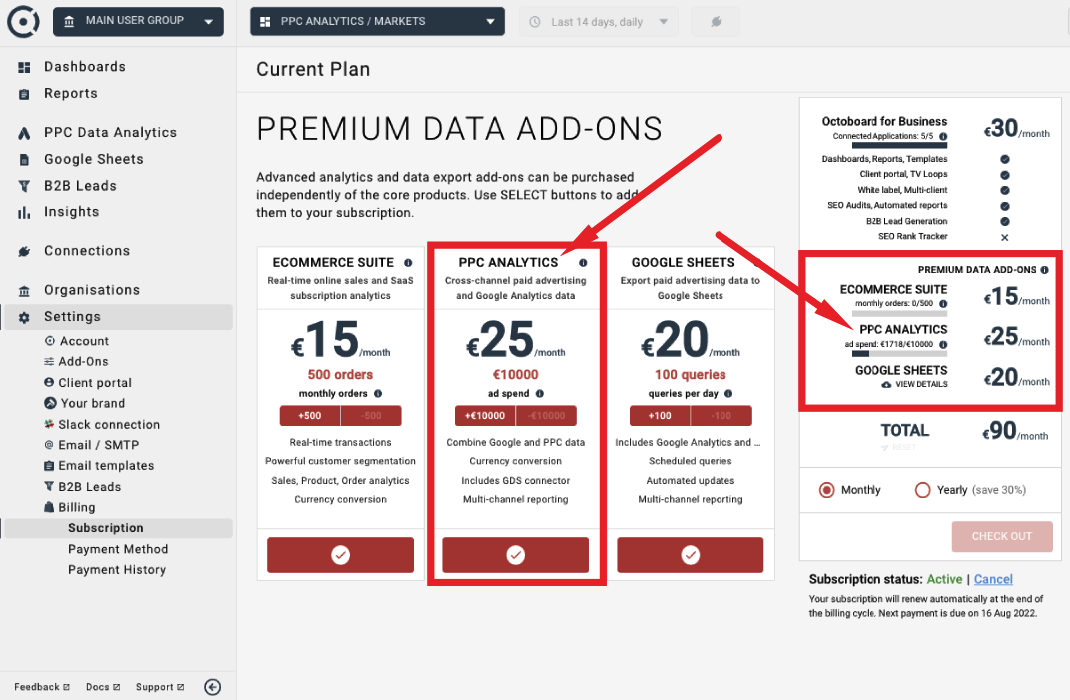
If the advertising budget in Euros is higher than what is allowed in your subscription, the data widgets will start displaying the “Upgrade required” message. You can address this by either managing the amount of processed data (by disconnecting data streams) or by upgrading your subscription.
To check your current usage, click the VIEW DETAILS button next to the PPC Analytics price in the Subscriptions panel.
The PPC Data Analytics Add-on is an advanced analytics module of the Octoboard platform. We recommend reading the following tutorials for more information on how to work with the add-on:
Creation of custom formulas, metrics and dimensions in the PPC Data Analytics Add-on is covered in more details in these tutorials: