Cross-channel SEO, SEM and
Paid Advertising Reporting
Online marketing analytics for more visits, leads, conversions and higher ROAS
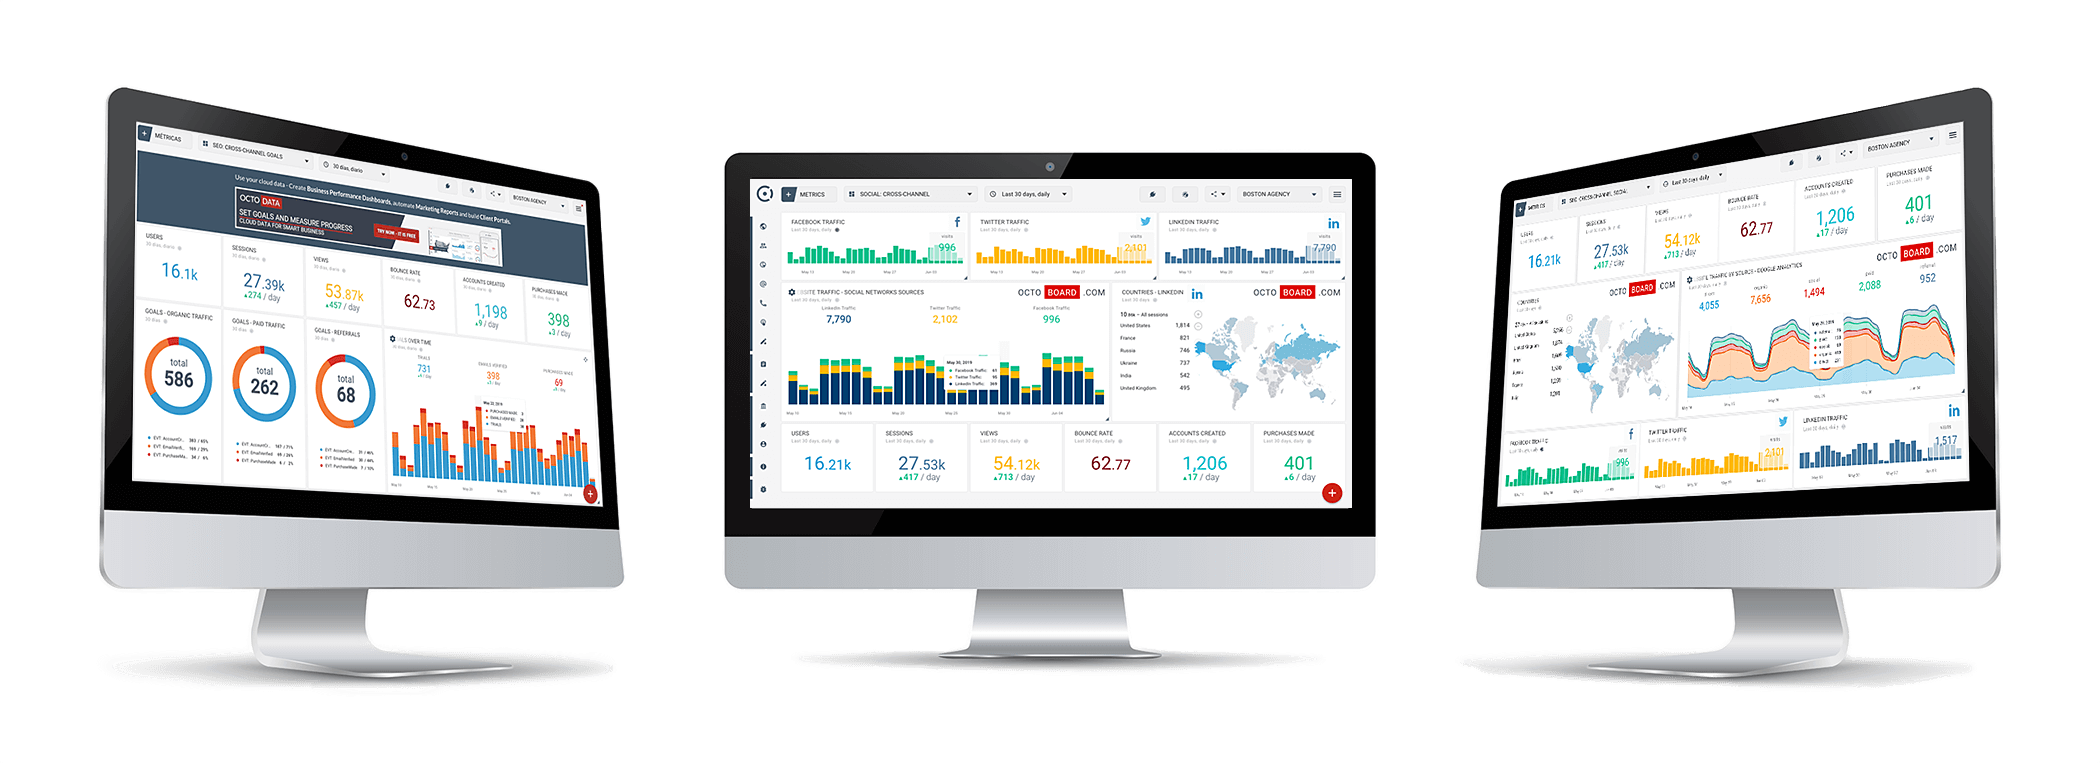
Combine SEM, PPC and Sales
and Drive ROI
Combine SEO, Paid Advertising, Social and Sales data to optimize Marketing Performance for more Clicks, more Leads and Conversions.
We will collect data continuously and present insights for you to make right decisions quickly.
Cross-Channel Templates
for Every Scenario
Our data scientists created professional reports for you to use. With Octoboard you will never start from scratch or spend time joining data.
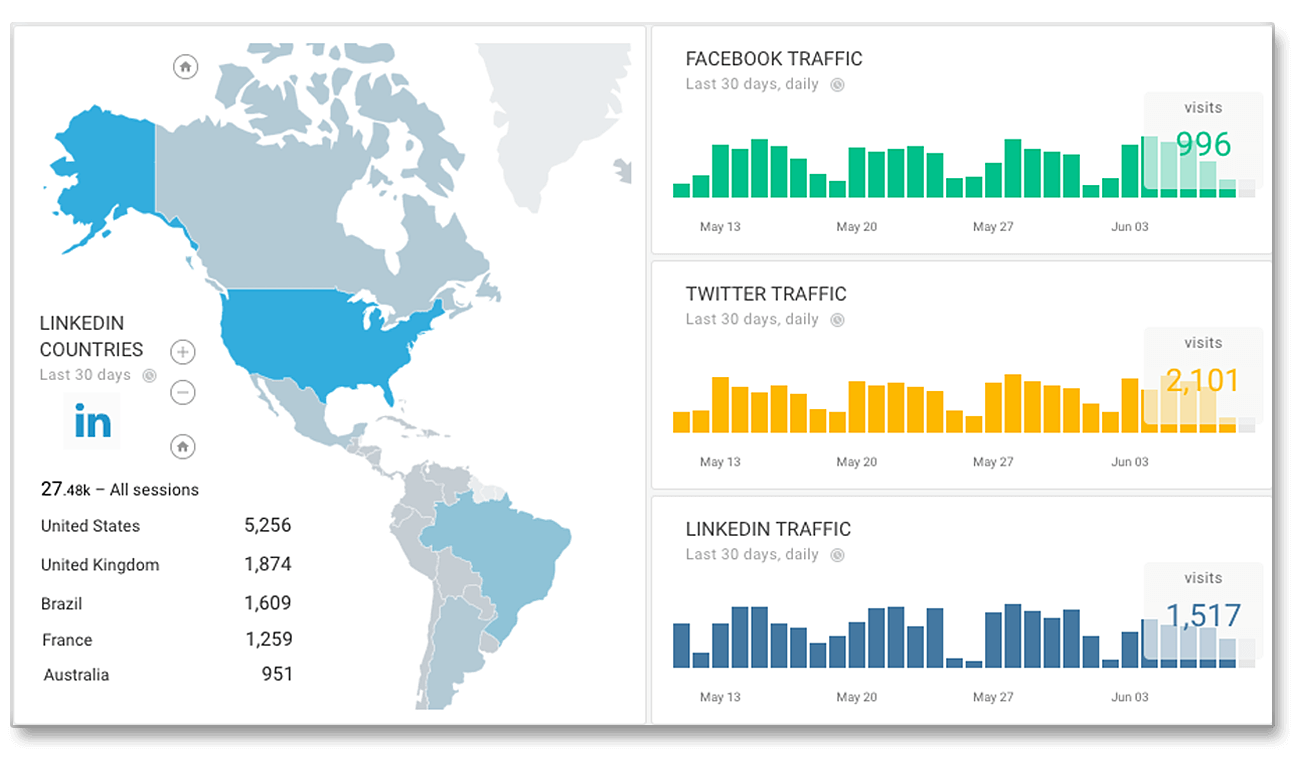
See the Big Picture —
Tell a Good Story
Gather all information across your multi-channel SEO, PPC, Sales and Marketing platforms.
Add executive summaries to reports or dashboards shared in client portals or hosted on your website. All 100% white label.
Account for Every Dollar – Across All Platforms
Know exactly how your ad spend converts to visits, leads and online purchases.
Effortlessly Showcase Results of Your Hard Work to clients and management.
Keyword Rank Tracker
SEO keyword rank monitoring – across multiple locations, languages and competitor websites. Charge your clients for daily SERP reports and weekly updates.
Competition Monitoring
Report on competitor domains for all your clients! Track historical changes in keywords rankings over time. Add competition monitoring to your automated client reports and portals.
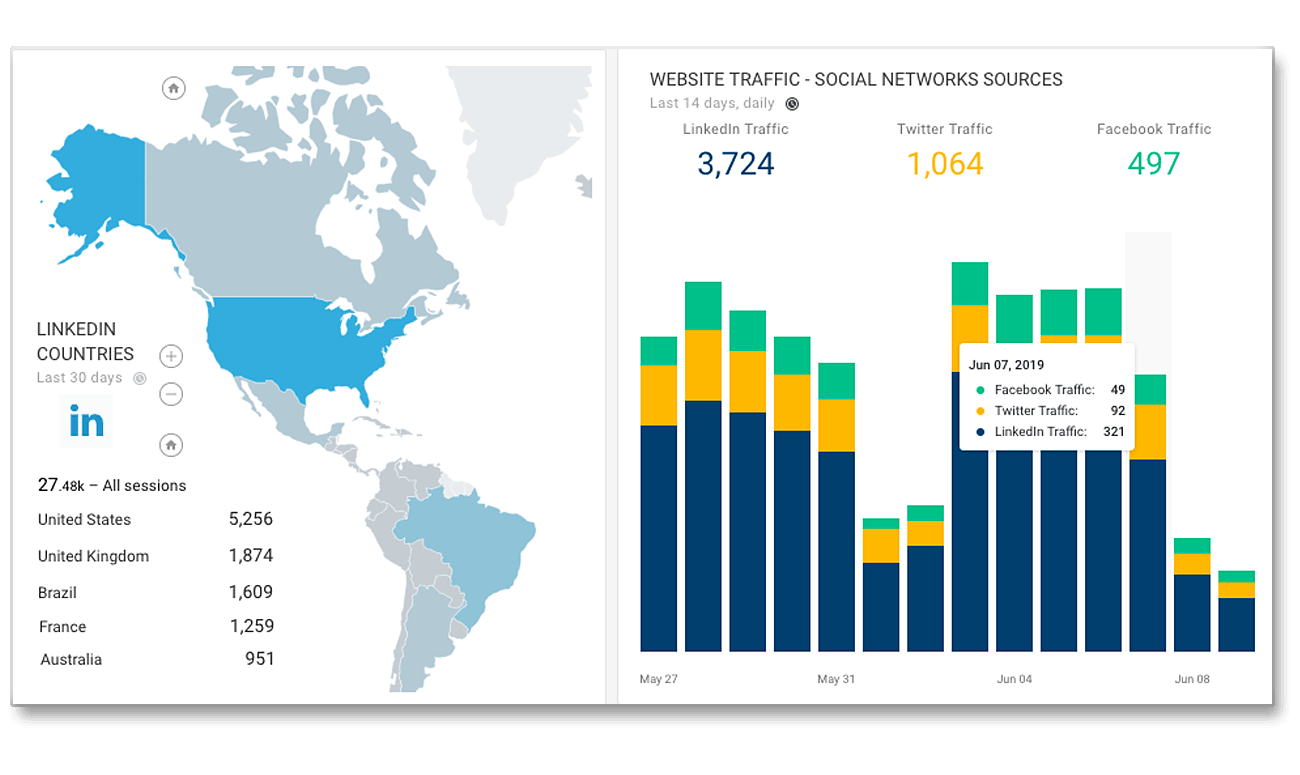
Multi-Channel Data in One Graph
Want to see the full picture of your ad spend across Google, Bing, Facebook and LinkedIn in one graph? This is what mashups are for.
Our data blending technology also works with Sales, Web Traffic, Leads or any data you can load from Google Sheets.
Use Mashup Widgets
For Complete Data View
Data blending is really easy with Octoboard. Simply select multiple cloud data sources and choose visualisation - stacked bar graph, table, pie chart or a map.
Our platform will start aggregating and updating your multi-channel data view automatically.
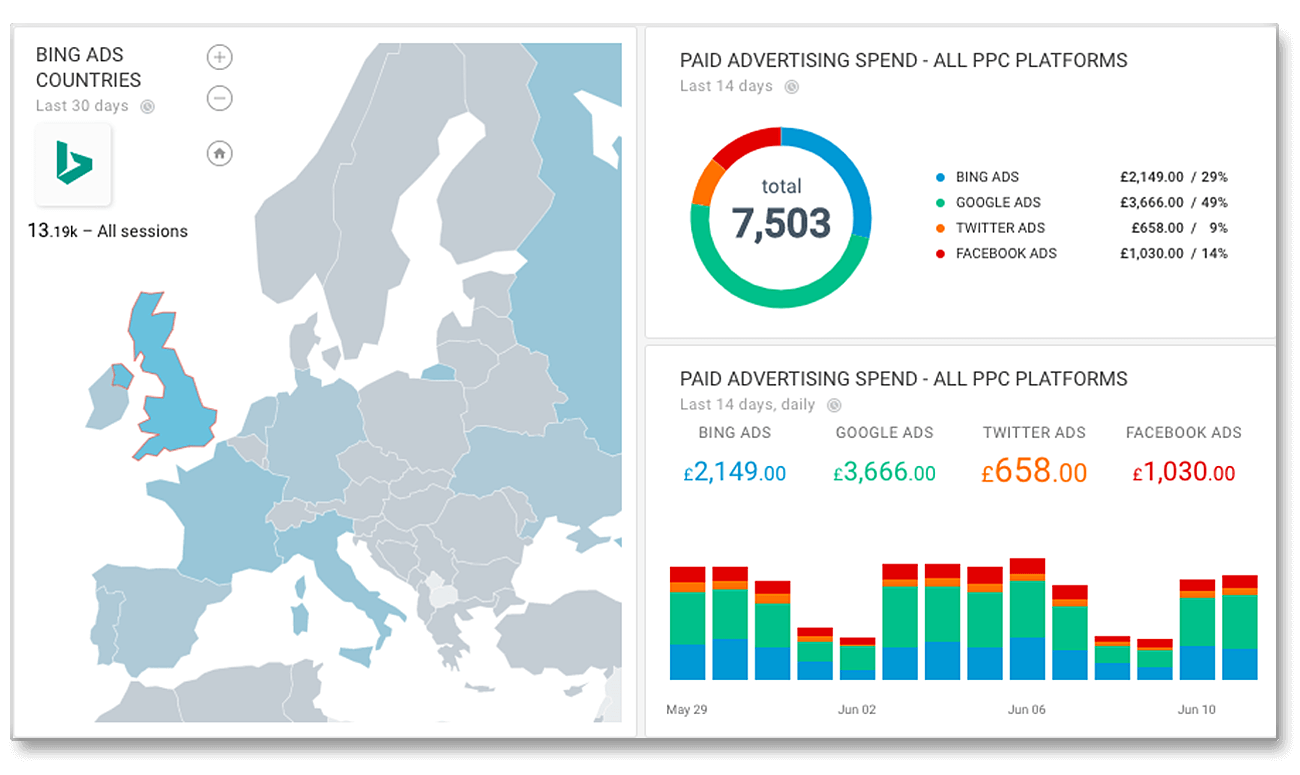
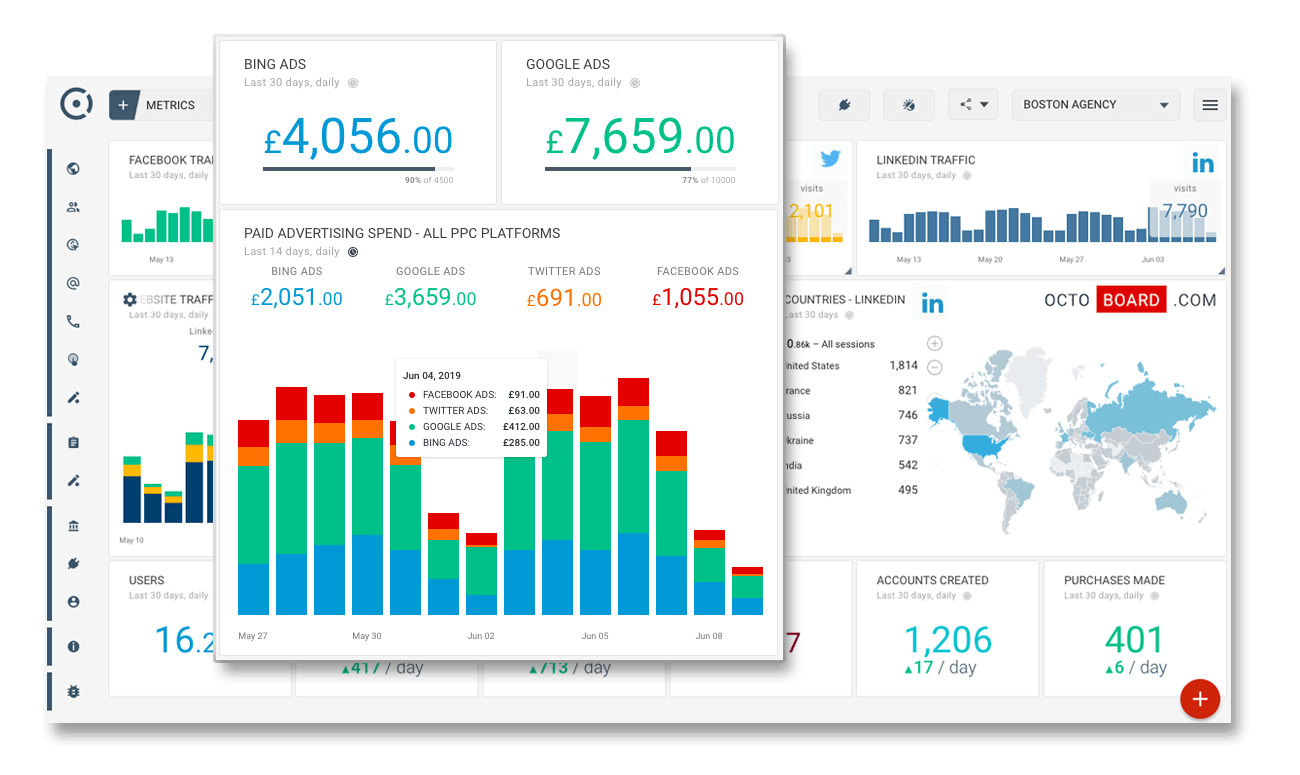
All Paid Advertising
Platforms Combined
Connect to PPC platforms that you use and show your total spend in one mashup graph. Benchmark payment platforms.
Monitor changes over time and fine-tune your paid advertising efficiency across channels.
Clicks, Spend, ROI
For All Channels
Select any metric and setup your multi-channel PPC monitoring dashboards and reports in minutes.
Octoboard will keep updating the data and will send insights to your email box.
Campaigns, Conversions
— Easy Configuration
Select any paid advertising data source and display historical graphs in multiple currencies, colours, numeric formats.
Configure and compare performance of PPC goals and campaigns over time. Measure effectiveness of every advertising dollar.
All SEO Platforms in One Graph
Connect to SEO platforms that you use and show your goals and conversions in one mashup graph. Monitor changes over time and fine-tune your SEO performance across all search engines.
Goals and Conversions
For All Channels
Select any metric and set up your multi-channel SEO monitoring dashboards and reports in minutes. Octoboard will keep updating the data and will send SEO insights to your email box.
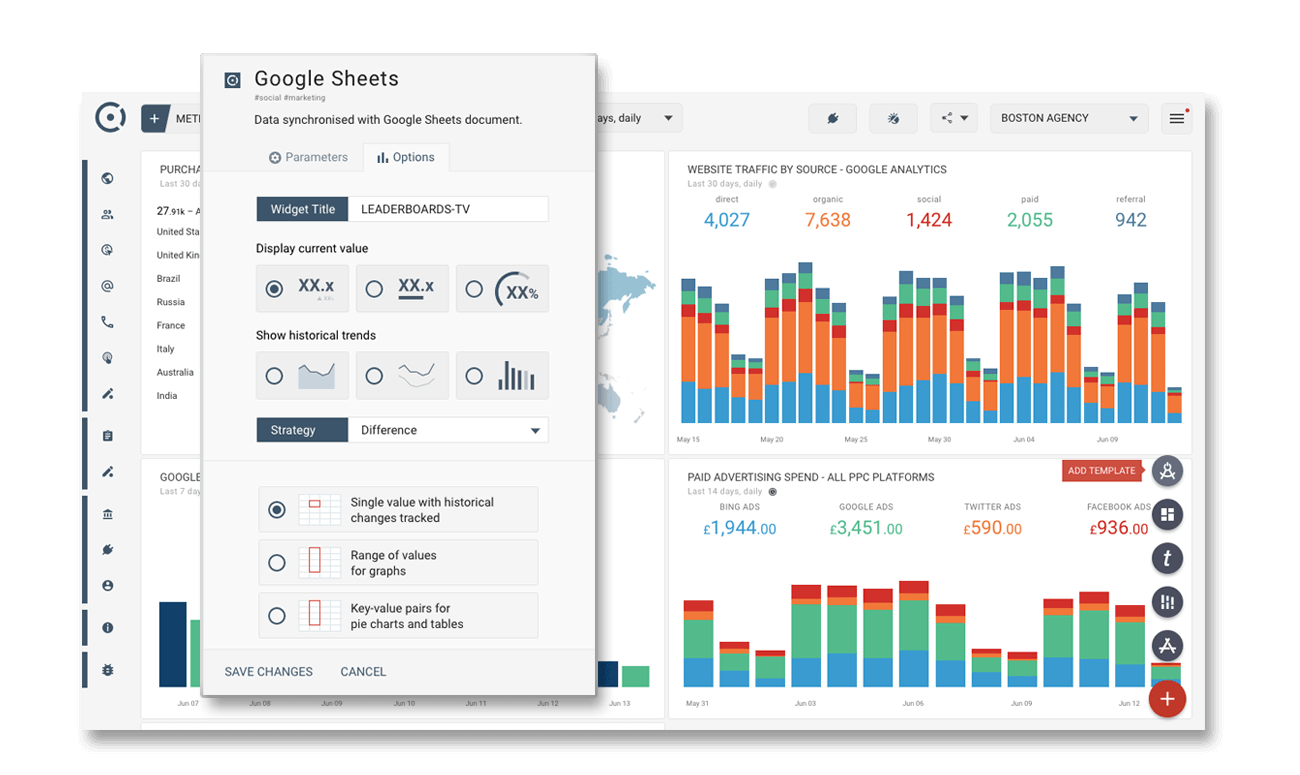
Google Sheets Integration
Included in every plan
Convert any Google Sheets document to a dashboard or PDF report and display it on Office TV, client portal, intranet website or send by email.
This is a free add-on and a feature of any Octoboard plan.
Load Proprietary Data
Combine with any data source
Use any visualisation. Octoboard can monitor changes in a Google Sheets cell and automatically build a graph of historical changes in a dashboard.
Use Google Sheets documents to display any proprietary data alongside cloud data trends from 70 integrations in over 350 data templates from Octoboard.
Document Updates
Tracked Automatically
Update your document using any available method - Zapier, data imports, manual data uploads.
Octoboard will identify any changes and will update your Office TV dashboards automatically.


