Data Explorer configuration options
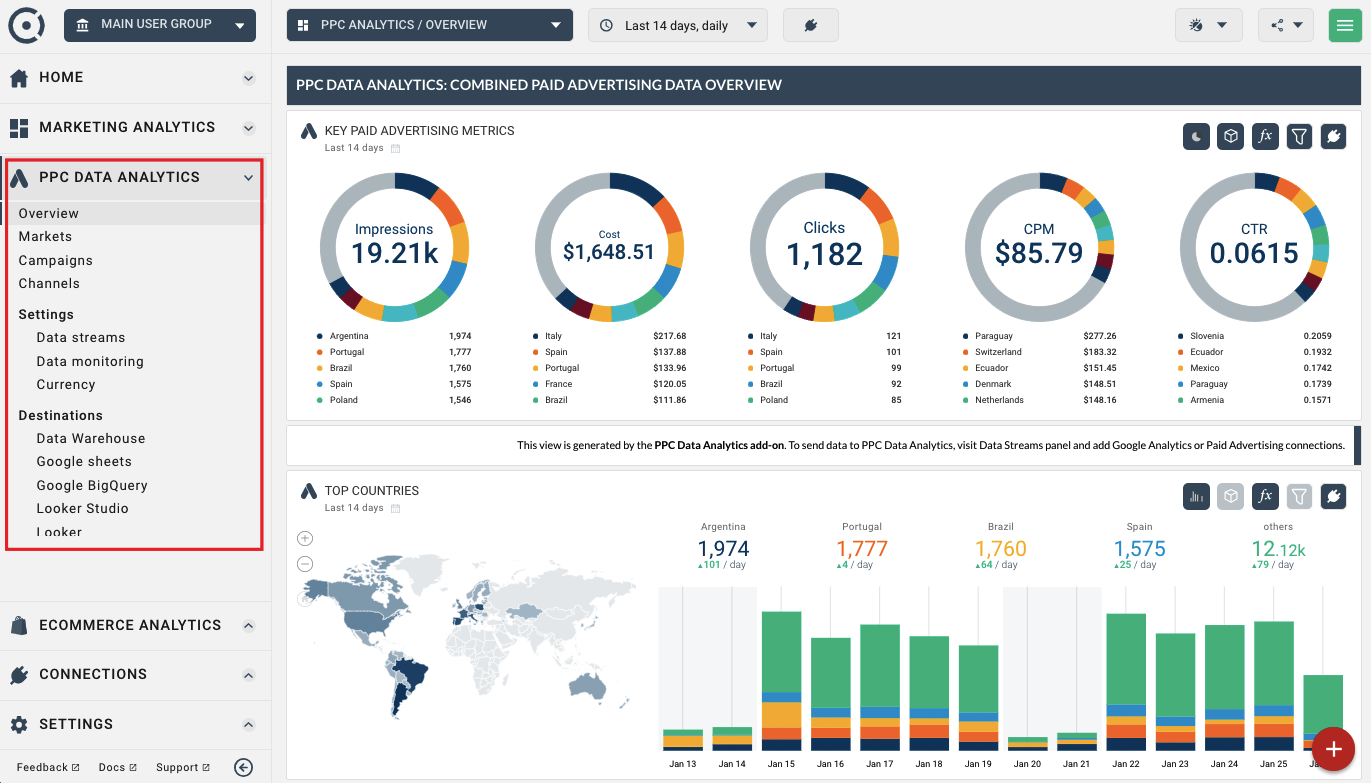
Data Explorer widgets can combine PPC Analytics Product data from multiple data sources (data streams) and display custom rules metrics and dimensions.
The image below shows a customisable dashboard that is part of the PPC Analytics module:
You can also use Data Explorer widgets in standard dashboards as well as add them to any dashboard or report of the core Octoboard product (Octoboard for Business and Octoboard for Agencies).
Here is an example of a Data Explorer widget used in the Website Traffic dashboard - a standard Octoboard dashboard available for Google Analytics connection.

When you first start using PPC Data Analytics in Octoboard, Data Explorer widgets will not show any data. You will see information messages at the bottom of the widgets that would allow you to add new connections.
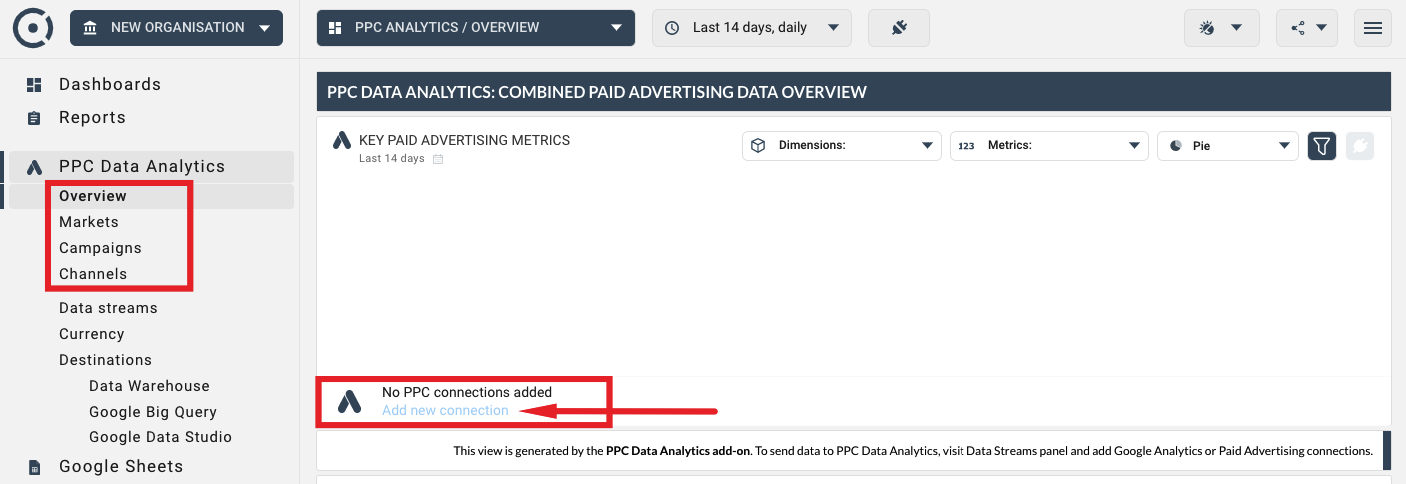
Simply click the "Add New Connection" link to access the data connection wizard. For more details on how to manage connections in the PPC Data Analytics Add-on, please read this tutorial.
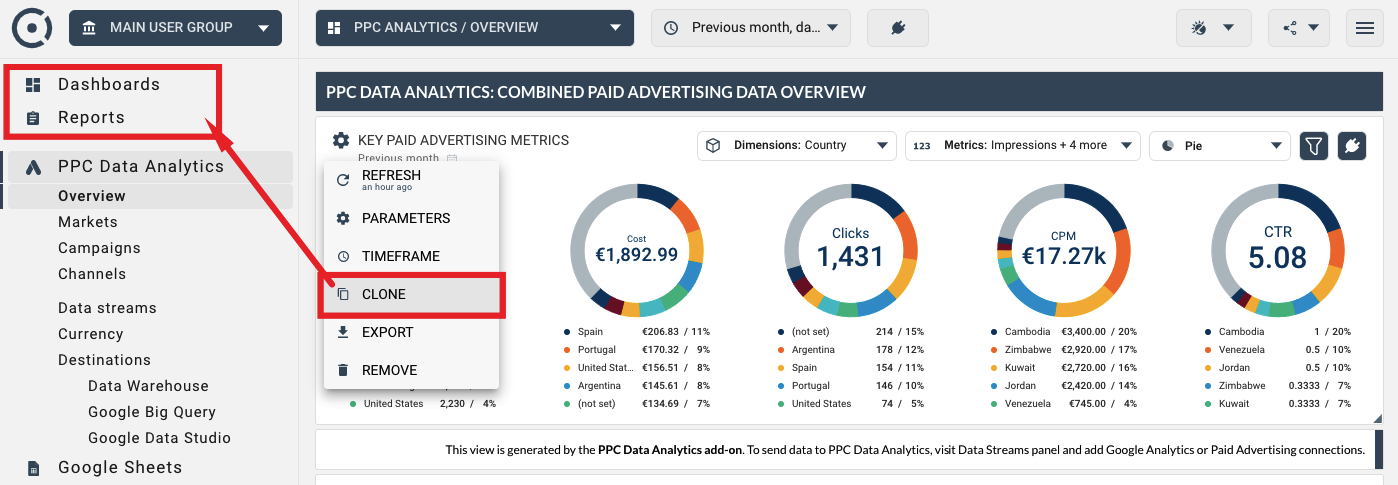
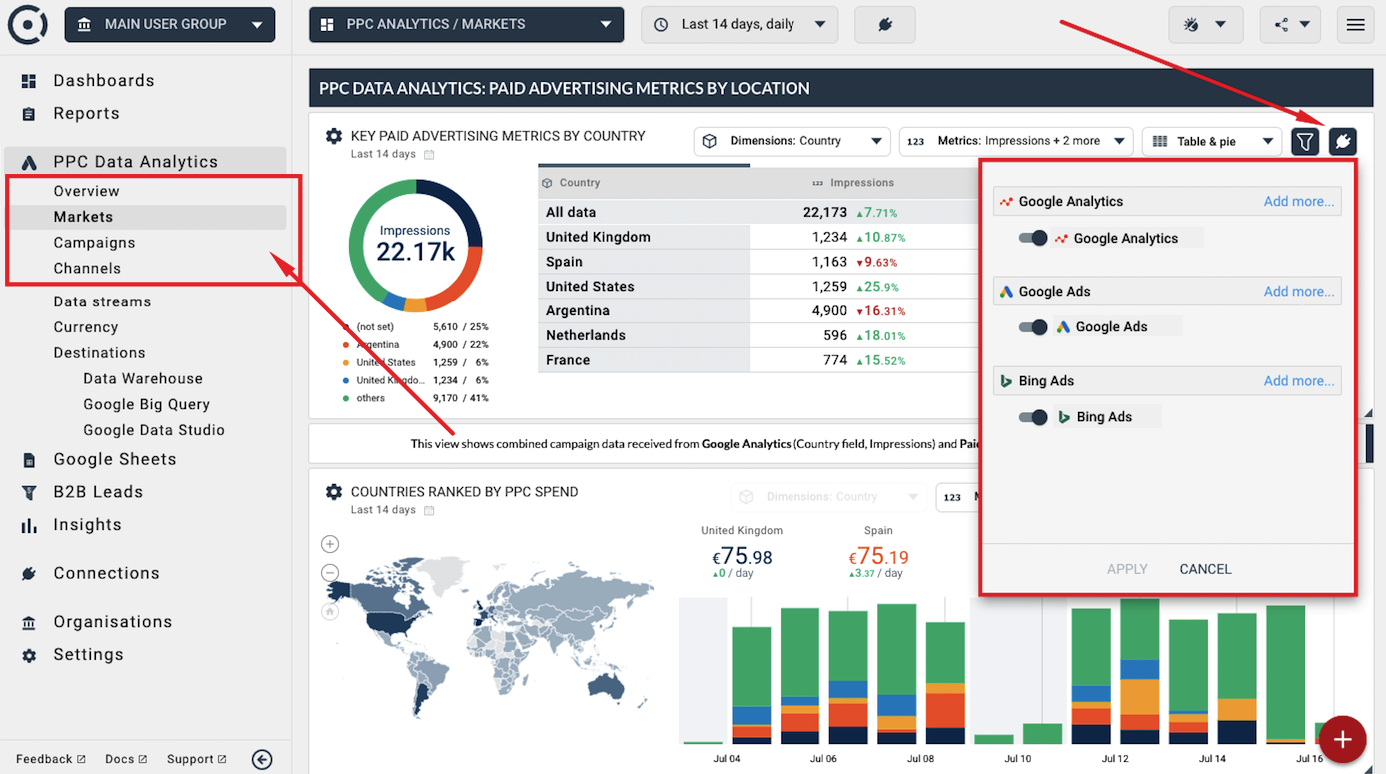
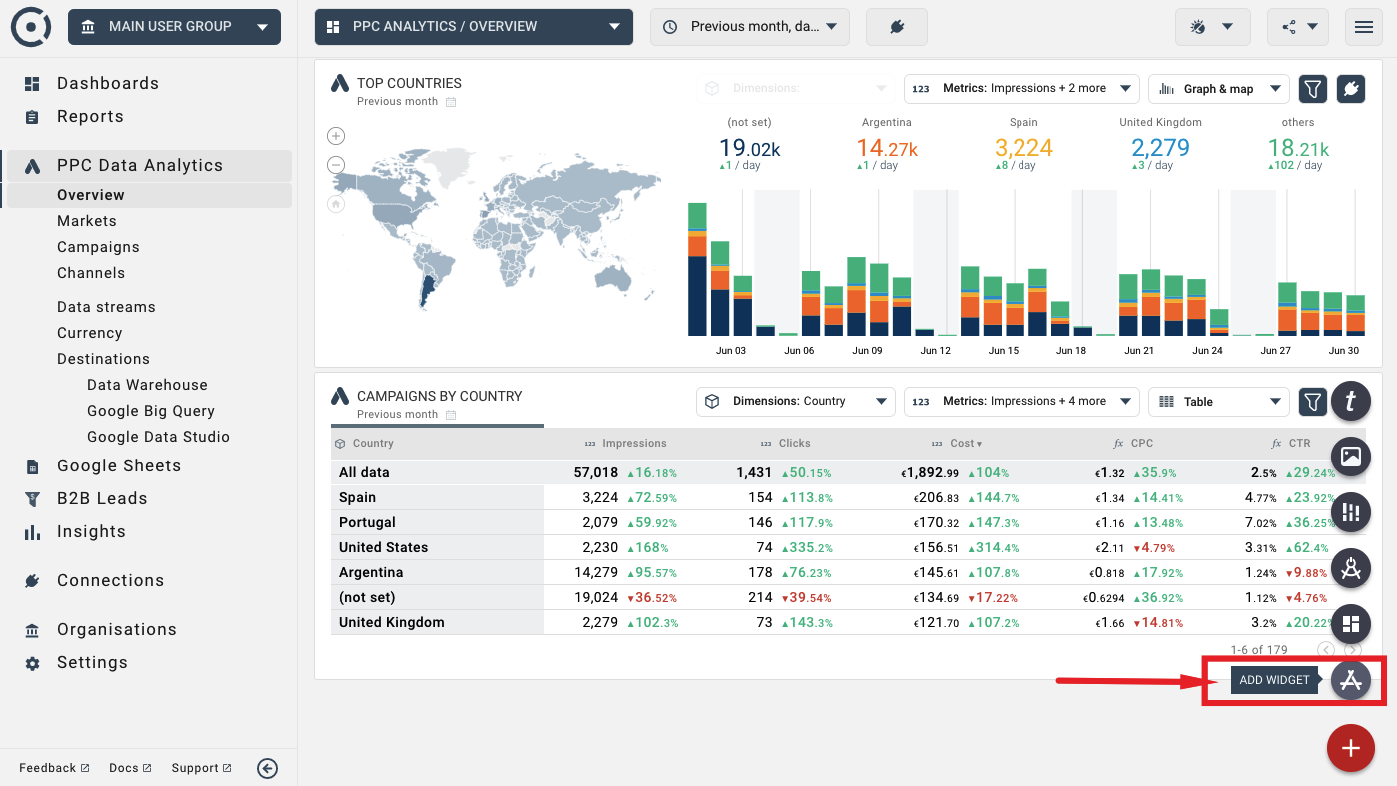
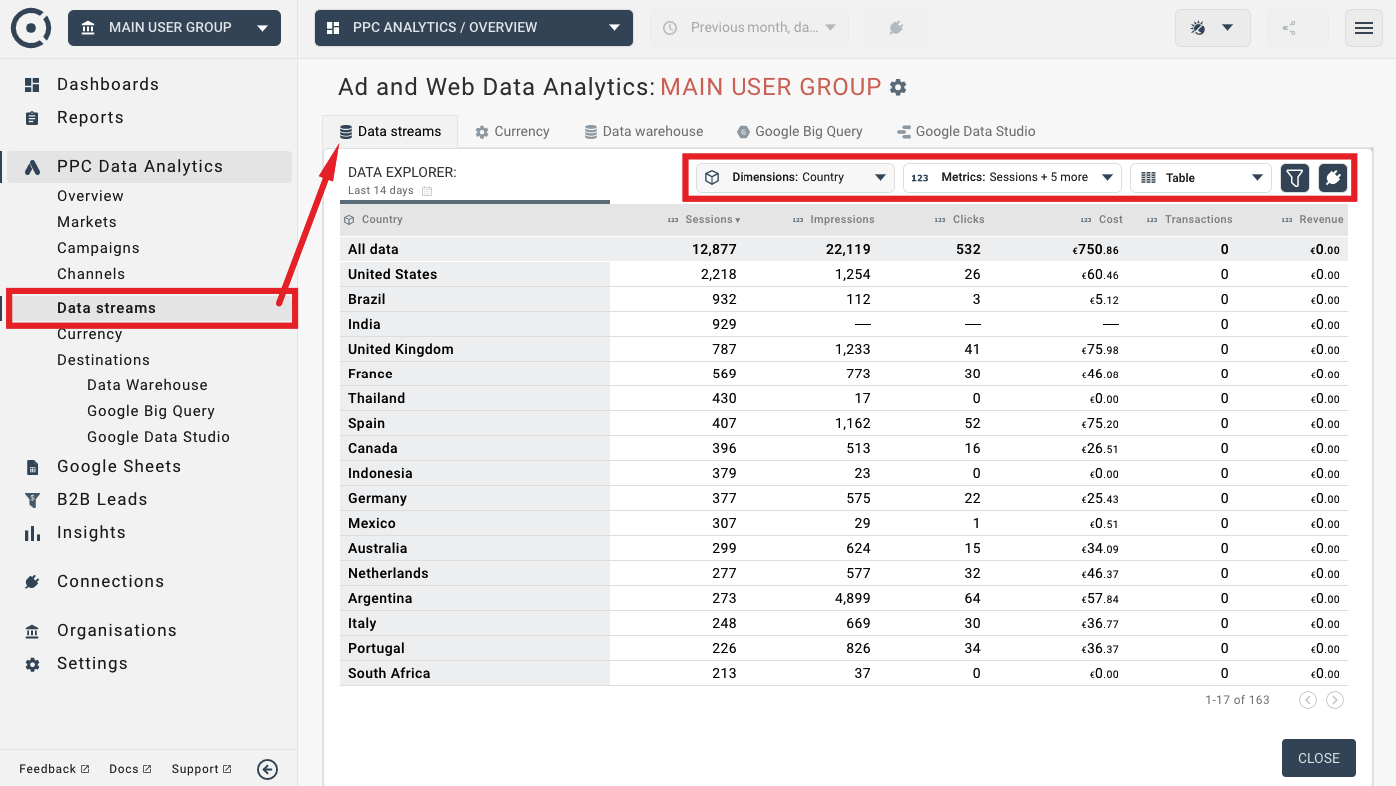
Data Explorer widgets are designed to show PPC Analytics data for any number of streams that contribute to the combined data stream. Use the CONNECT icon in the Data Explorer to switch the data view to a different stream set:
By default, Data Explorer displays data for the Combined (Multi-channel) data stream in your organisation (Octoboard client or team). However, you can add a new Data Explorer widget that shows data for Standard or Custom streams. Use the ADD WIDGET button to add more Data Explorer widgets to your dashboards and reports.
In the connection wizard, select Data Analytics application and Data Explorer widget. And in the final step, select an individual Custom, Standard or Combined Multi-channel data stream.
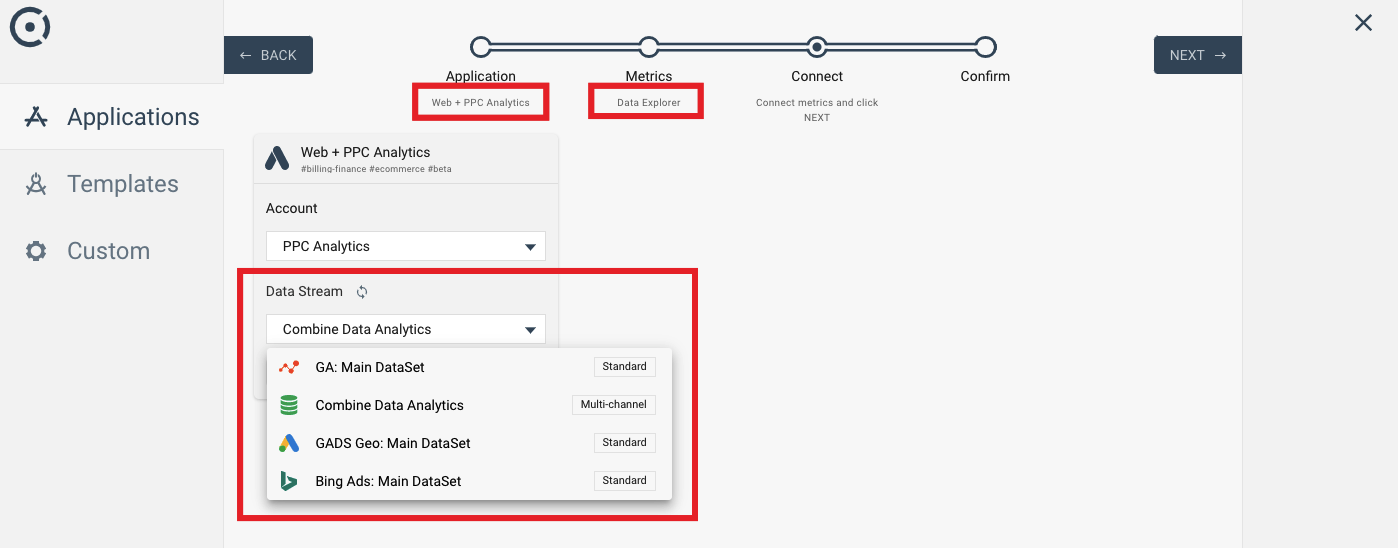
For more details on PPC Analytics data streams, please read this tutorial.
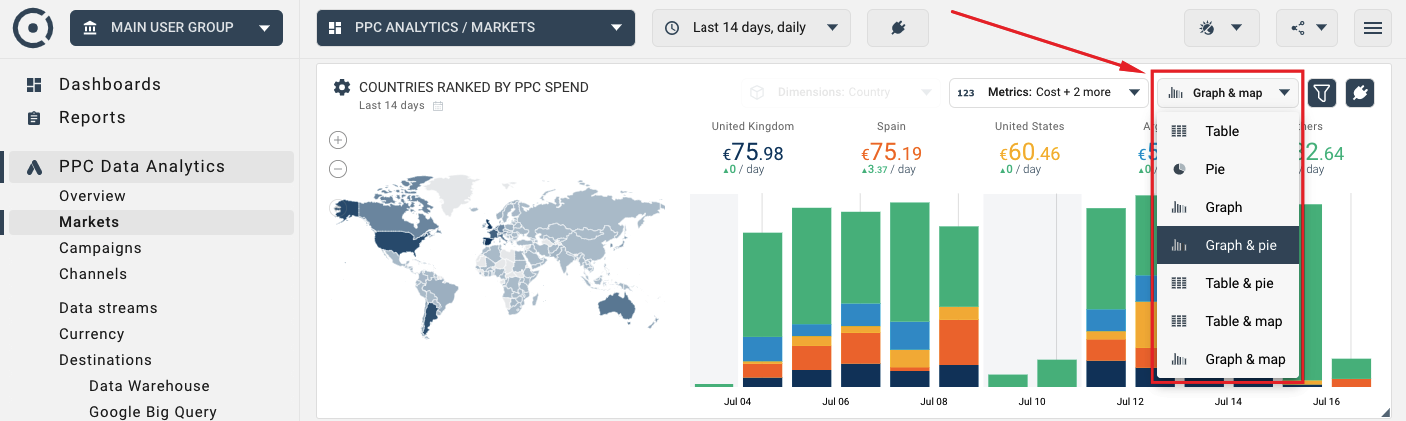
Data Explorers support combinations of graphs, pie charts and table data visualisations. If the selected data source contains a country dimension, the data explorer will allow you to display geographical maps.
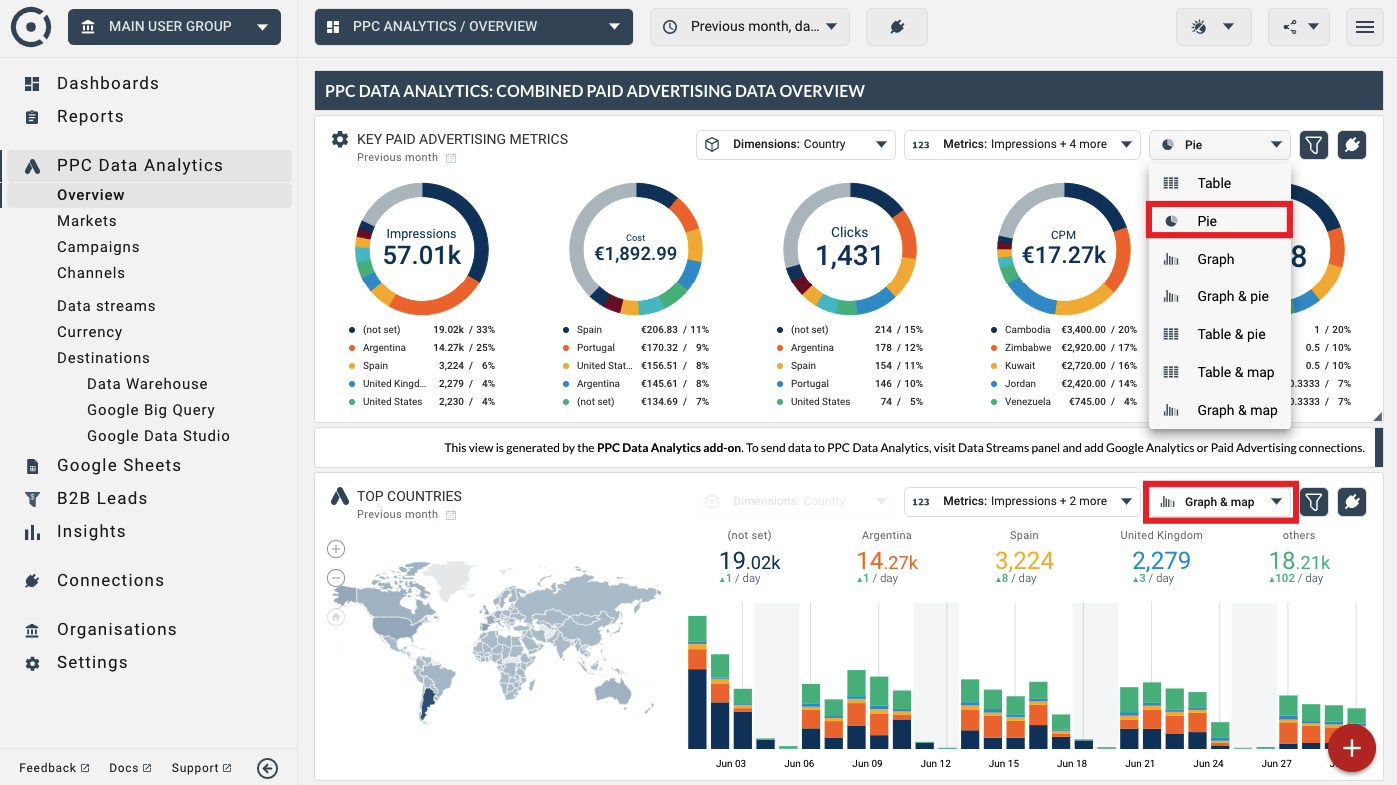
Two more visualisation types - pie charts and map - is shown below:
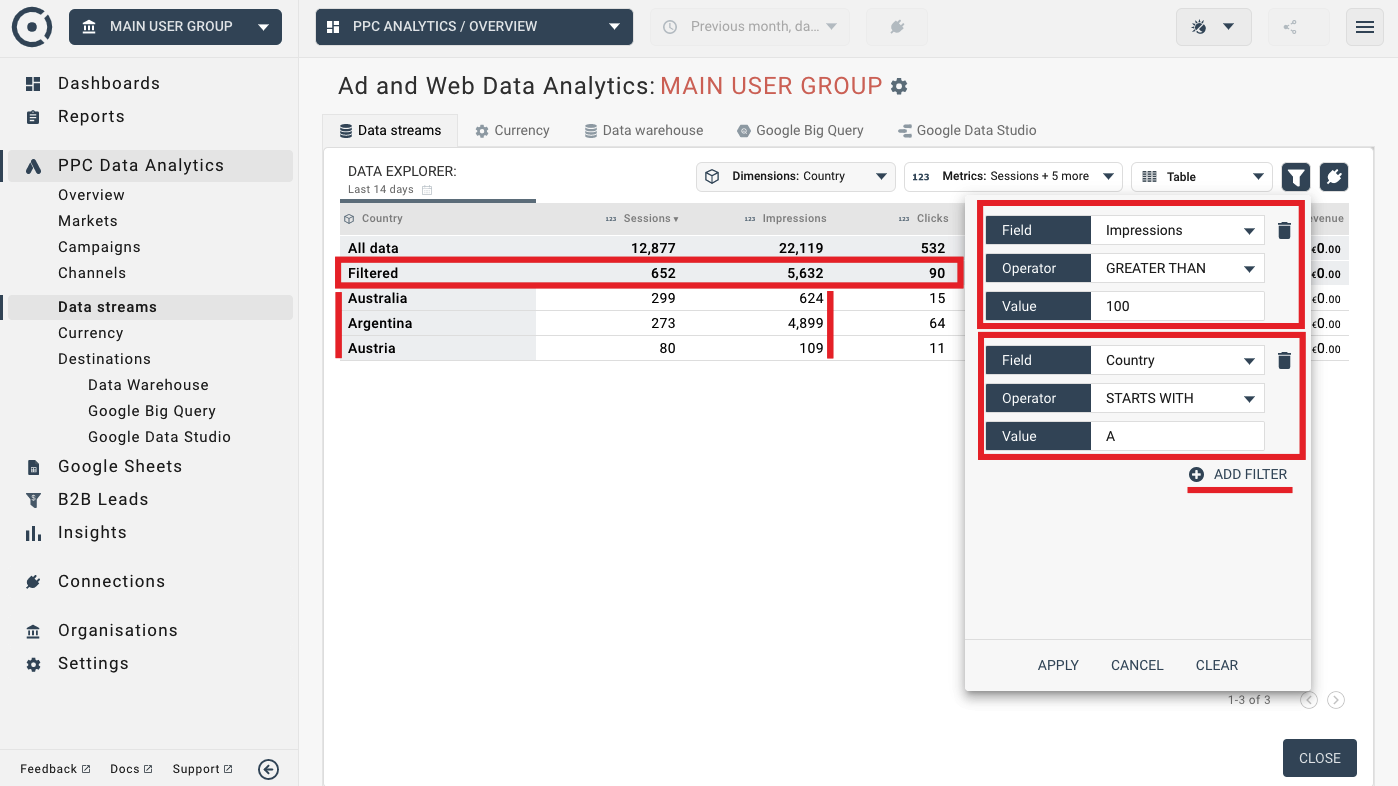
Use the Filter icon to access filtering functionality. A number of mathematical and text comparison functions are available for building filters. Filters can be combined and applied to multiple columns or data values. An image below shows a complex filter that displays data for countries that start with “A” and that have more than 100 Impressions in the selected timeframe.
When you connect a data source such as Google Ads, our platform uses historical currency exchange data to convert values of financial metrics to the presentation currency that you can modify.
To modify the presentation currency used in data explorer widgets and data exports, use the Currency option in the left panel:
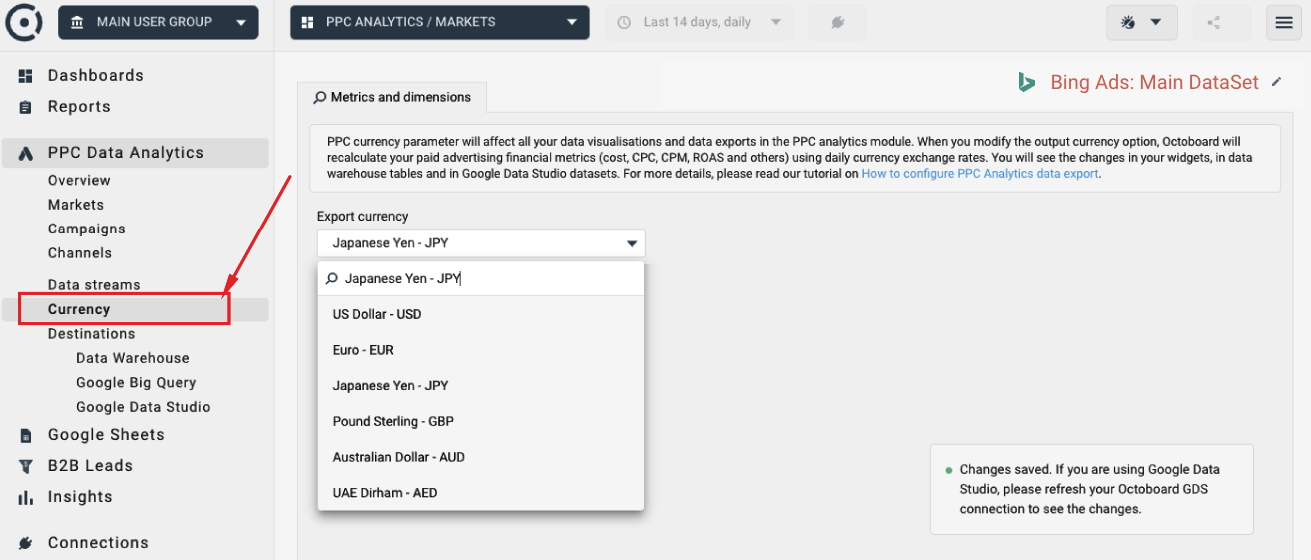
The PPC presentation currency parameter affects all data visualisations and data exports in the PPC analytics module. When you modify the presentation currency, Octoboard will recalculate your paid advertising financial metrics (cost, CPC, CPM, ROAS and others) using daily currency exchange rates. You will see the changes in your widgets, in data warehouse tables and Google Data Studio datasets.
If you are using Google Data Studio, please refresh your Octoboard GDS connection to see the changes. The currency changes made in the PPC Analytics module do not affect the currency conversion in the Octoboard Marketing Analytics product (non-PPC Analytics dashboards and reports).
You can select metrics and formulas in the Data Explorer by using the drop-down controls in the header of the widget as shown in the image below:
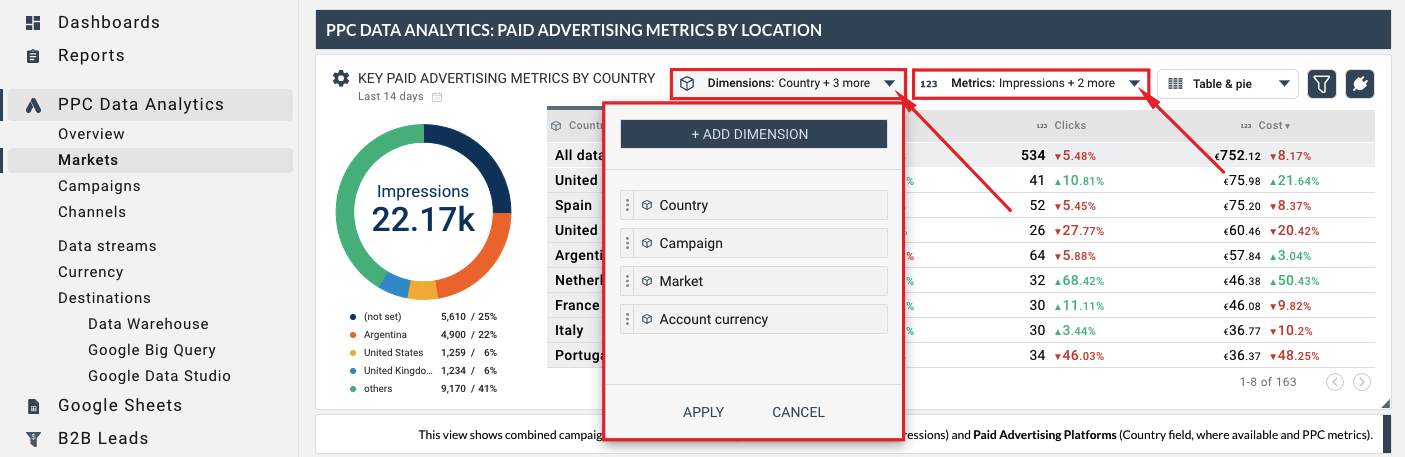
The following image shows metrics and dimensions inspected in a Data Explorer:
Creation of custom formulas, metrics and dimensions in the PPC Data Analytics Add-on is covered in more details in the following data transformation tutorials: