Data Streams overview
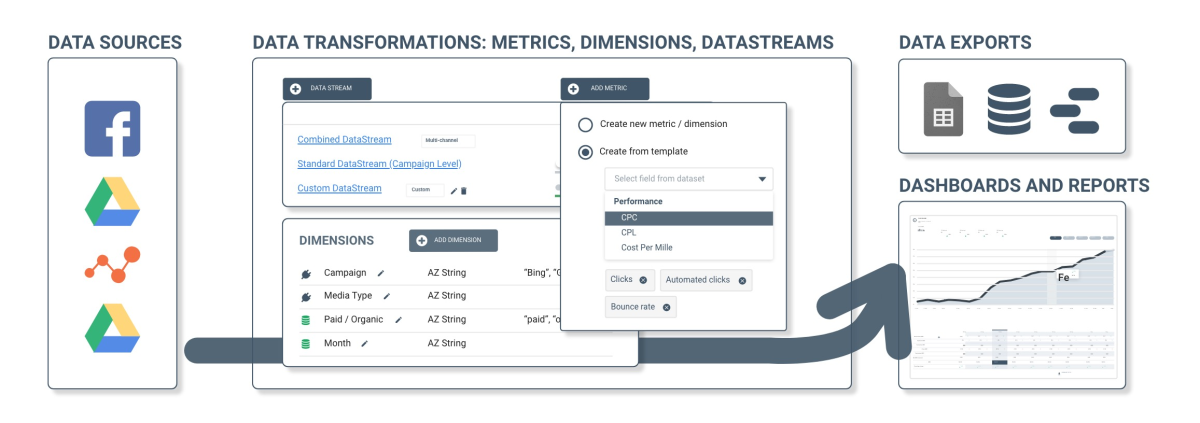
PPC Data Analytics Add-on is designed to collect, transform and export Paid Advertising and Google Analytics data. With PPC Analytics you can create new metrics, formulas, data dimensions and build data views that span normalised data across different accounts and advertising platforms.
Whenever PPC Data Analytics connects to a data source and starts collecting data, it creates Data Streams. A Data Stream is an independent flow of data from one or multiple sources. Every Data Stream is made up of data dimensions and metrics that you can modify and extend using the Octoboard data transformation engine. Marketing agencies and online businesses use Data Streams to build dashboards and reports directly in the Octoboard platform as well as send individual streams to external data systems.
Data Streams can be of the following types:
- Standard Data Streams - pre-defined streams with modifiable metrics and dimensions
- Custom Data Streams - user-defined streams that allow addition of new metrics and dimensions
- Combined Multi-Channel Data Streams - combines data that comes from all Standard Data Streams
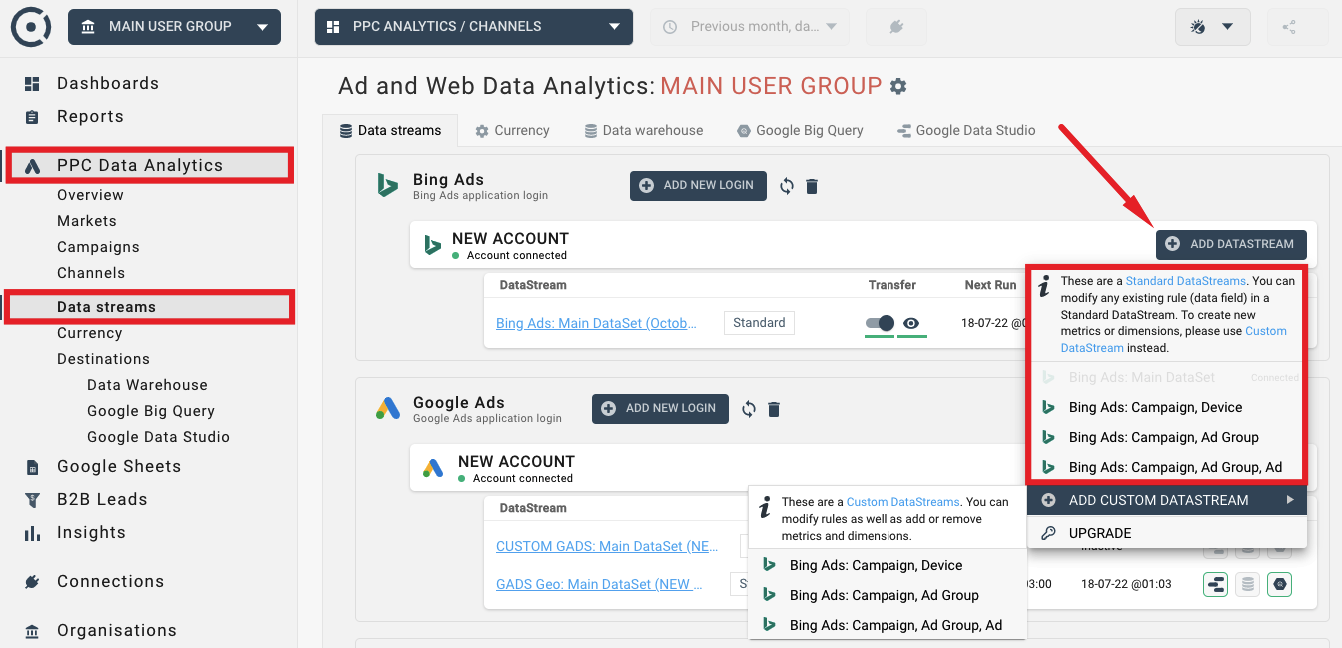
There is always a pre-defined Standard stream per data source. You can modify any existing metric, dimension or formula in a Standard data stream but you cannot create new dimensions. One standard data stream is created for every new connection automatically.
You can always add more standard streams using the ADD DATA STREAM button.
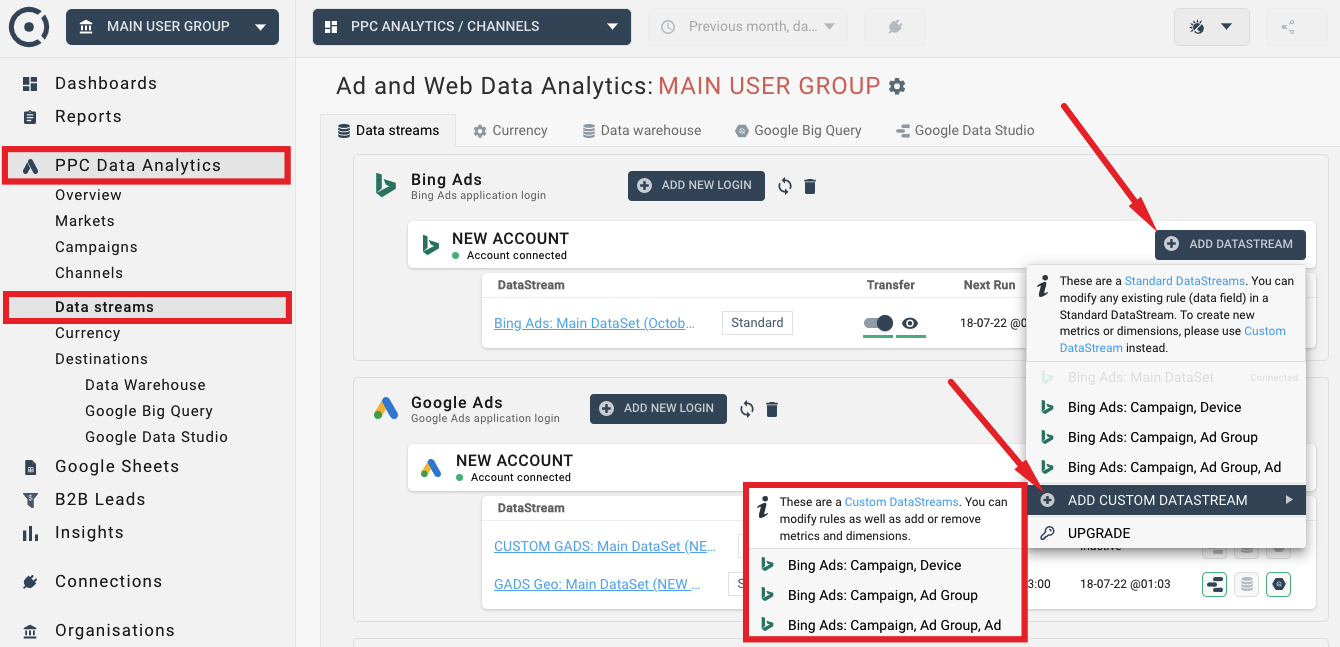
Custom Data Stream is fully customizable. It allows the creation of new metrics, dimensions and formulas. Custom Data Streams are not created by the system automatically.
You can always add more custom streams using the same ADD DATA STREAM button.
There is always one Combined Multi-Channel Stream per organisation (client or team) created automatically in the system when you enable PPC Analytics Add-on. Combined Multi-Channel streams cannot be deleted.
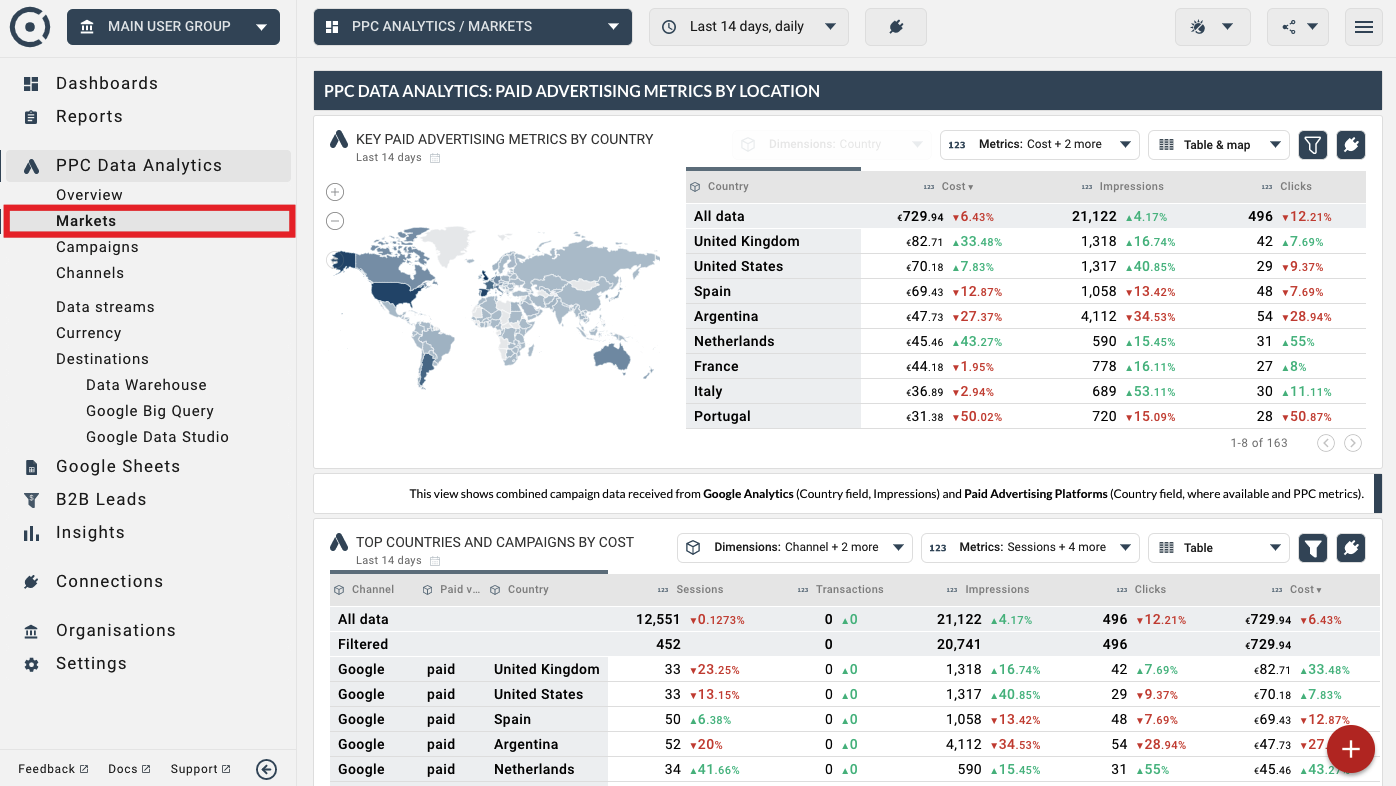
The Combined Multi-Channel Stream is always displayed at the top of the list in the PPC Data Analytics panel:

Combined Data Stream automatically receives all the PPC and Google Analytics data streams that you connect to the PPC Data Analytics module in your organisation (client or team).
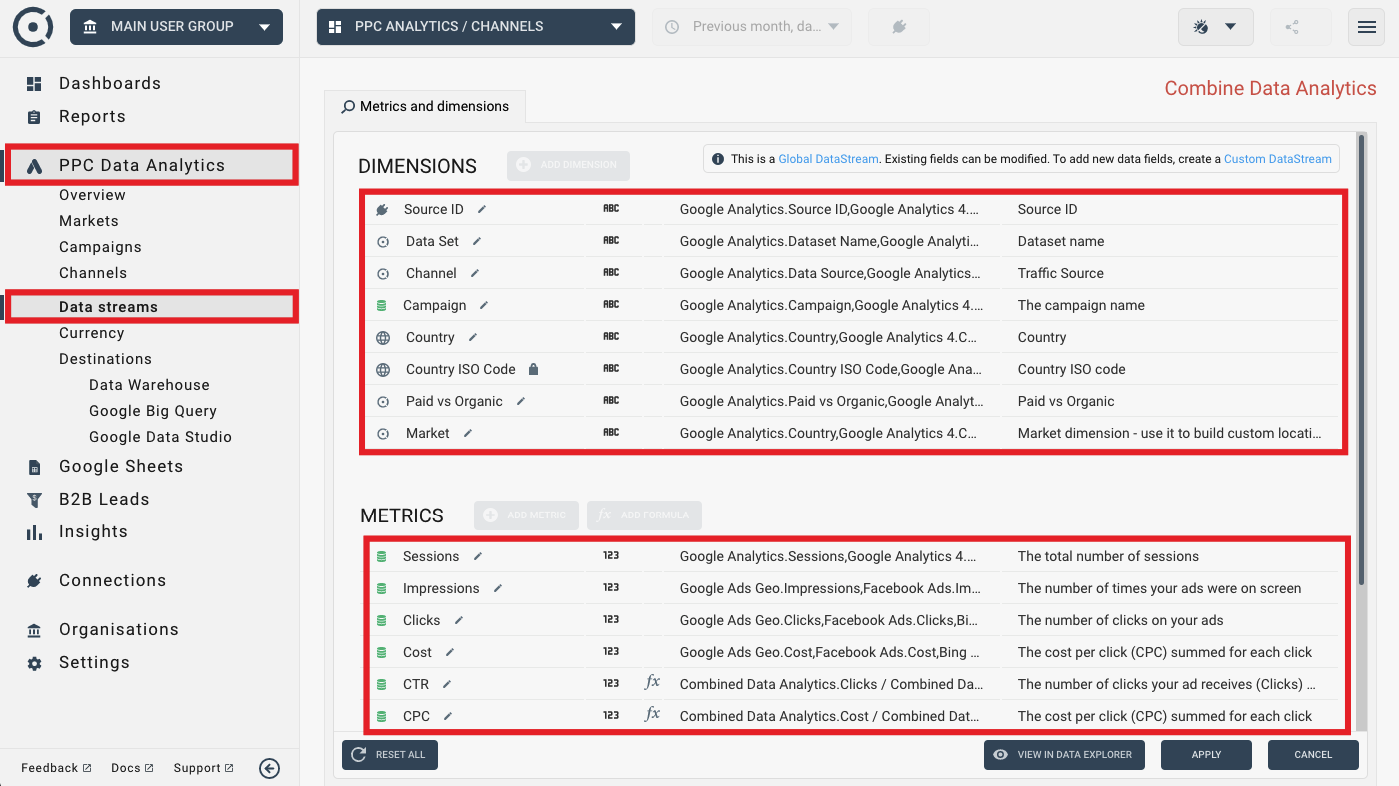
The default Combined Stream has a predefined set of metrics and dimensions shown below. You can always override the default logic.
Multi-Channel Streams use advanced data mapping and data transformation logic to combine data from different data sources (PPC platform accounts and Google Analytics properties). They have a normalised set of metrics that can be found in all Paid Advertising systems as well as metrics
These are the default dimensions of the Combined Multi-Channel Stream:
- Source ID
- Account name
- Source currency
- Data Set
- Channel
- Campaign
- Country
- Country ISO Code
- Paid vs Organic
- Market
Here is an example of a paid advertising spend view across different countries, from multiple paid advertising platforms:
These are key metrics of the Combined Stream:
- Sessions (source: Google Analytics)
- Impressions (source: PPC platforms)
- Clicks (source: PPC platforms)
- Cost (source: PPC platforms)
- CTR (source: PPC platforms)
- CPC (source: PPC platforms)
- CPM (source: PPC platforms)
- Transactions (source: PPC platforms)
- CPT (source: PPC platforms)
- Revenue (source: PPC platforms)
- ROAS (source: PPC platforms)
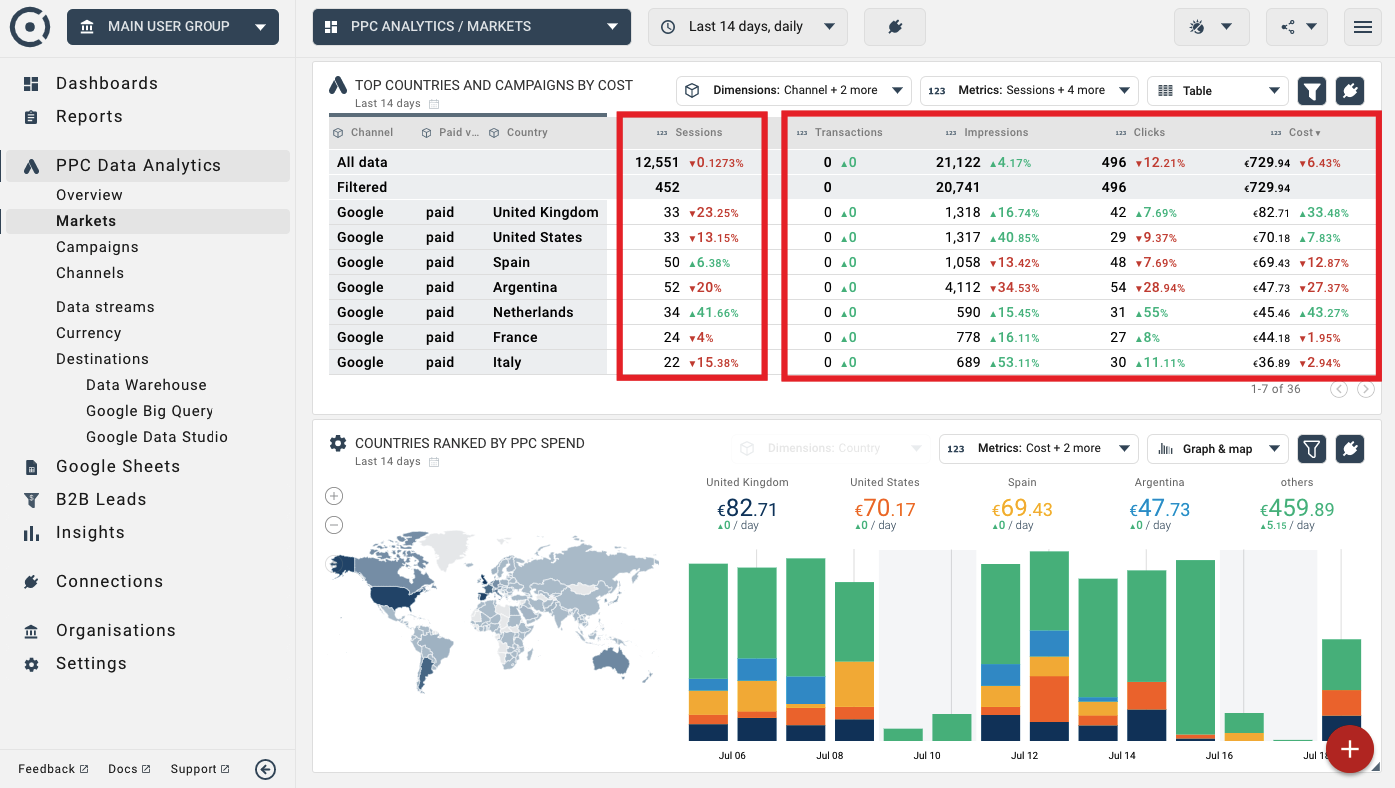
The following widget shows metrics from Google Analytics (Sessions) and Paid Advertising platforms (Transactions, Impressions, Clicks, Cost) broken down by Markets (Country) and Marketing Channels (Channel).
How to create custom dimension, rules and formulas is explained in this tutorial.
You can always change the default mapping logic and rules used to build cross-channel data views, and create new metrics and dimensions. Advanced data mapping and data transformation features of the PPC Data Analytics Add-on are discussed in more details in these tutorials.
Octoboard Marketing Analytics product allow you to build dashboards and send automated reports to clients and team members. You can create white label client portals and embed data views into website pages.
You can add Data Explorer widgets that use data streams data to standard dashboards as well as add them to any dashboard or report of the core Octoboard product (Octoboard for Business and Octoboard for Agencies).
Here is an example of a Data Explorer widget added to the Website Traffic dashboard - a standard Octoboard dashboard available for Google Analytics connections. The example shows how data from a Google Analytics API is combined with data of the Combined Multi-Channel data stream.

For more details on how to use data streams in Octoboard dashboards and reports, visit this tutorial.
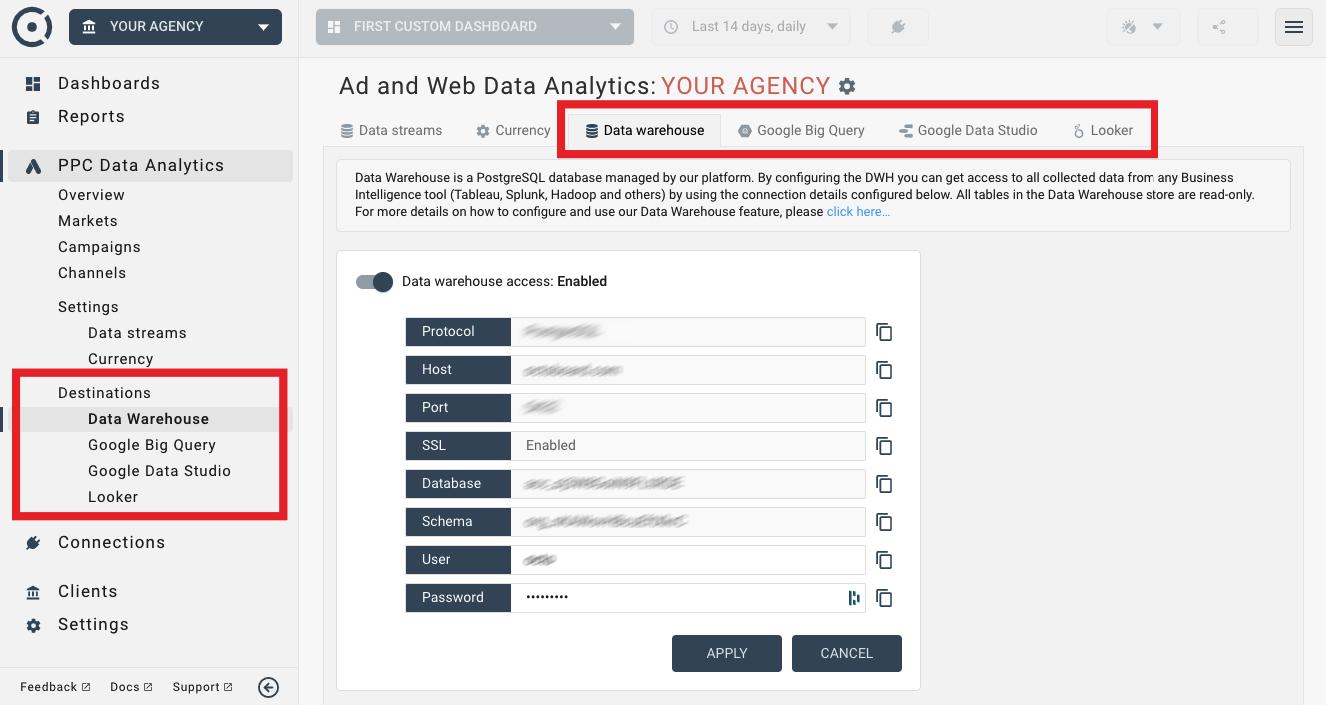
Any selected data stream - Custom, Standard or Multi-Channel - can be viewed in Octoboard dashboards and reports or sent to an external data destination such as Google Data Studio or Google BigQuery. To access data export features use the left panel area:
The following tutorials cover export configurations for every currently available data destination:
The PPC Data Analytics Add-on is an advanced analytics module of the Octoboard platform. We recommend reading the following tutorials for more information on how to work with the add-on:
Creation of custom formulas, metrics and dimensions in the PPC Data Analytics Add-on is covered in more details in these tutorials: