How to combine data in multi-channel stream
There is always one Combined Multi-Channel Stream per organisation (client or team) created automatically in the system when you enable PPC Analytics Add-on. Combined Multi-Channel streams cannot be deleted.
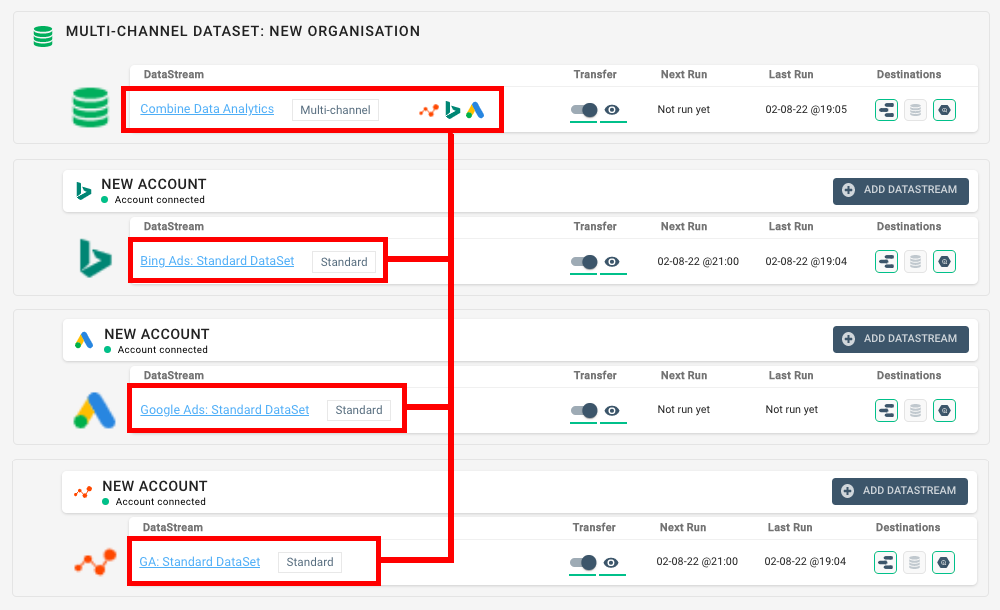
In this example, Multi-Channel Stream receives data from Google Ads, Bing Ads and Google Analytics accounts (from three Standard Streams):
When you look at the data in the Data Explorer in Octoboard, you can select what combination of data streams you would like to see. The image shows all three streams combined in one data table and historical graphs breaking Impressions, Cost and Revenue by Country:
Octoboard maintains internal tables of data fields (dataset tables) that automatically map compatible dimensions and metrics in Paid Advertising and Google Analytics streams. In this case, it sends the following metrics and dimensions to the Combined Multi-Channel stream:
- Dimension Channel - ID of the paid advertising channel such as “Bing”, “Google”, “AdRoll” etc.
- Dimensions Country - location text fields found in Google Analytics and PPC platforms
- Metric Sessions - available in Google Analytics stream
- Metrics Impressions, Clicks, Cost and CPC - available in all PPC platforms
When you take all of the above data fields, combine them in the Multi-Channel stream and break it down (or aggregate) by the source Data Stream (or Data Set), it looks like this:
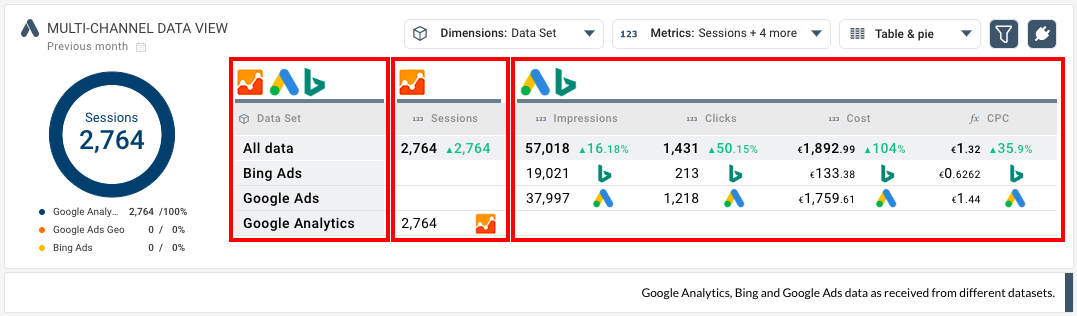
You can see what metrics come from what Data Stream (DataSet). These three records are a result of aggregating thousands of rows of data that the Octoboard receives from Google Analytics and PPC platforms.
Now let’s add the “Channel” field (a dimension available in all datasets):
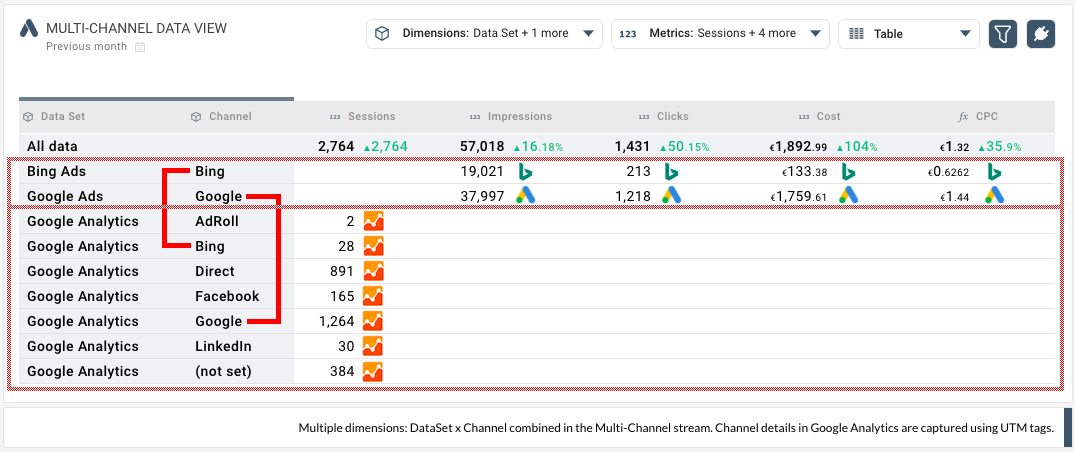
Note that Bing Ads records only contain “Bing” Channel value, Google Ads records only show “Google” and Google Analytics produces “Bing”, “Google”, “AddRoll”, “Direct”, “Facebook”, “LinkedIn” and “(not set)”.
This is because Bing Ads Data Stream is configured to always fill the Channel value with “Bing”, Google Ads always produces “Google”, while Google Analytics looks at every record’s UTM tag (source and medium) and fills the Channel field with the correct values based on the source and medium of the record. If UTM tags are not available, Google Analytics writes “(not set)” to the Channel field.
As you can see from the image above, there are matching Channel values “Google” and “Bing” found in Bing Ads, Google Ads and Google Analytics data sets.
Also, note that the Sessions metric is only available in the aggregated Google Analytics records, while PPC metrics (Impressions, Clicks, Cost and CPC) are available for Bing Ads and Google Ads only.
Now let’s remove the Data Set field and allow Data Explorer to aggregate data by Channel only:
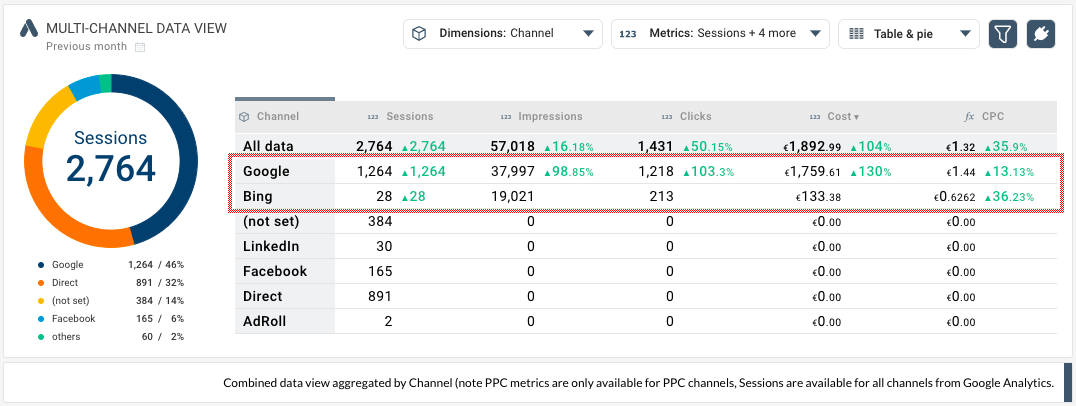
You can see that Google Analytics Sessions and PPC metrics Impressions, Clicks, Cost and CPC can now be found in the same records for Bing and Google channels. This is because data from Google Analytics and Bing Ads could be combined for all records that had “Bing” in the Channel value. Same for “Google” for Google Analytics and Google Ads.
As you can see, PPC metrics are not available for Channels “LinkedIn”, “Facebook” and others. This is because these channel values were found in the Google Analytics records only (based on the source and medium values or UTM tags), but there were no PPC data sources such as Facebook Ads connected to this account to offer Impressions, Clicks and other PPC metrics. The CPC formula is not calculated for these channels either since we do not have Cost or Click values.
If we add another data source such as LinkedIn Ads as a connection to the Octoboard PPC Analytics add-on, the cross-channel view would have LinkedIn Ads channel details.
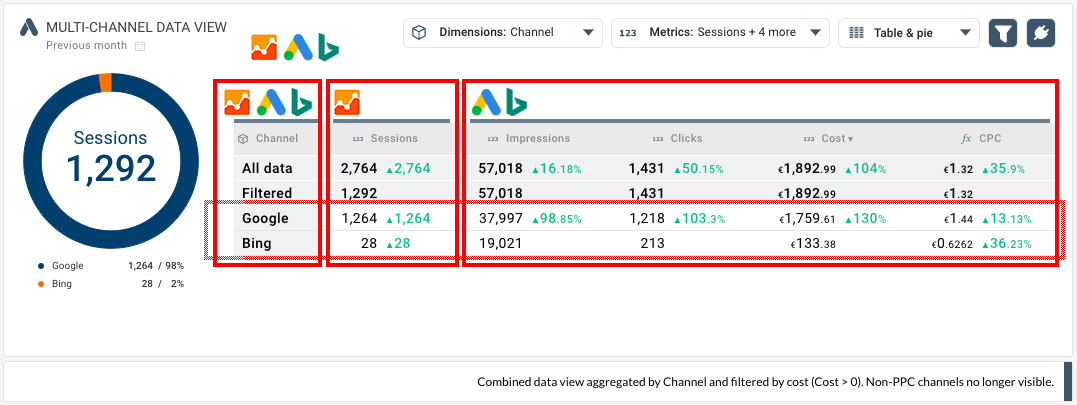
If we filter the records by Cost (Cost > 0) in the Data Explorer, we will have the following data view. Note that only Google and Bing channels are visible. They are added up in the Filtered row.
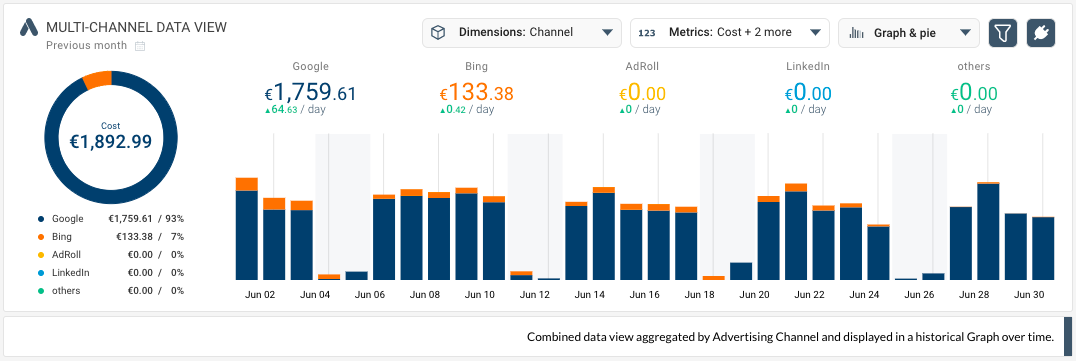
We can change data visualisation in the Explorer widget. In this case, we look at the same data displayed in a historical stack graph. Every bar of the graph represents a day and the pie chart on the left shows the total cost from the two PPC channels.
The above case shows simple aggregations (breakdowns) by Channel. We can do the same for other dimensions and even combine them to create multi-dimensional graphs. Location and Campaigns dimensions are among the most popular for cross-channel PPC analytics.
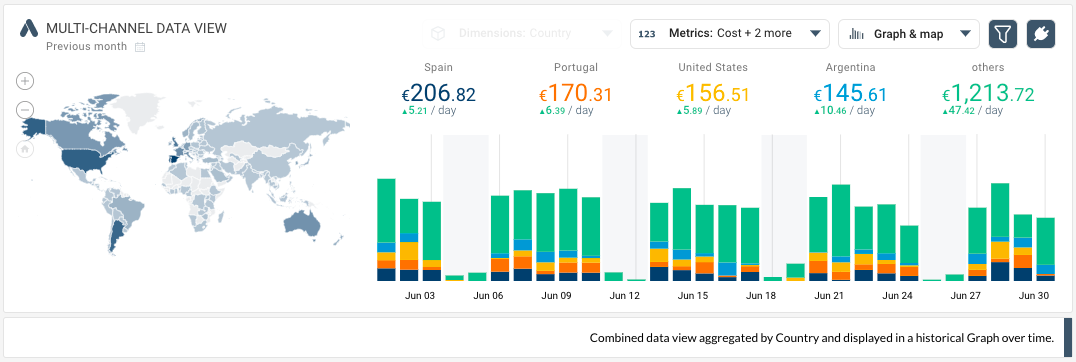
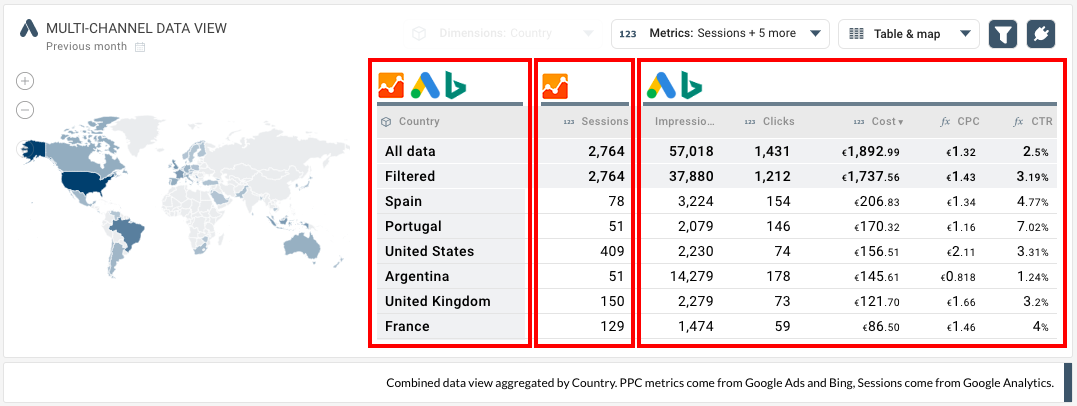
In the image below we have selected Location. The table shows the same data aggregated by Country. The table is also filtered and sorted by Cost.
Below is the same data displayed in the historical stacked bar graph showing Ad Spend with the breakdown by country. The map on the left uses ISO country codes available in the Combined Multi-Channel DataStream.