Creating custom metrics
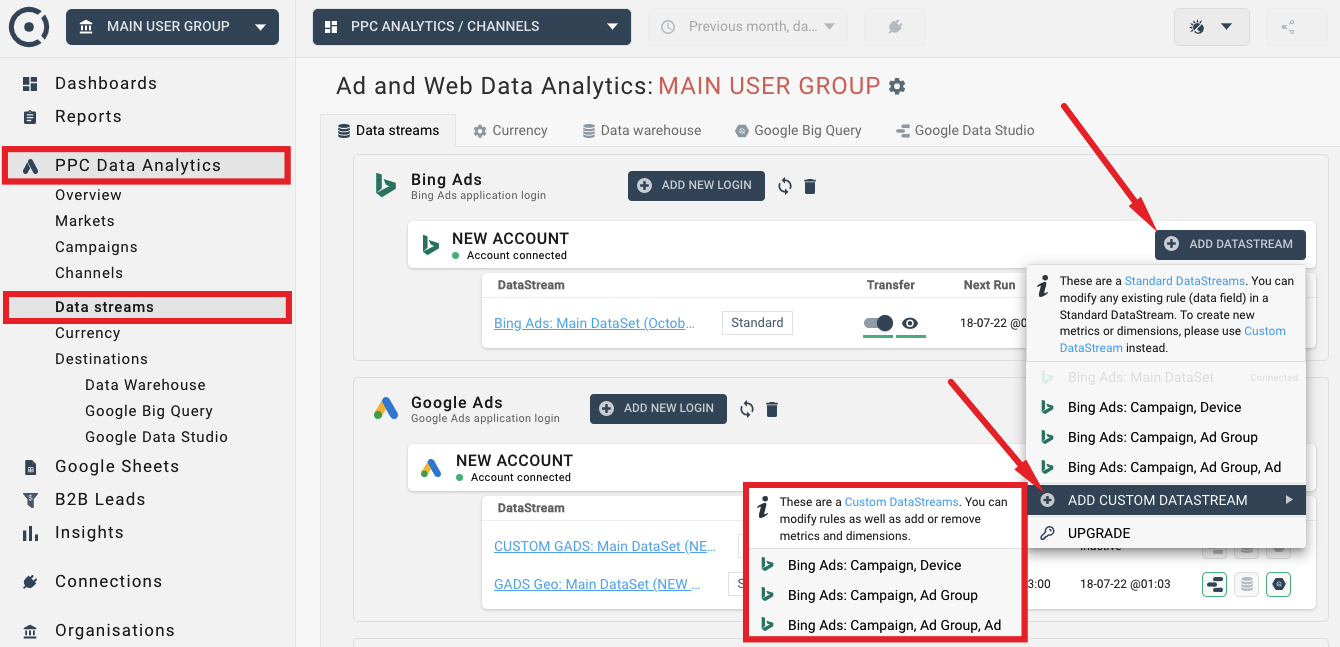
The following image shows how to add a Custom Data Stream to a Bing Ads connection. You always base the new stream on a pre-defined Data Set. Data Set is a group of compatible metrics and dimensions that you can change or extend once you create a new Stream.
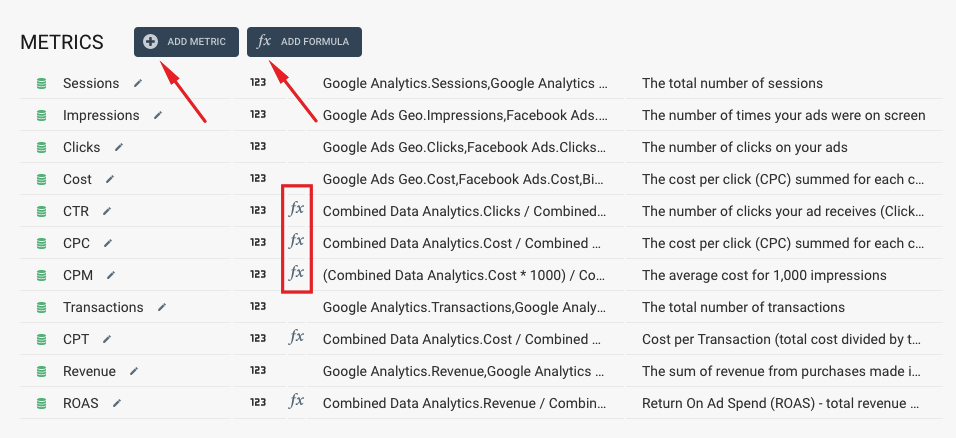
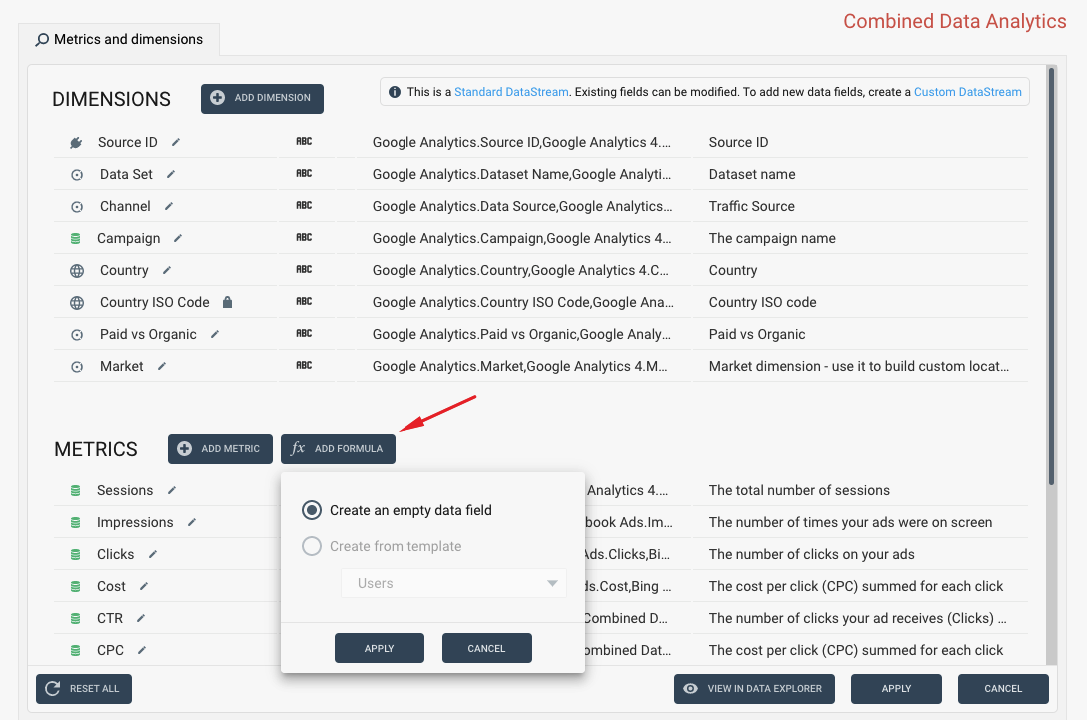
There are two types of metrics in Octoboard - Standard Metrics and Formulas. Formulas are marked with a formula icon and can be created using the ADD FORMULA button shown below:
- Standard metrics are calculated once at the time of data retrieval from connected cloud applications.
- Formulas are recalculated every time data is displayed.
You should use Formulas if your new metric uses division or if you can not add or average values during data aggregation (you cannot calculate an accurate CostPerClick value for your European market by averaging CPC values of European countries). Formulas are recalculated every time before data is displayed in widgets or tables.
In the list of metrics above, CTR, CPC, CPM, CPT and ROAS are all formulas because they all involve data division (CPC = Cost / Clicks) and because if you would like to calculate CostPerClick for five countries, for example, you cannot add up or average CPC values to get the total CPC. The image below illustrates this example.
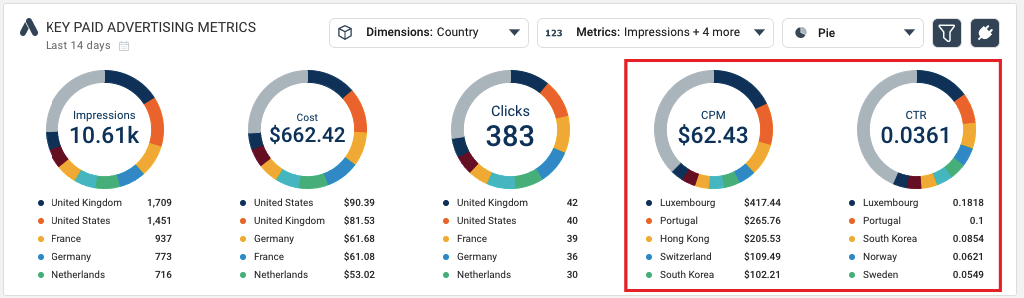
Here CPC and CTR for 5 countries cannot be calculated during data collection. Instead, Octoboard will collect Cost, Clicks and Impressions (they are Standard Metrics) and then use Formulas to recalculate accurate CPM and CTR every time it displays aggregated values in tables or data widgets.
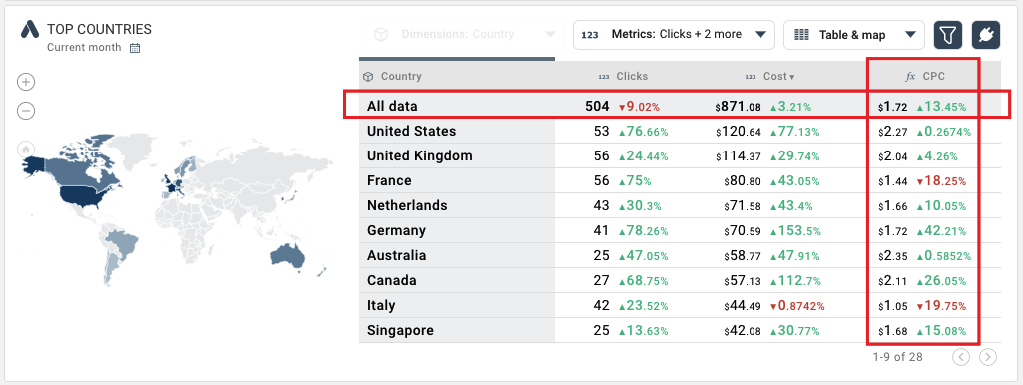
The Data Explorer widget above shows aggregated CPC formula value ($1.72). The CPC data field is not stored in the database. It is calculated when the Data Explorer is displayed. In our Data Warehouse database, there will be no CPC data field.
For more details on PPC Data Analytics export, please read this tutorial.
There is one more case that requires the use of Formulas. If you would like to create a metric in the Combined Data Stream based on an already existing metric of the stream, you should create a Formula. This case is covered in the next topic.
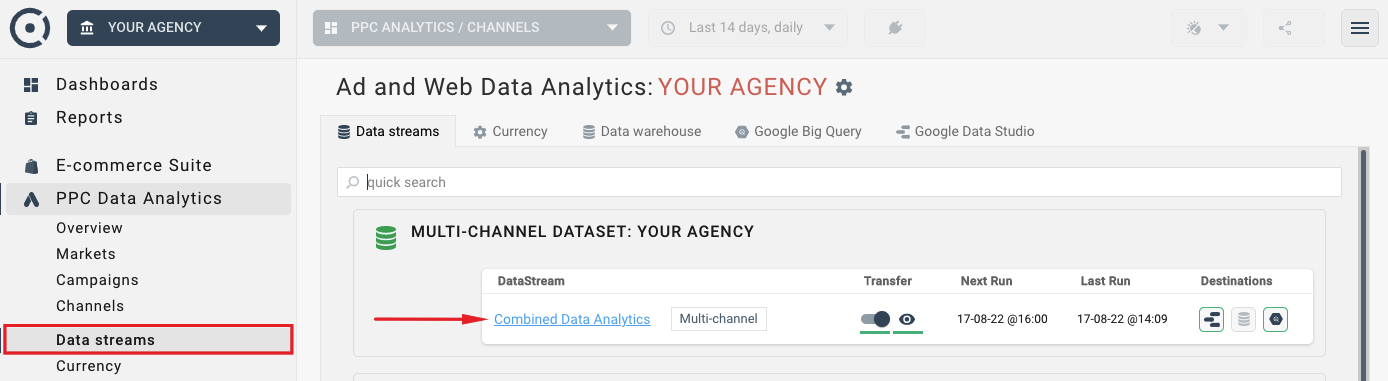
Let’s assume, your agency charges 10% of the paid advertising spend across all advertising channels, and you would like to display advertising cost that includes the markup. To do so, click on your Combined Multi-Channel data stream in Streams panel:
We do not want to modify an existing Cost metric and change the values that are received from the paid advertising platforms. Instead, we create a Formula based metric. Click the “ADD FORMULA” button:
Enter new metric name and click the ADD NEW RULE button:
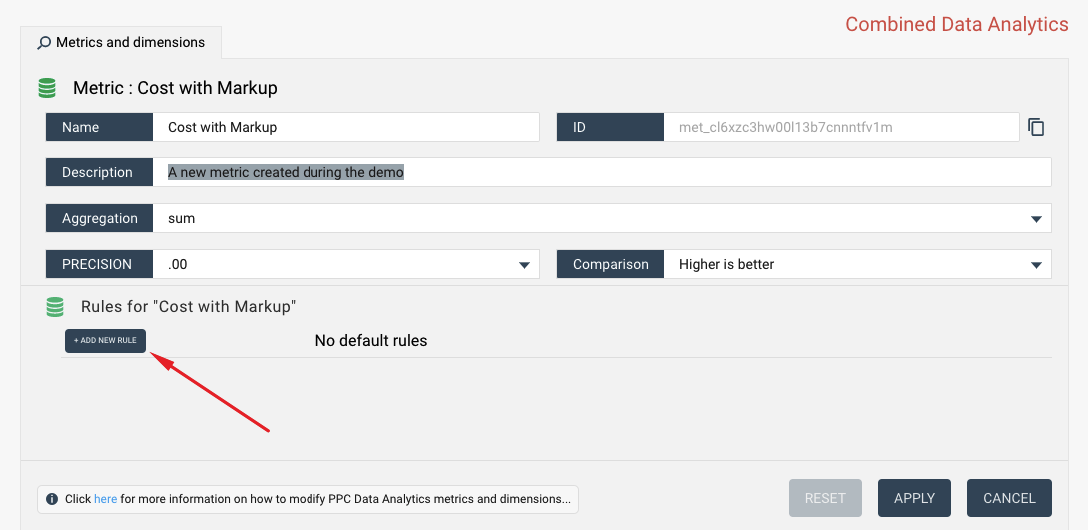
We then create a formula CostWithMarkup = Cost * 1.1 using the rule edit interface:

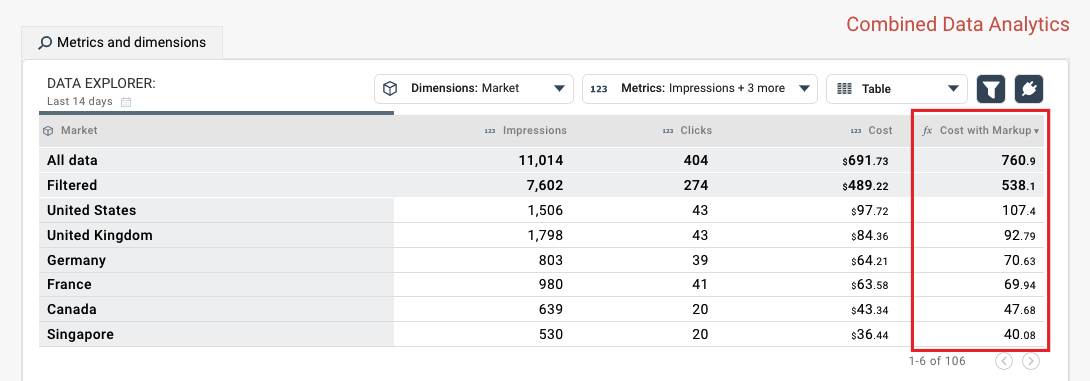
Click APPLY and preview the results of your changes in the Data Explorer widget. Note that the Cost with Markup metric now contains total cost across advertising platforms with 10% markup.
So far we have created a simple metric that uses data multiplication. Octoboard transformations offer more complex rules for building new metrics and dimensions that include calculations and IF-THEN cases. For a more advanced example, visit our tutorial that explains how to use conditional rules to calculate tax (VAT).