PPC Analytics Data Export Overview
Once you have connected paid advertising and Google Analytics data sources you can use Octoboard PPC Data Analytics add-on to send the data to Octoboard dashboards, reports and external BI systems. There is a number of ways to use the collected data that are described below.
Once you enable the PPC Data Analytics add-on, Octoboard will display a set of dashboards in the left panel. To view pre-defined data templates, simply click on any of the items under “PPC Data Analytics”.
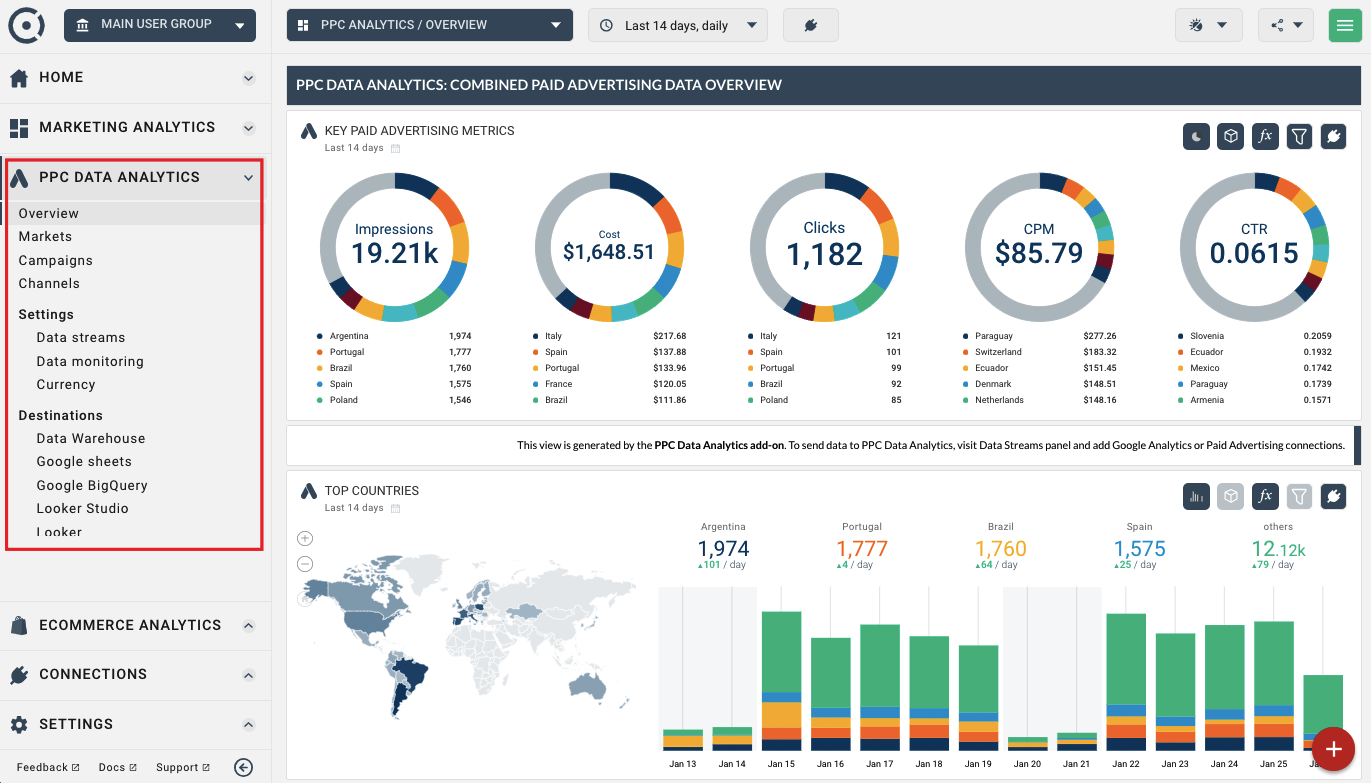
Analytics Data is not displayed immediately after you have enabled data collection. Wait a few moments for data to be collected and processed by Octoboard.
You can treat Data Explorer widget as any other data visualisation in Octoboard. You can add Data Explorer to any report or dashboard.
To add a Data Explorer widget to any dashboard or report, use the red button at the bottom-left of the dashboard or report in edit mode.
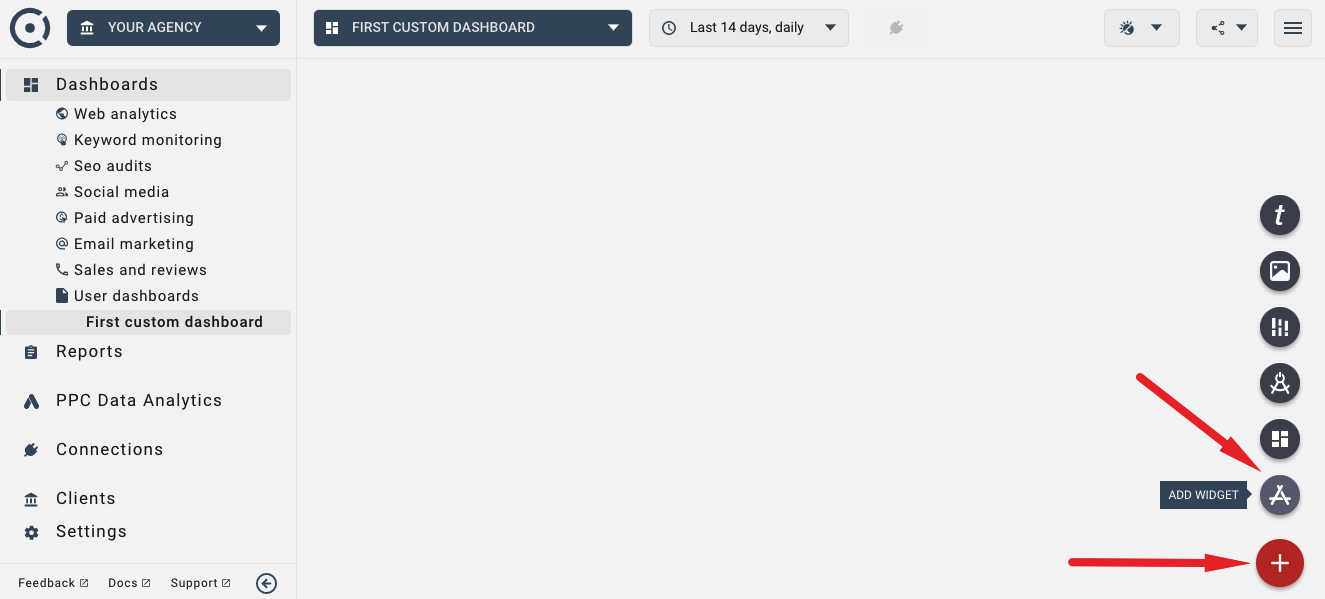
In the wizard, select the “Web+PPC Analytics” option and data explorer widget.
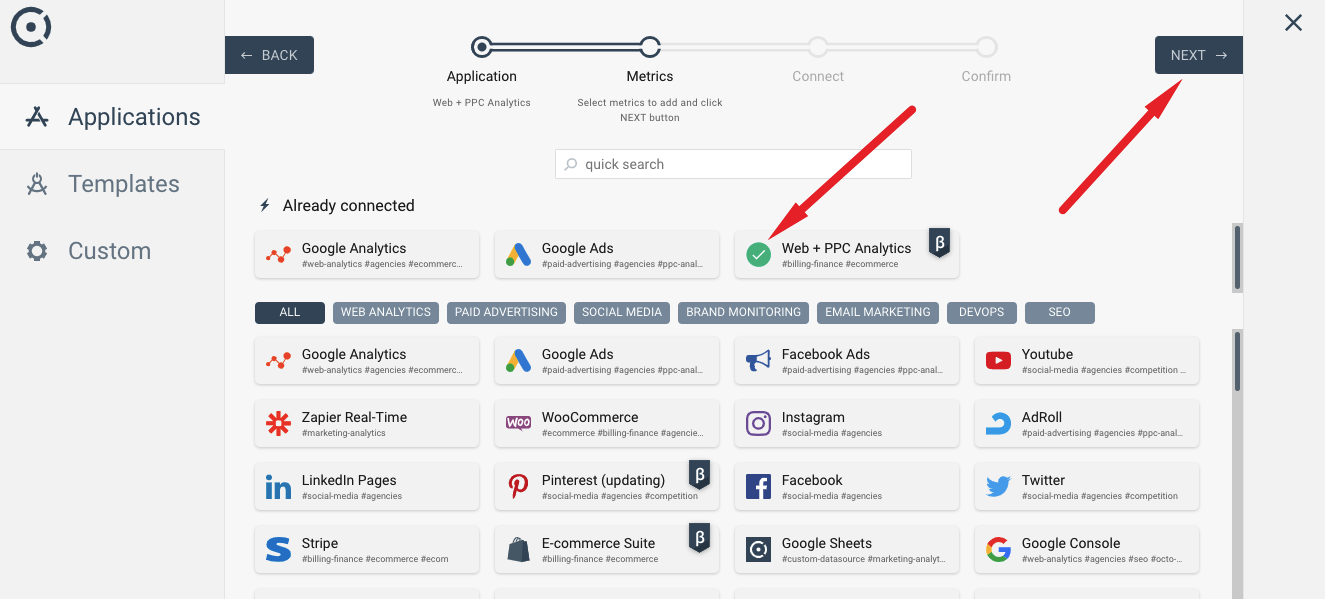
Once you complete the wizard, a new Data Explorer widget will be added to the current dashboard or report.
Data Explorer widgets will show the data for selected Streams. You can always add more data sources, select different streams or modify custom streams to add new metrics, formulas and custom dimensions. Use the CONNECT icon in the Data Explorer to switch the data view to a different stream or select a new data source:
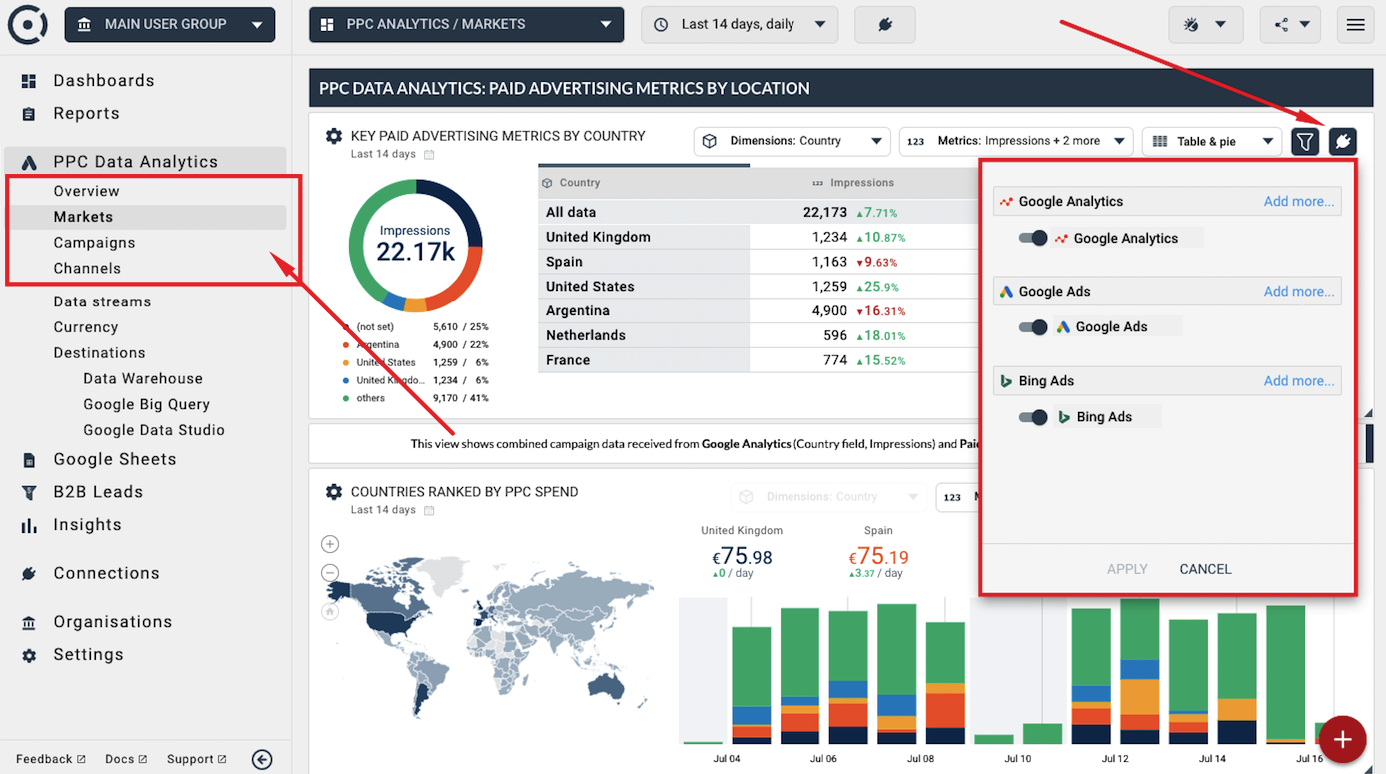
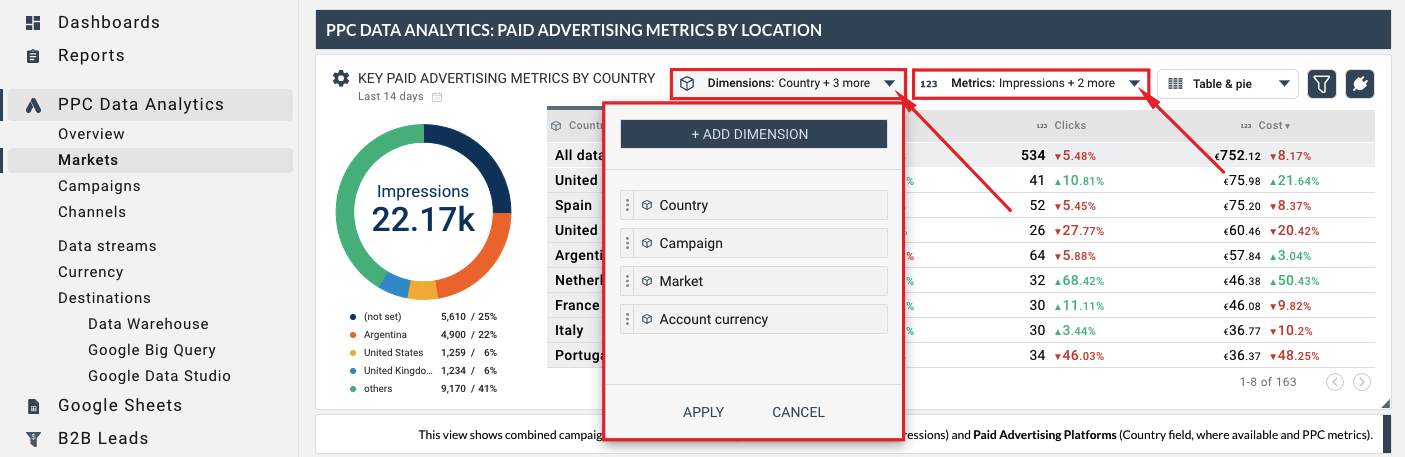
Select metrics and formulas that you want to see in the Data Explorer by using the drop-down controls in the header of the widget as shown in the image below:
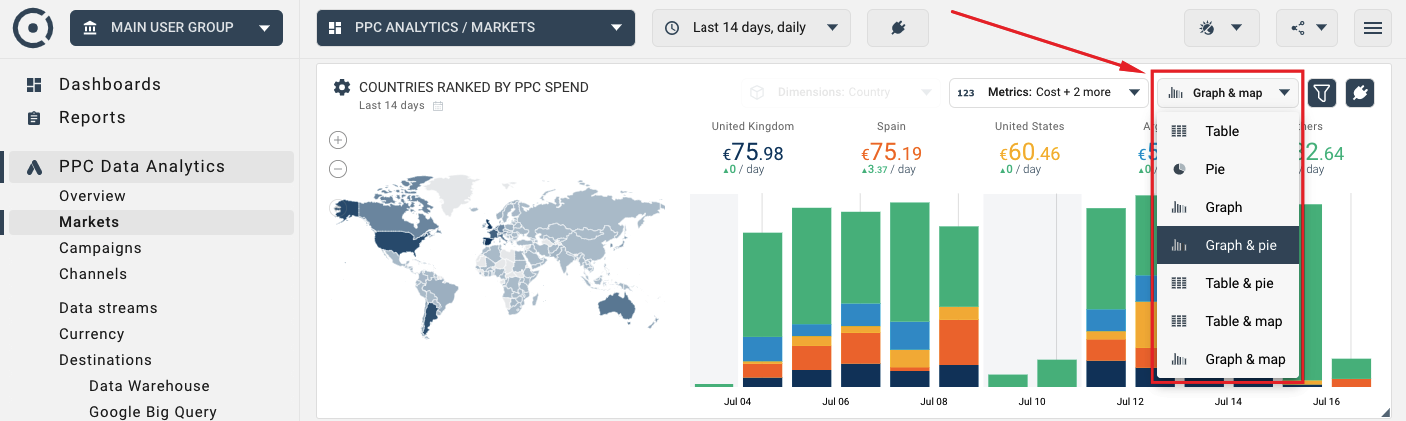
Data Explorers support combinations of graphs, pie charts and tables. If the selected data source contains a country dimension, the data explorer will allow you to display geographical maps.
You can use or modify pre-defined PPC Data Analytics templates as well as create new dashboards and reports using PPC Data Analytics widgets. As with any dashboard or report in Octoboard, you can always share data with your peers and clients by creating a white-label data portal or sending automated reports.
For more details on data sharing options in Octoboard, please read this tutorial.
For information on PPC Data Analytics visualisation options in Octoboard dashboards and reports please read this tutorial.
Any selected data source - Custom, Standard or Multi-Channel - can be viewed in Octoboard dashboards and reports or sent to an external data destination such as Google Data Studio or Google BigQuery. To access data export features use the left panel area:
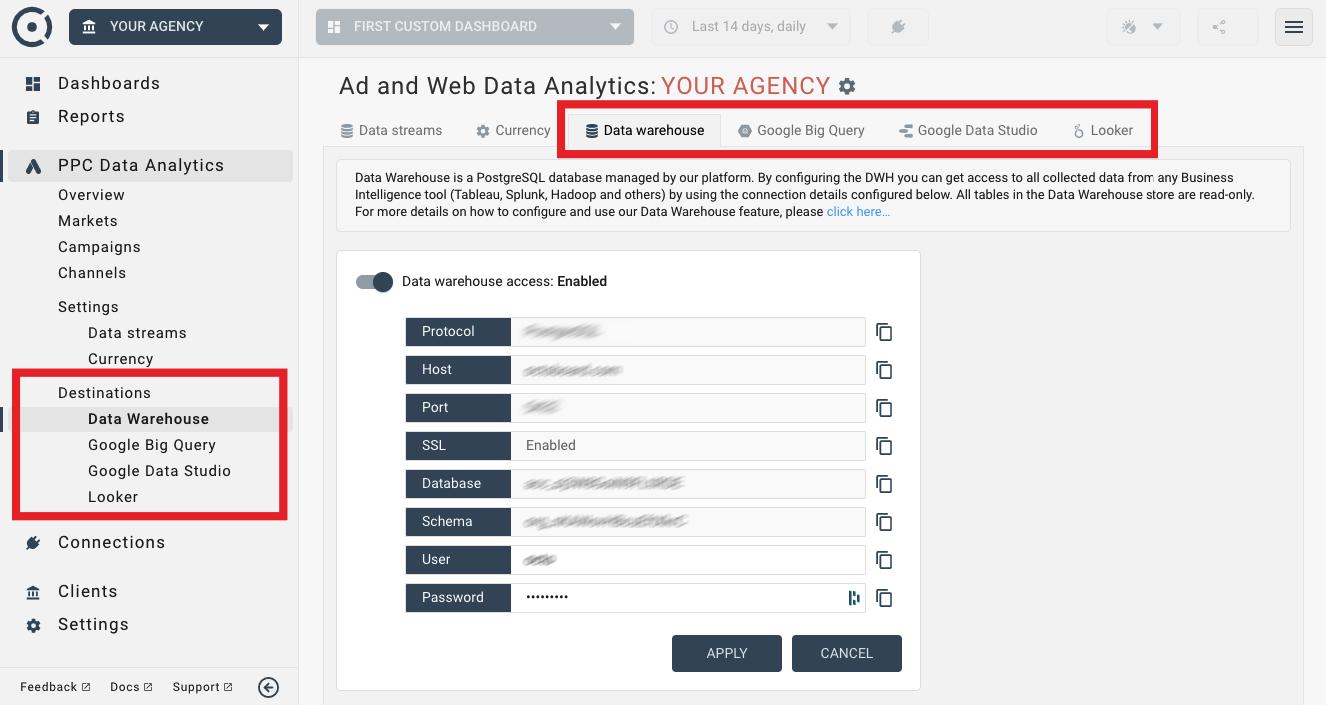
The following Knowledge Base topics cover export configurations for every currently available data destination: