How to add SQL widgets to dashboards
You can connect your Octoboard platform to popular SQL databases such as MySQL, Microsoft SQL Server, PostgreSQL, Oracle and Amazon Redshift.
You can run SELECT queries and display returned datasets in numeric widgets, historical graphs, pie charts and tables.
For example, if you select a single numeric value from a database (Apple stock price, for instance), Octoboard can build historical trends for you automatically by monitoring and storing value changes over time. You can also overlay values for the selected month, quarter or year to values from the previous period.
This tutorial explains how to create database widgets. Before you start, make sure you have created a connection to your database. To do so, please follow the simple procedure covered in the Knowledge Base post on How to create SQL Database connections.
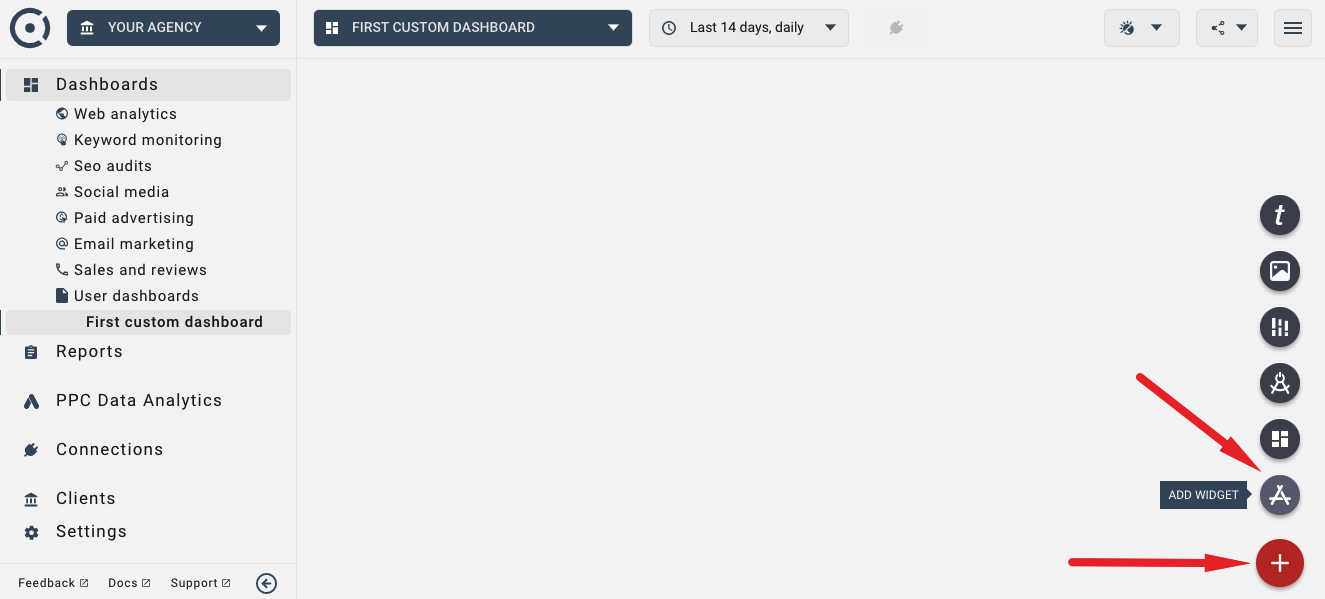
To add a numeric database widget, use the red button at the bottom-right of the screen and select ADD WIDGET. If you are adding widgets to a report, make sure you enter EDIT REPORT mode first.
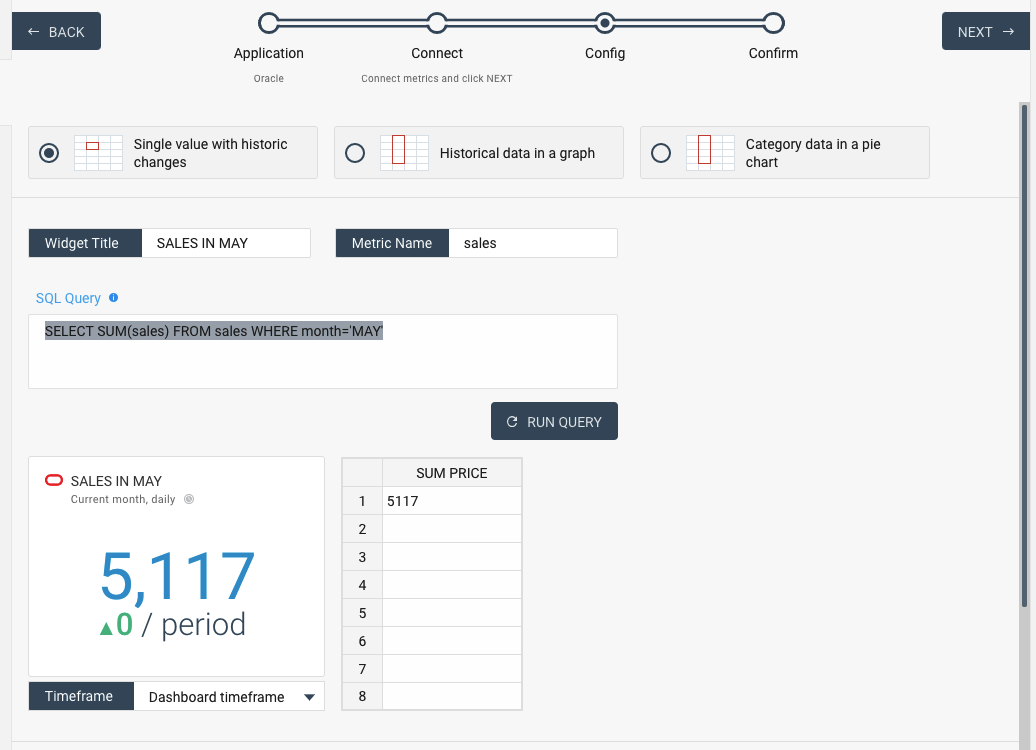
Once you click ADD WIDGET, you will be brought to the standard connection wizard. On the first page of the wizard, select the database you would like to connect to. Scroll down to locate your database of choice. Select it and click NEXT. Once you create a database connection you will be asked to configure an SQL statement.
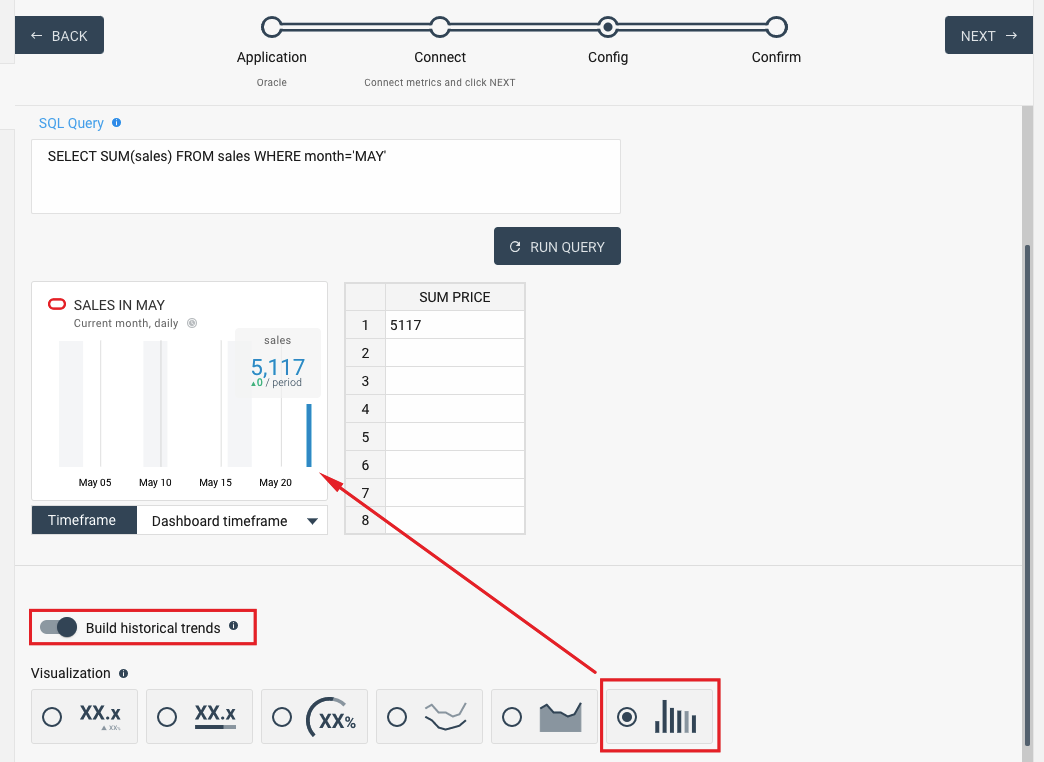
Numeric widgets require a single numeric value to be returned by your SQL query. If your statement does not conform to numeric widget input requirements, Octoboard will display an error message. In this example, the SQL statement returns the total of sales in May:
SELECT SUM(sales) FROM sales WHERE month='MAY'
You can enable "Build historical trends" switch. If it is set to ON, Octoboard will run SQL queries at regular intervals and will save value changes over time. With this option it is also possible to change visualization of the widget to historical chart or graph as shown on the following image:
Click NEXT in the connection wizard to place the new widget to current dashboard or report section.
You can always modify the widget settings by using QUICK SWITCH menu item or PARAMETERS menu item in the top-left corner of your new database widget. The process of changing configuration options and database connections of existing SQL database widgets is covered at the end of this tutorial.
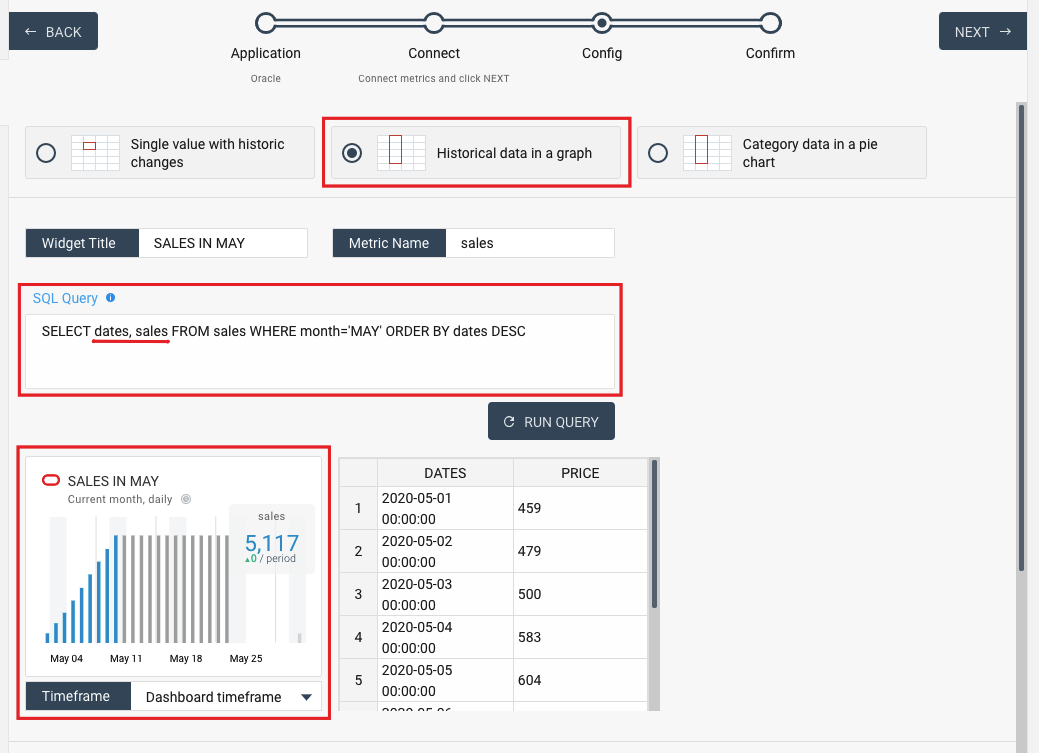
To display a historical graph, you will need to run an SQL query that returns two columns. First column should be of type DATE and second column should be NUMERIC. We recommend using ORDER BY and DESC statements to make sure you see the latest historical data. Here an example of the query that returns sales figures for May:
SELECT dates, sales FROM sales WHERE month='MAY' ORDER BY dates DESC
To add a graph that displays sales numbers, use the Wizard (press big red button at the bottom right of the screen and select ADD WIDGET to follow the connection wizard steps). Locate Oracle DB integration and select "Historical data in a graph" option.
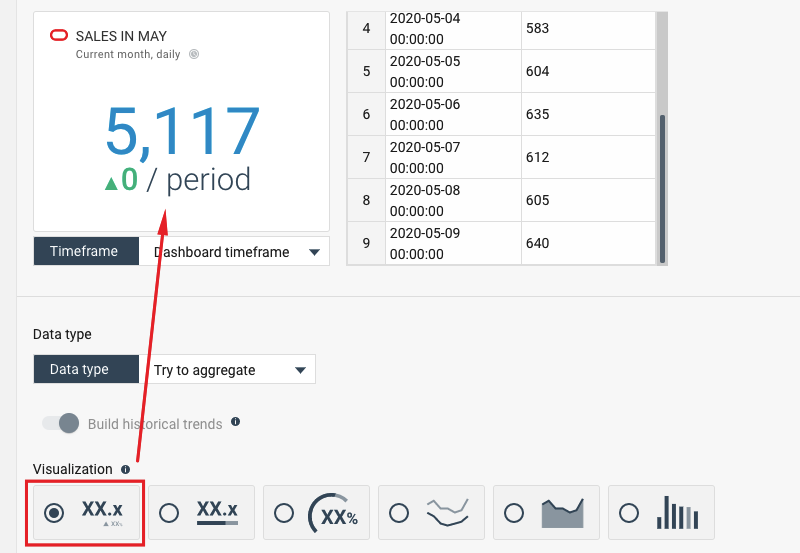
You can change the widget visualization type by selecting a different type at the bottom of this configuration panel:
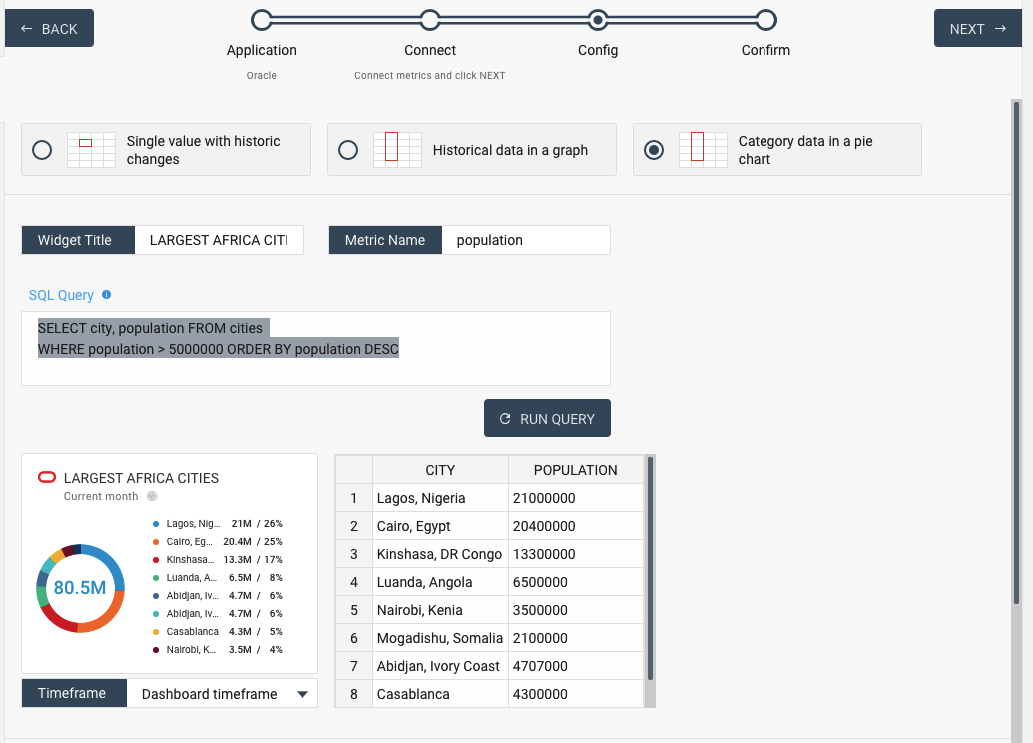
To create Category (pie chart) database widgets, use the same ADD WIDGET button to access the connection Wizard. When asked to enter an SQL statement, make sure you create a query that returns two columns. The first column should contain category names, the second column should contain numeric values. In this example, the statement returns names and population of the largest African cities:
SELECT city, population FROM cities WHERE population > 50000 ORDER BY population DESC
You can always modify settings of an existing DB widget. It is possible to change visualization parameters as well as change SQL Database connection settings and output data formats.
To do so, click the top-left corner of your widget and select QUICK SWITCH or PARAMETERS menu item.
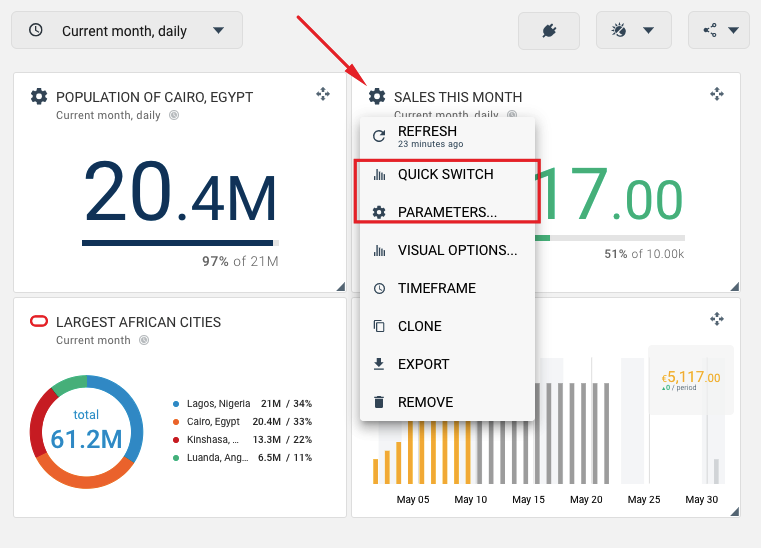
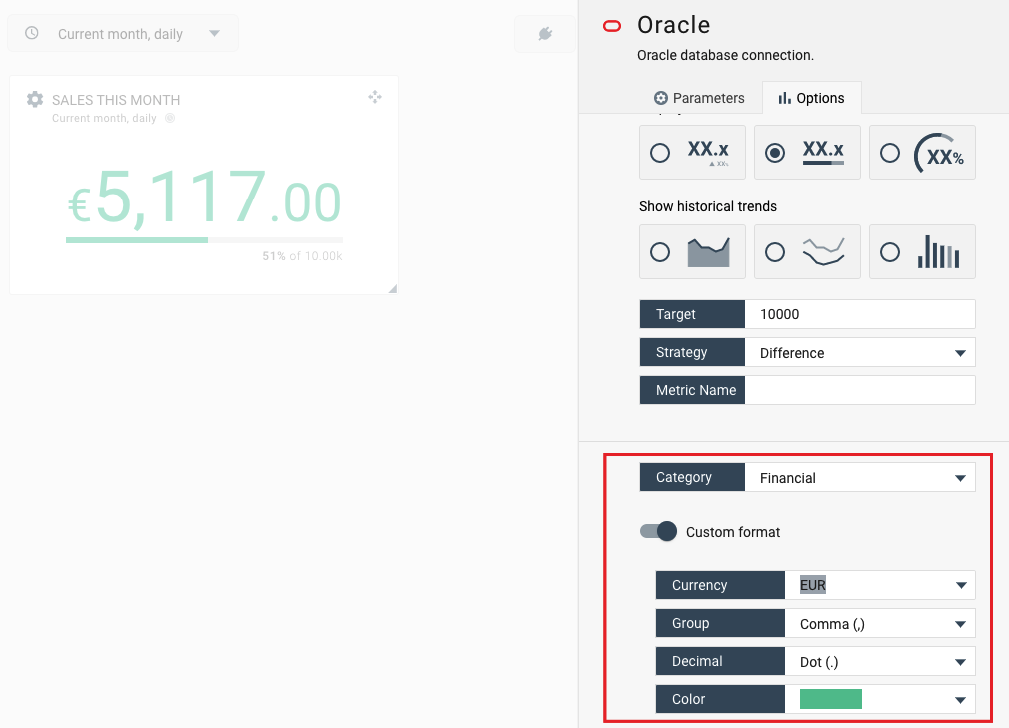
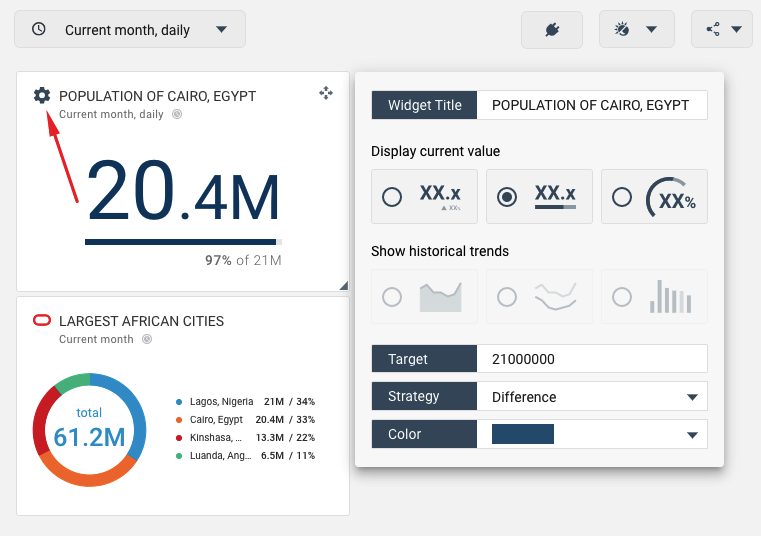
This is what the QUICK SWITCH configuration parameters look like. You can change widget visualization type and colour here.
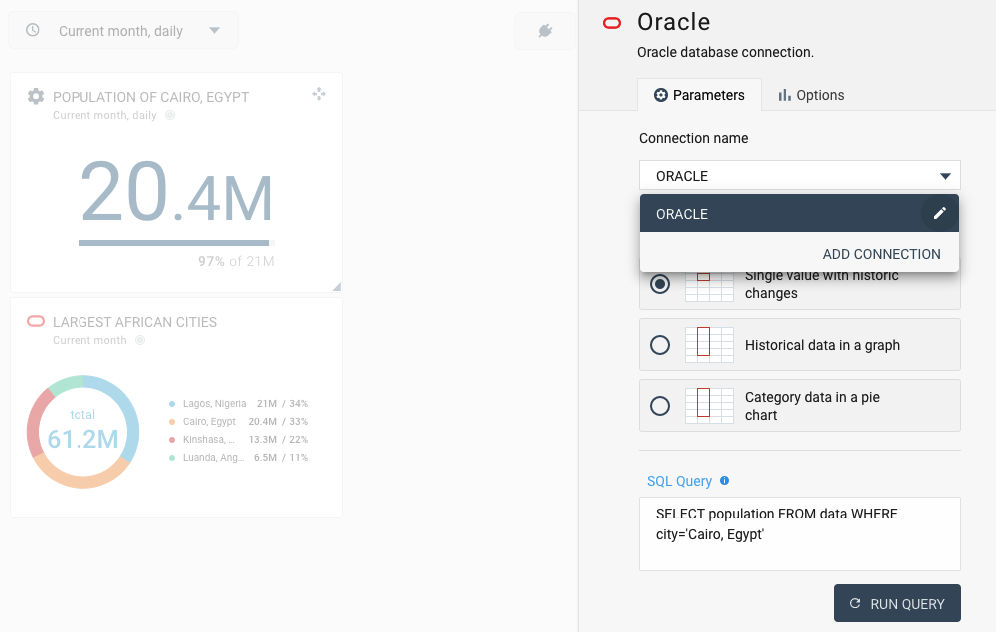
If you select PARAMETERS menu item, you will access the following configuration panel. You can change database connection settings, SQL query and data aggregation parameters.
Use "Options" tab of the configuration panel shown below to access widget visualization parameters and apply data formatting rules by using "Custom format" switch. You can, for example, change currency symbol in the "Custom format" tab.