Automated Facebook Social Media Reporting Tool for Marketing Teams and Clients
Build automated social media reports for your marketing teams and clients using Facebook data.

FACEBOOK REPORTING
Social Media analytics for Facebook - user engagement and trends within one online dashboard.
Data is often considered the lifeblood of a business. For online companies and marketing teams, analyzing Facebook data becomes imperative to understand the market, audience behavior, and to make informed decisions. With a plethora of data metrics available, especially on platforms like Facebook, the challenge becomes not just collection, but effective interpretation and representation. Enter the era of automation with platforms like Octoboard, designed to simplify and optimize data reporting.
- The Need for Software Platforms and SaaS Products
Traditional methods of Facebook data collection and analysis are time-consuming, prone to human error, and often do not present the holistic view required for strategic decision-making. Software platforms and SaaS (Software-as-a-Service) products streamline this process. They provide:
Efficiency: Automated data retrieval and representation speeds up the process, freeing up time for interpretation and strategy development.
Accuracy: Eliminate human errors associated with manual entry and calculations.
Real-time Analysis: Most online businesses operate 24/7, and so does their data. Real-time analytics provided by these platforms ensure you're always updated.
Customization: Tailor your reports based on what metrics matter most to your business, ensuring relevance and focus.
- The Power of Automating Facebook Reporting with Octoboard
Facebook, being a prime platform for businesses to engage with their audience, provides a wealth of data. Octoboard stands out by automating the generation and representation of these essential metrics:
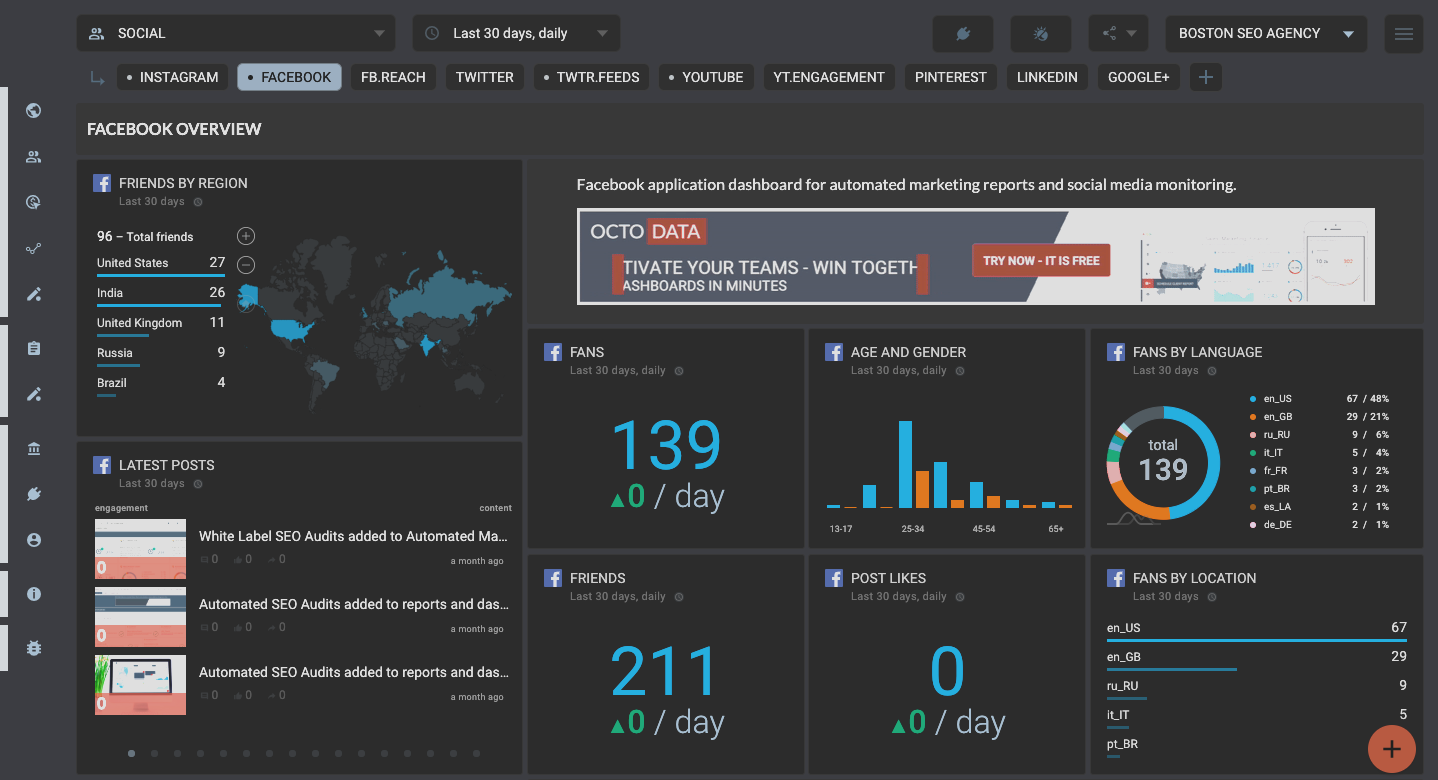
- FACEBOOK LATEST POSTS & TOP POSTS
Understanding what content garners attention helps shape future content strategies. These metrics give insights into what's current and what's working.
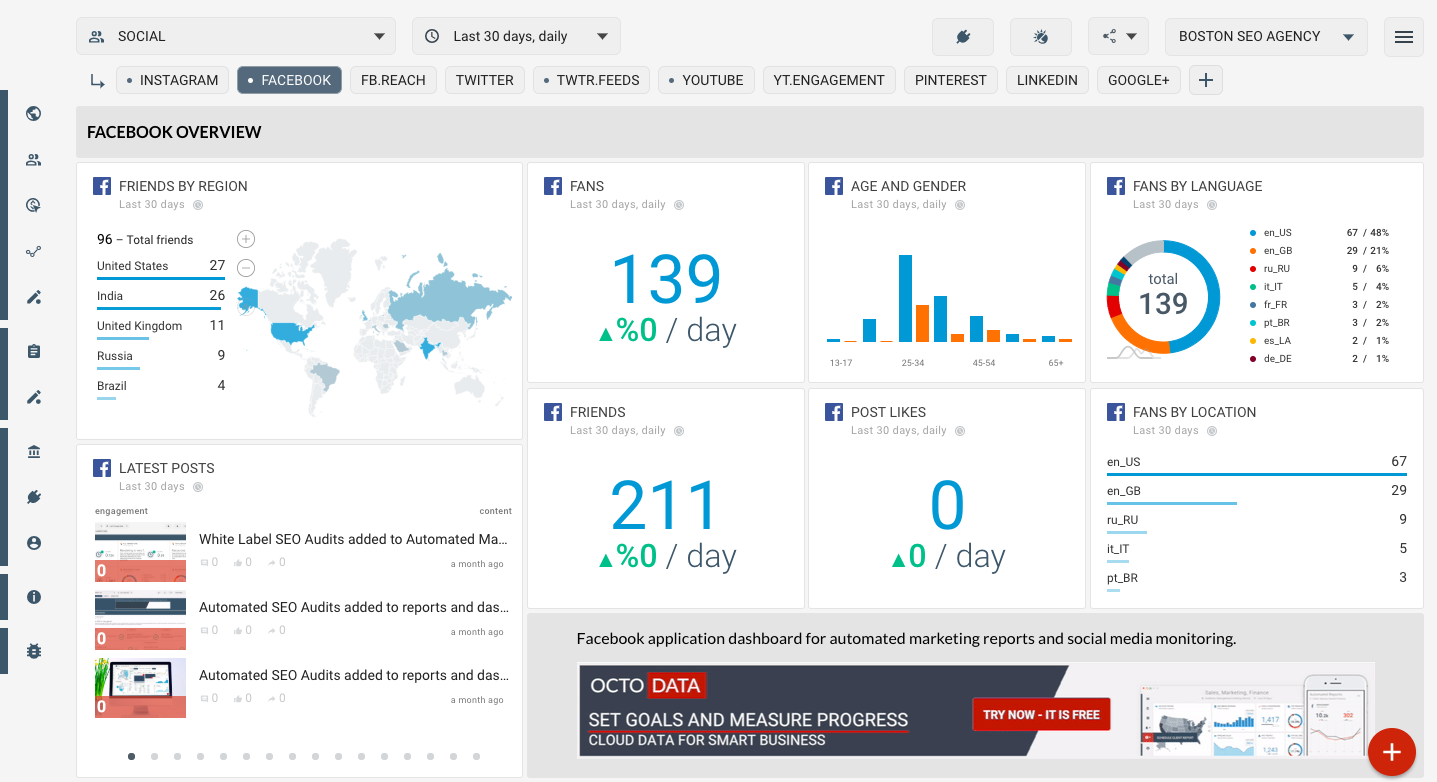
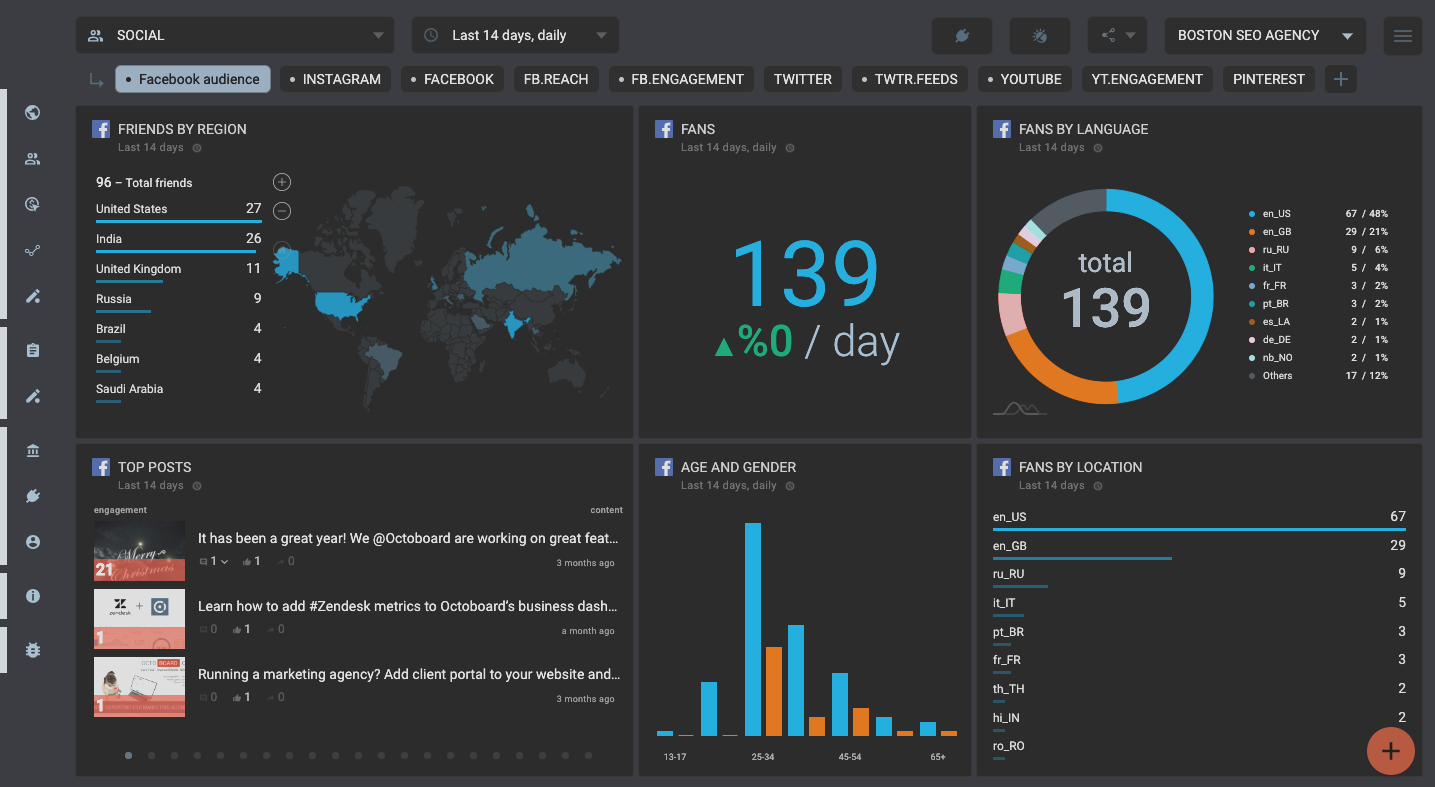
- FACEBOOK AUDIENCE Metrics
From PAGE FANS BY REGION to FANS BY LANGUAGE, understanding your audience's demographics and preferences is the foundation of targeted marketing. Octoboard's automation ensures these metrics are always updated and at your fingertips.
- FACEBOOK IMPRESSIONS, REACH, and REFERRERS
These metrics are vital to gauge the visibility and reach of your content. Whether organic or paid, knowing how far your content travels and from where traffic originates helps in optimizing ad spends and content placement.
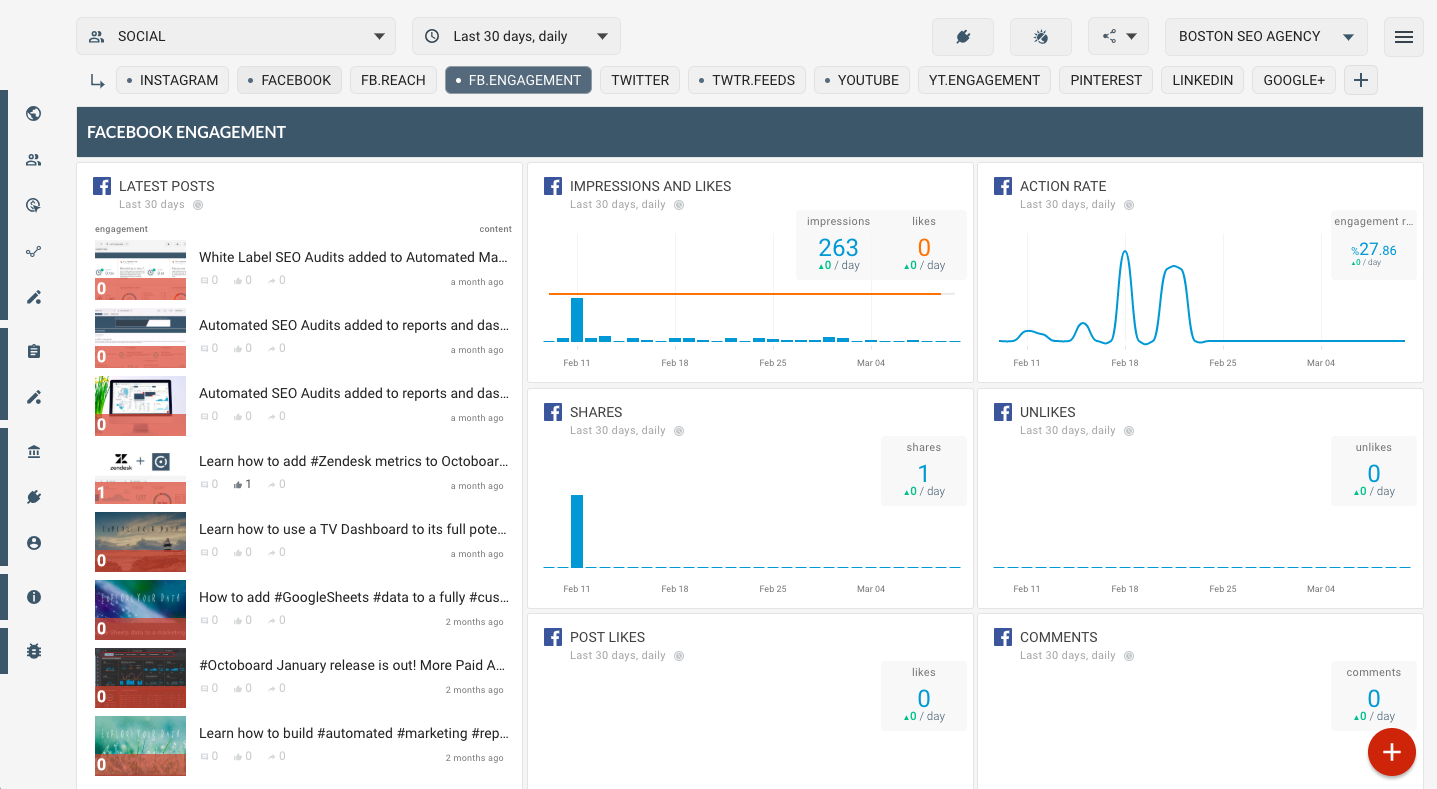
- FACEBOOK ENGAGEMENT Metrics - LIKES, CLICKS, and ACTIONS
Engagement indicates audience interest and interaction. Metrics like COMMENTS, SHARES, and POSITIVE FEEDBACK TRENDS provide a clear picture of how your audience perceives your content. Higher engagement often translates to higher conversions.
- NEGATIVE ACTIONS and UNLIKES
It's not just the positive metrics that matter. Understanding what deters your audience helps in rectifying mistakes and avoiding them in future campaigns.
- STORIES and STORY IMPRESSIONS
With the growing popularity of 'Stories' on various social platforms, measuring their impact is crucial. Story impressions give insights into how many times your story was viewed, assisting in understanding its effectiveness.
- Your Facebook posts popularity and user feedback
- Audience insights (age, gender, location)
- Content reach
- Traffic sources
- Facebook ads efficiency
- Engagement
- Negative feedback
Automated data reports enabled by Octoboard software
Facebook Overview
Facebook Audience

Facebook Reach

Facebook Social Media dashboard - Overview
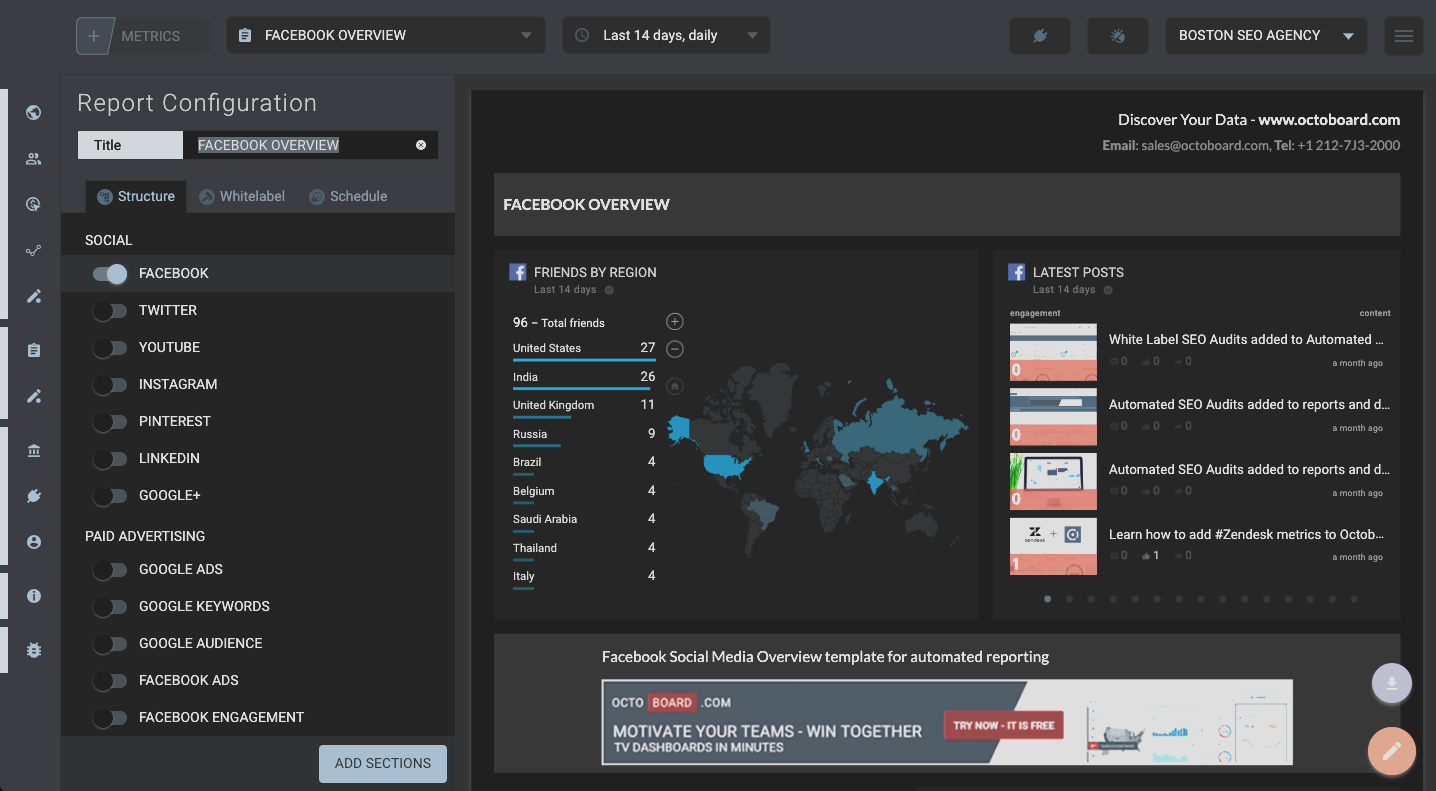
Facebook Social Media Report template (Report)
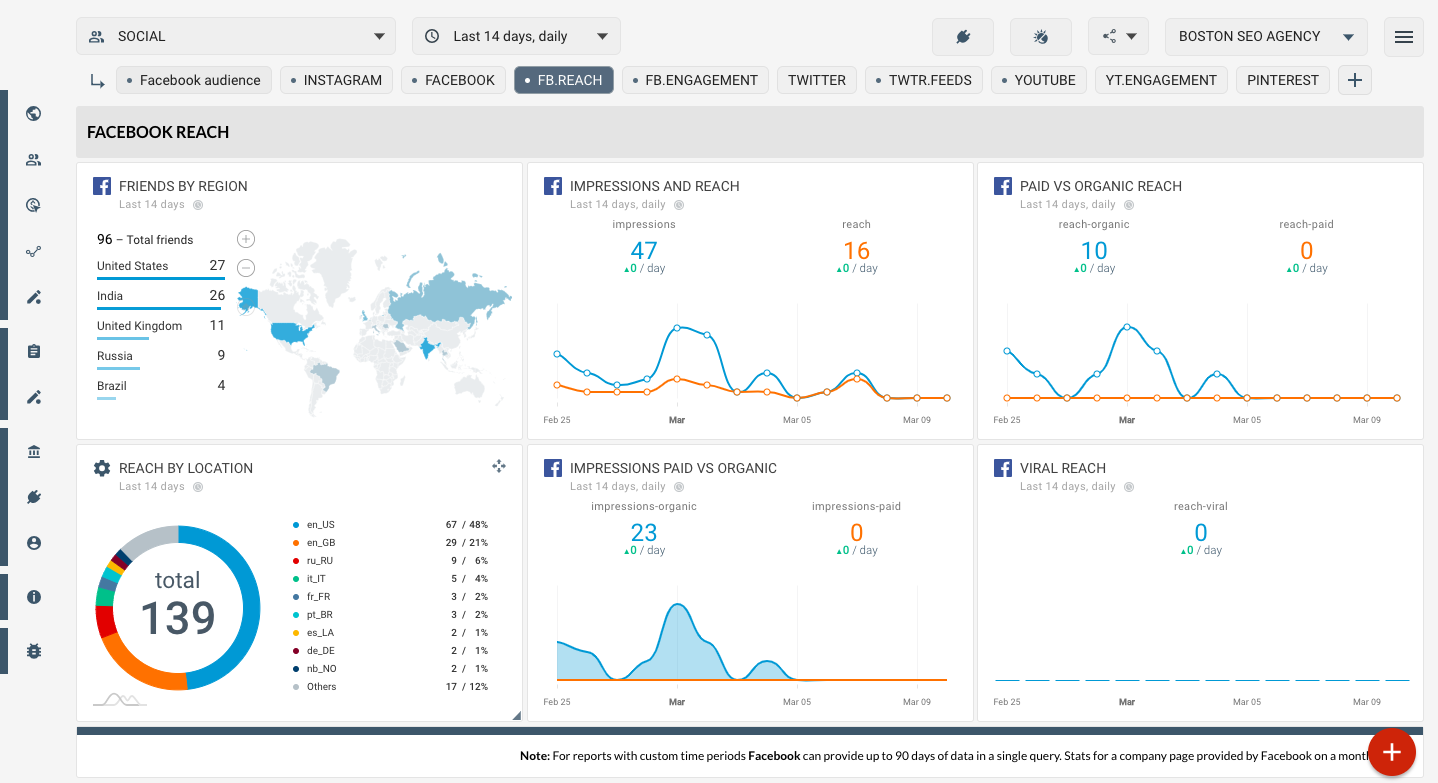
Facebook Social Media template - Reach

Facebook Social media template - Audience metrics