Facebook Social Media Report Template: Automating and Enhancing Facebook Metrics Analysis | Octoboard
Looking for a Facebook Social Media Report template? This blog post explores how automated reporting tools like Octoboard can enhance the efficiency of your social media strategies.

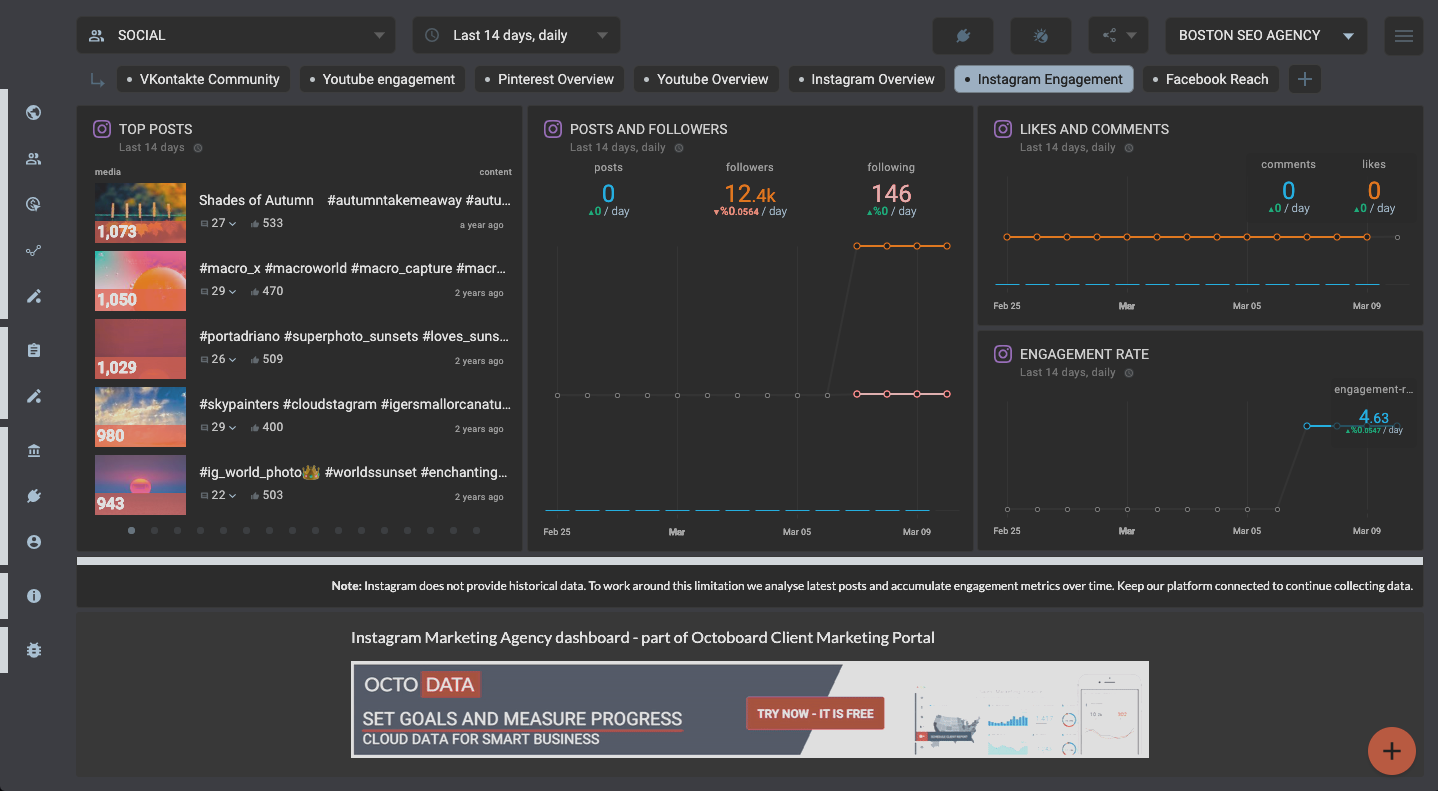
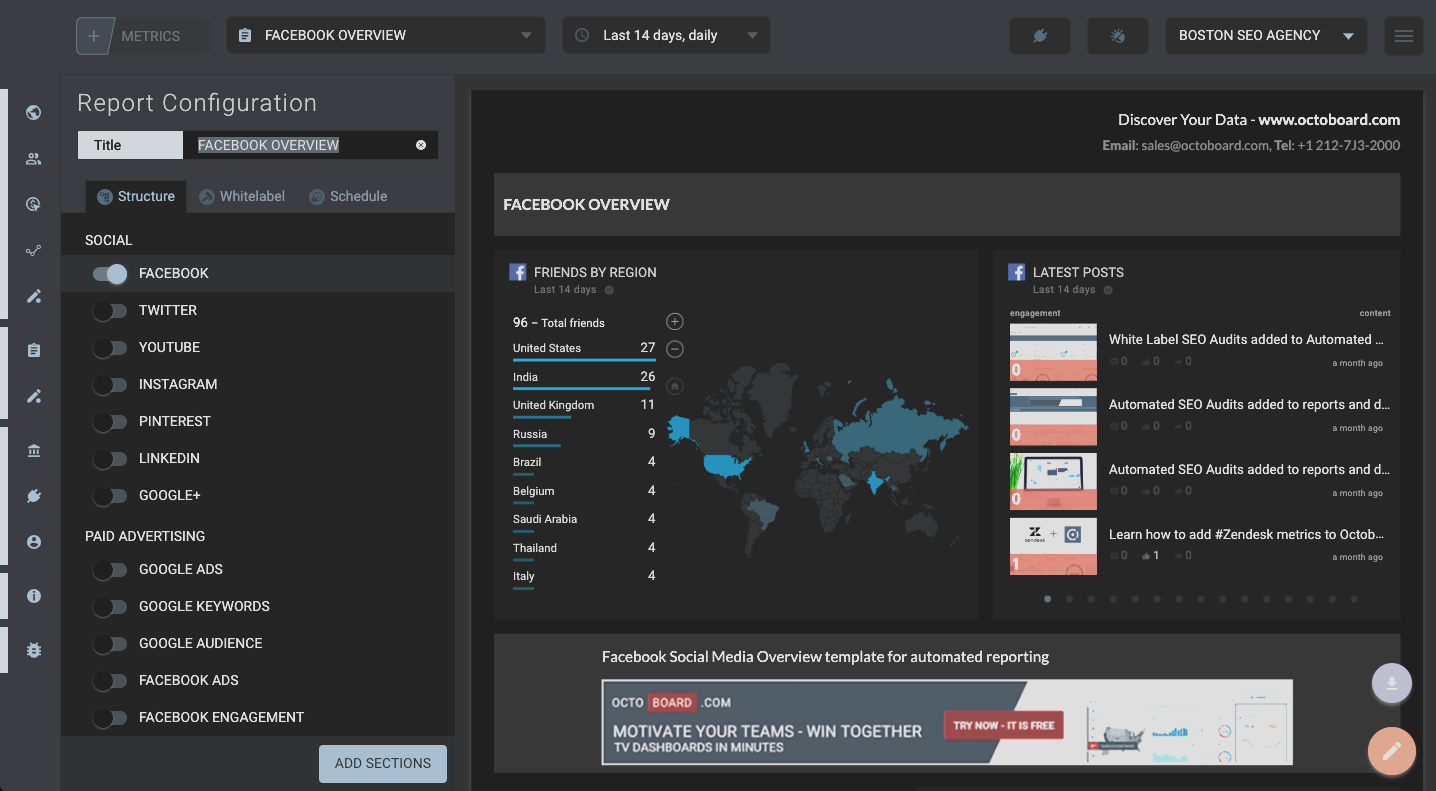
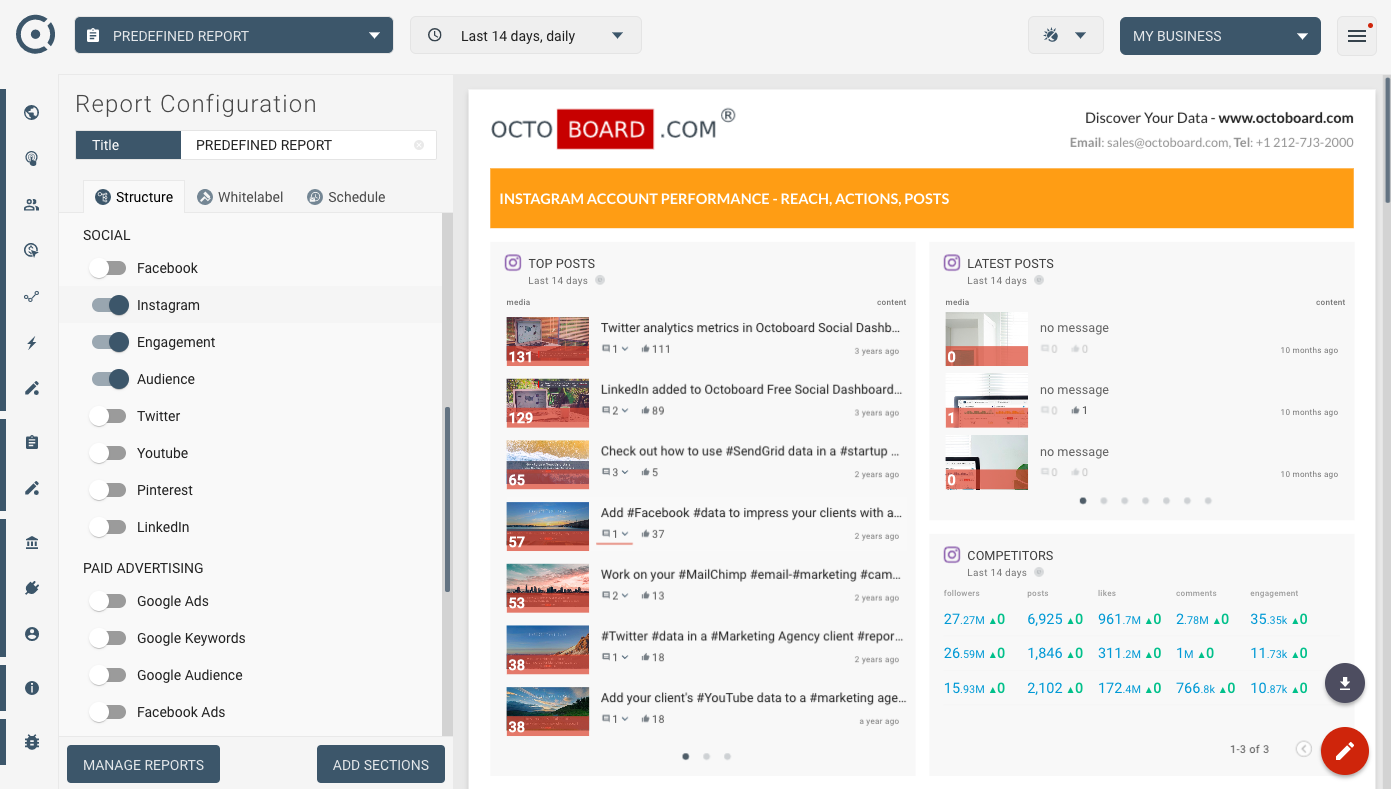
FACEBOOK SOCIAL MEDIA REPORT TEMPLATE (REPORT)
Key Facebook Social metrics for Marketing Agency clients
Automated Social Media Report: Facebook Metrics Overview
In the ever-evolving digital landscape, social media platforms have become crucial for businesses to connect with their audience, build brand awareness, and drive engagement. Among these platforms, Facebook stands out due to its vast user base and comprehensive analytics. Understanding the importance of social media data analytics is pivotal for marketing teams aiming to showcase their efforts effectively. This blog post delves into how leveraging Facebook data through automated reporting tools like the Octoboard Marketing Analytics platform can significantly enhance the efficiency and effectiveness of social media strategies.
Understanding Key Facebook Metrics
Facebook offers a plethora of metrics that can provide deep insights into the performance of your content and engagement with your audience. Here’s a breakdown of the critical metrics mentioned in our report:
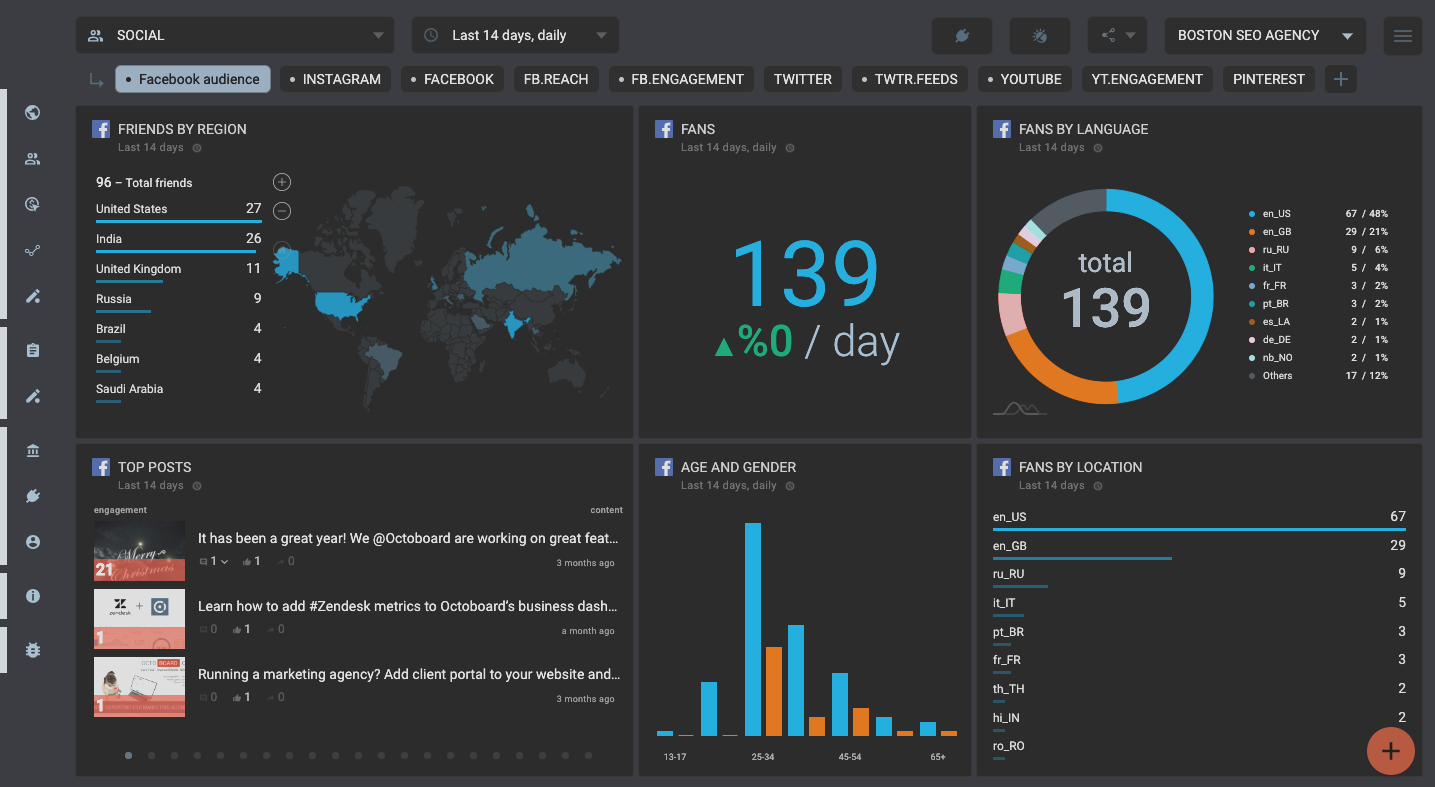
- :Facebook Overview: Provides a snapshot of your overall performance on the platform, including engagement rates, reach, and activity.
- :Facebook Fans by Country Map: Visual representation of your global audience, allowing you to tailor your content to specific demographic segments.
- :Facebook Impressions Likes: Tracks how many times your content has been viewed and liked, indicating its reach and popularity.
- :Facebook Pages Likes Daily: Monitors daily fluctuations in page likes, helping you gauge the effectiveness of your content and campaigns.
- :Facebook Shares: Measures the virality of your content by counting how many times it has been shared, extending your reach beyond your immediate followers.
- :Facebook Engagement Rate: Calculates the level of interaction (likes, shares, comments) with your content relative to your number of followers, a key indicator of your content’s resonance with your audience.
- :Facebook Comments: Offers qualitative feedback from your audience and quantifies the number of interactions, providing insights into audience sentiment.
The Importance of Automating Social Media Reports
In a digital era where time is of the essence, automating social media reports through platforms like Octoboard can save marketing teams hundreds of hours. Automation ensures that reports are generated and sent out monthly or weekly to teams or management, providing consistent visibility of social media efforts. This regular insight allows teams to:
- :Adapt strategies in real time based on performance metrics.
- :Demonstrate ROI on social media marketing to stakeholders.
- :Identify and capitalize on emerging trends to stay ahead of the competition.
Automated reports also play a crucial role in content creation for higher ranking on Google Analytics 4 (GA4), enabling teams to monitor their social media progress efficiently and align their strategies with SEO best practices to enhance online visibility.
Consolidating Social Media Reporting
The Octoboard Analytics platform centralizes social media reporting, bringing together various metrics from different platforms into one comprehensive dashboard. This consolidation is vital for several reasons:
- :It provides a holistic view of social media performance across platforms.
- :It saves time by eliminating the need to manually compile reports from multiple sources.
- :It allows for more accurate and cross-comparable analysis of social media strategies and their outcomes.
Advanced PPC Analytics Module
For marketing agencies, the ability to build new metrics, dimensions, and use advanced formulas to transform PPC data is invaluable. Octoboard’s advanced PPC Analytics module facilitates the creation of sophisticated reports across PPC channels, locations, and currencies. This feature is particularly beneficial for agencies managing campaigns for clients in diverse markets, enabling them to deliver tailored insights and strategies. For more information, visit Octoboard PPC Analytics module.
Automating Data Detection of Trends with ChatGPT/OpenAI
Staying atop marketing progress is critical, and automating the detection of trends using Facebook metrics can significantly aid in this endeavor. The Octoboard platform utilizes the ChatGPT engine to analyze data trends and generate insights, helping marketing teams and agencies monitor their social media activities effectively. This capability ensures that strategies remain aligned with the latest market dynamics and audience preferences, thereby optimizing marketing efforts. For more details, explore the Octoboard Generated ChatGPT/OpenAI feature.
Google Sheets Data Export Feature
The integration of social media data with Google Sheets via Octoboard’s data export feature offers marketing teams a flexible and accessible means to analyze and share data. This functionality allows for the customization of data analysis and the ability to combine Facebook data with other data sources, enhancing the depth and breadth of insights available. This feature is especially useful for teams that rely on collaborative tools for their data management and reporting processes. To learn more, visit the Octoboard Google Sheets add-on feature.
In the digital age, the ability to quickly adapt and optimize social media strategies based on data-driven insights is a competitive advantage. The Octoboard Marketing Analytics platform, with its comprehensive suite of tools for automating and enhancing social media reporting, offers marketing teams and agencies a robust solution to harness the power of Facebook metrics. By leveraging these tools, professionals can save time, gain deeper insights into their social media performance, and drive more effective engagement and growth strategies.
Octoboard customers who created this report also used the following data templates:
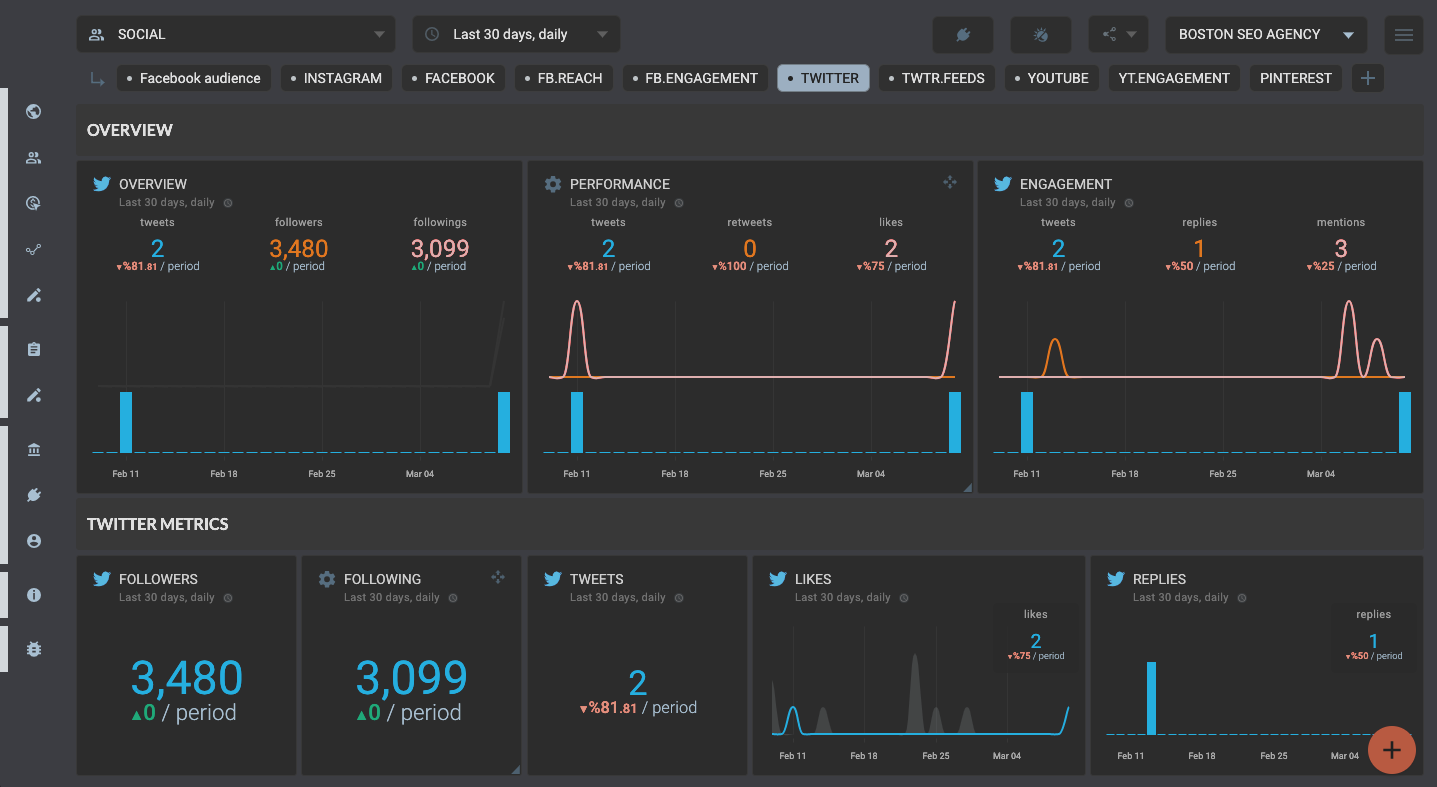
Twitter Metrics
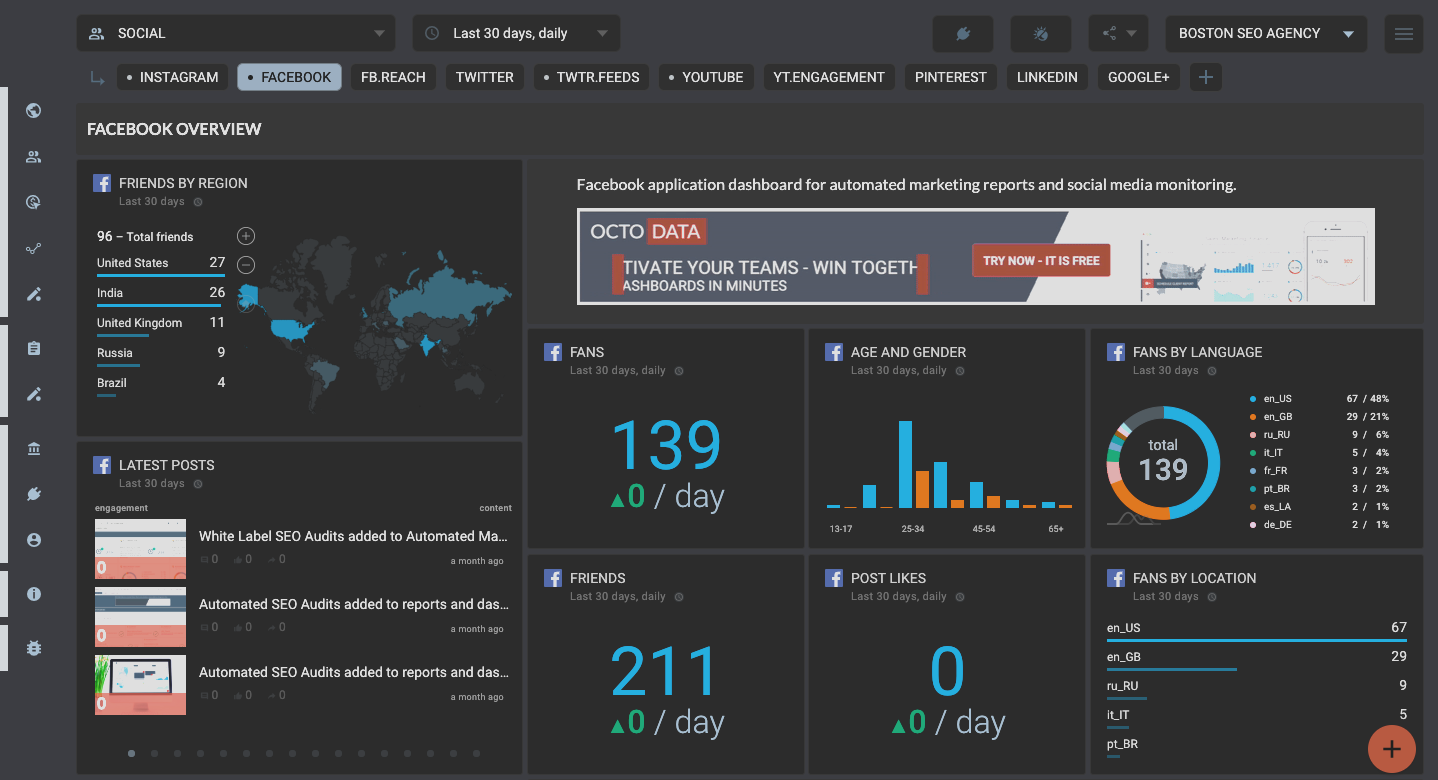
Facebook Overview
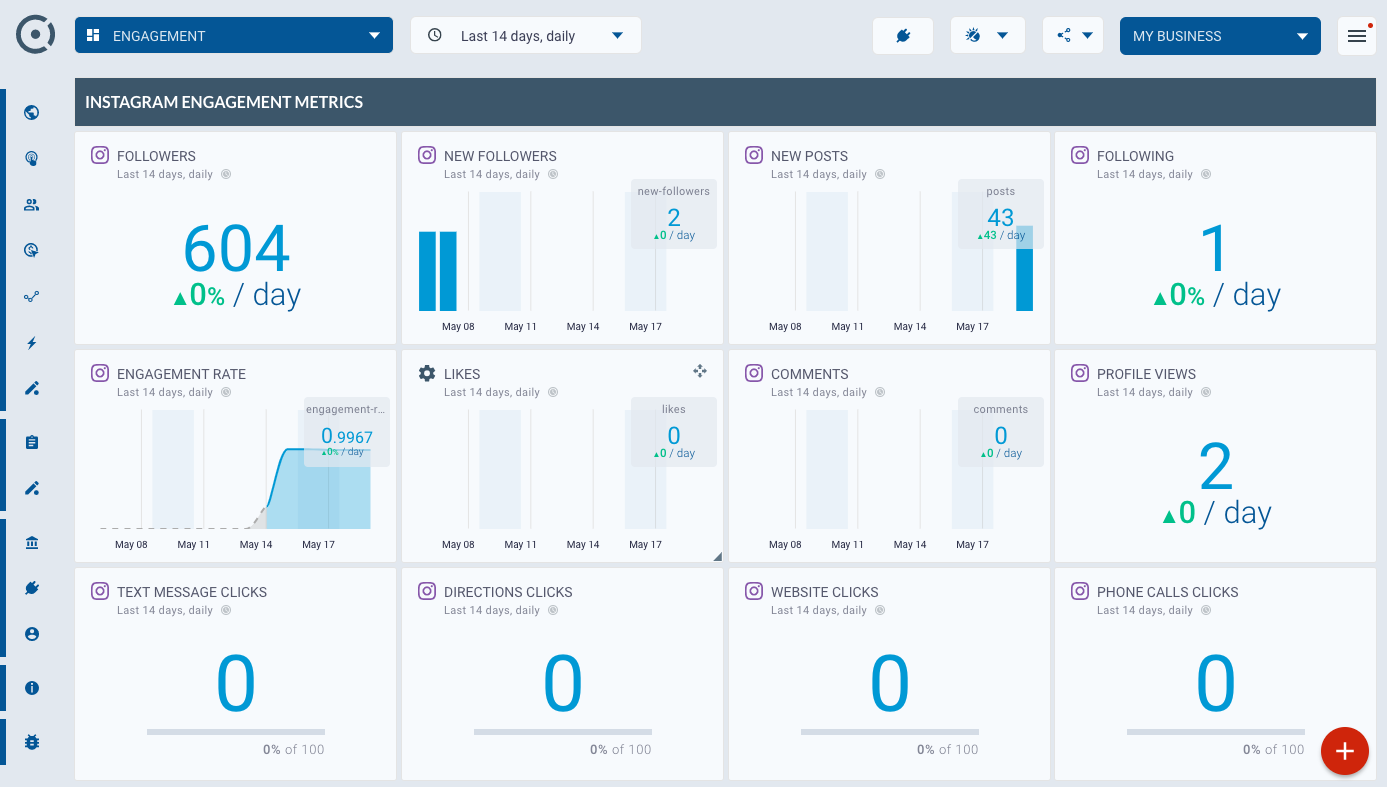
Instagram Engagement
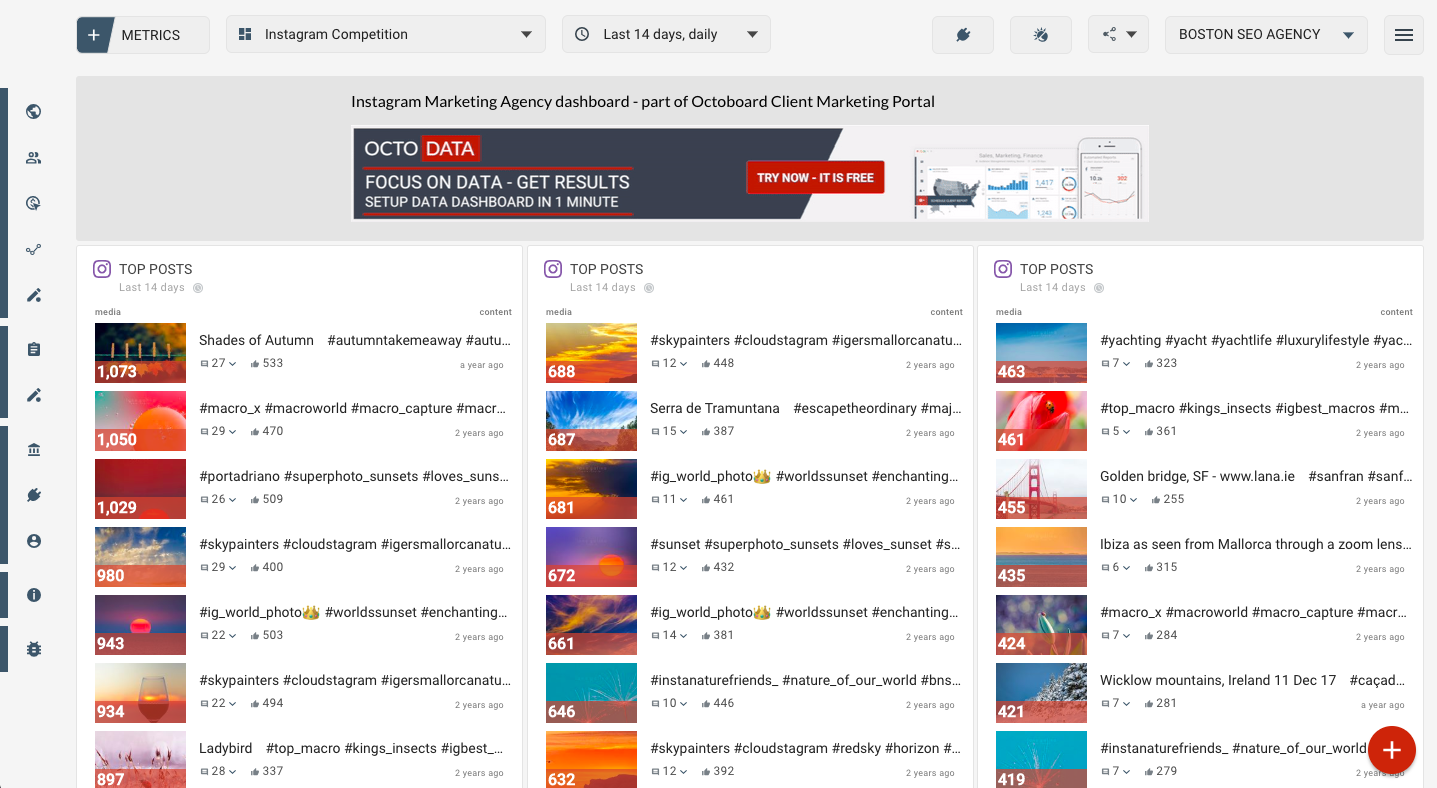
IG Competition - (Depreciated)
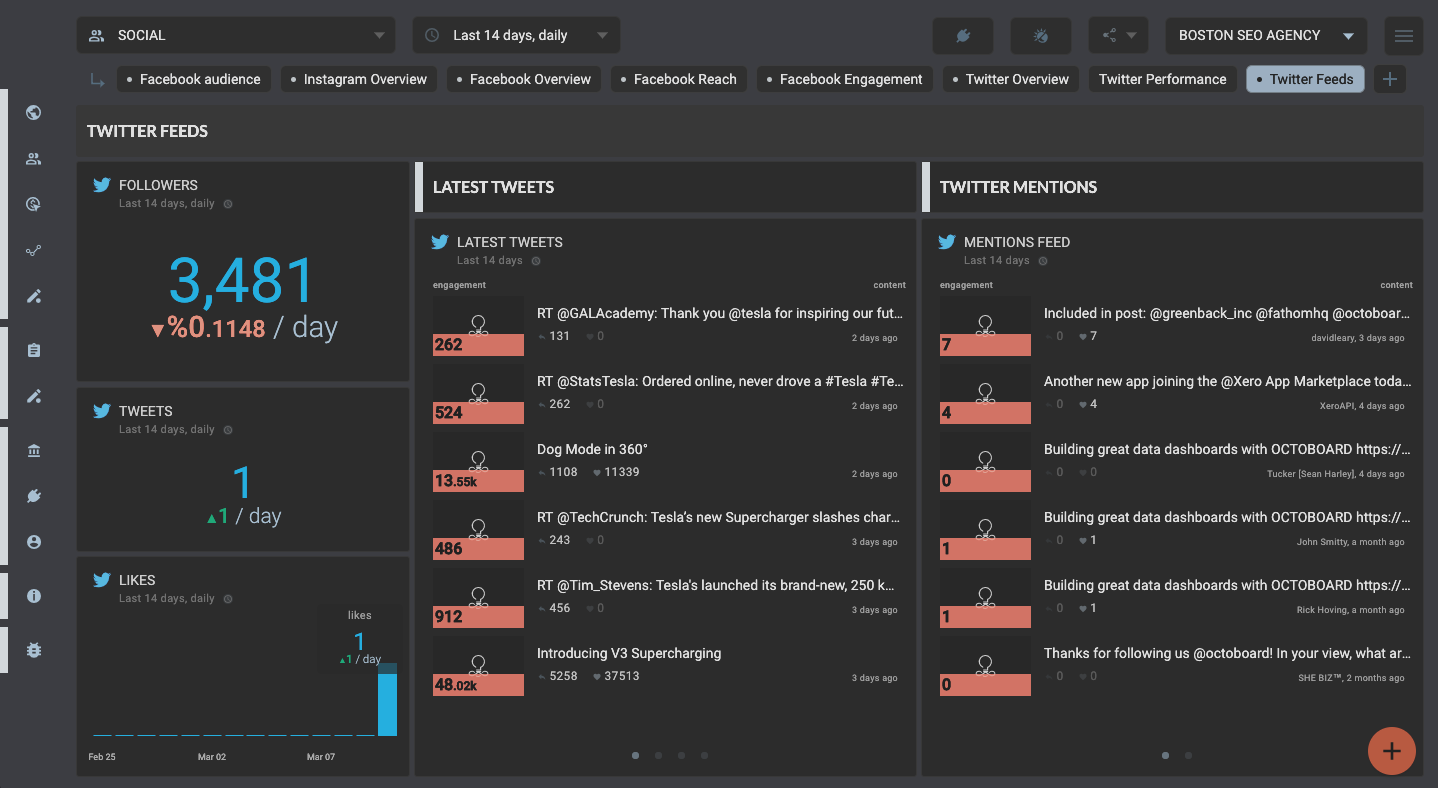
Twitter Feeds
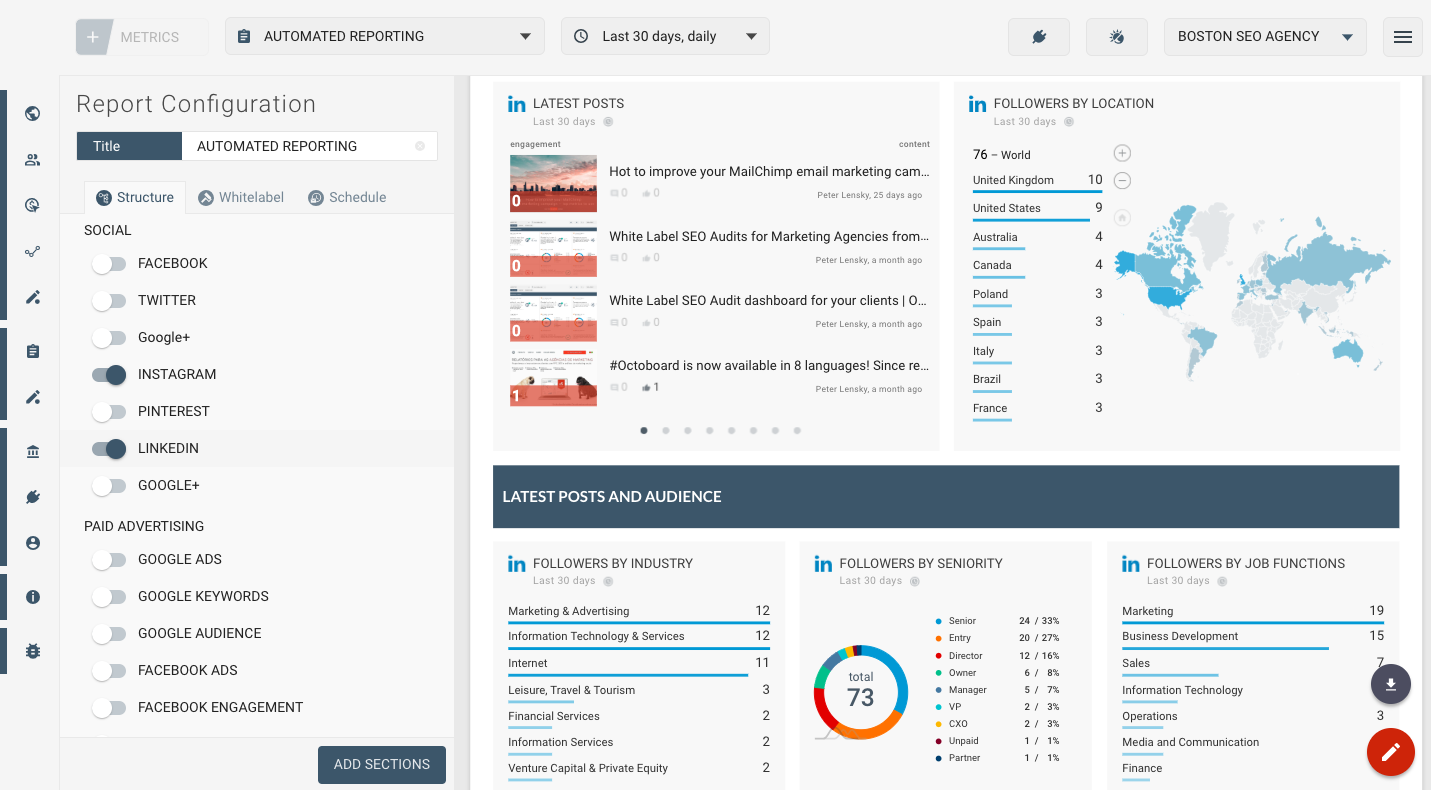
LinkedIn Social Media report template
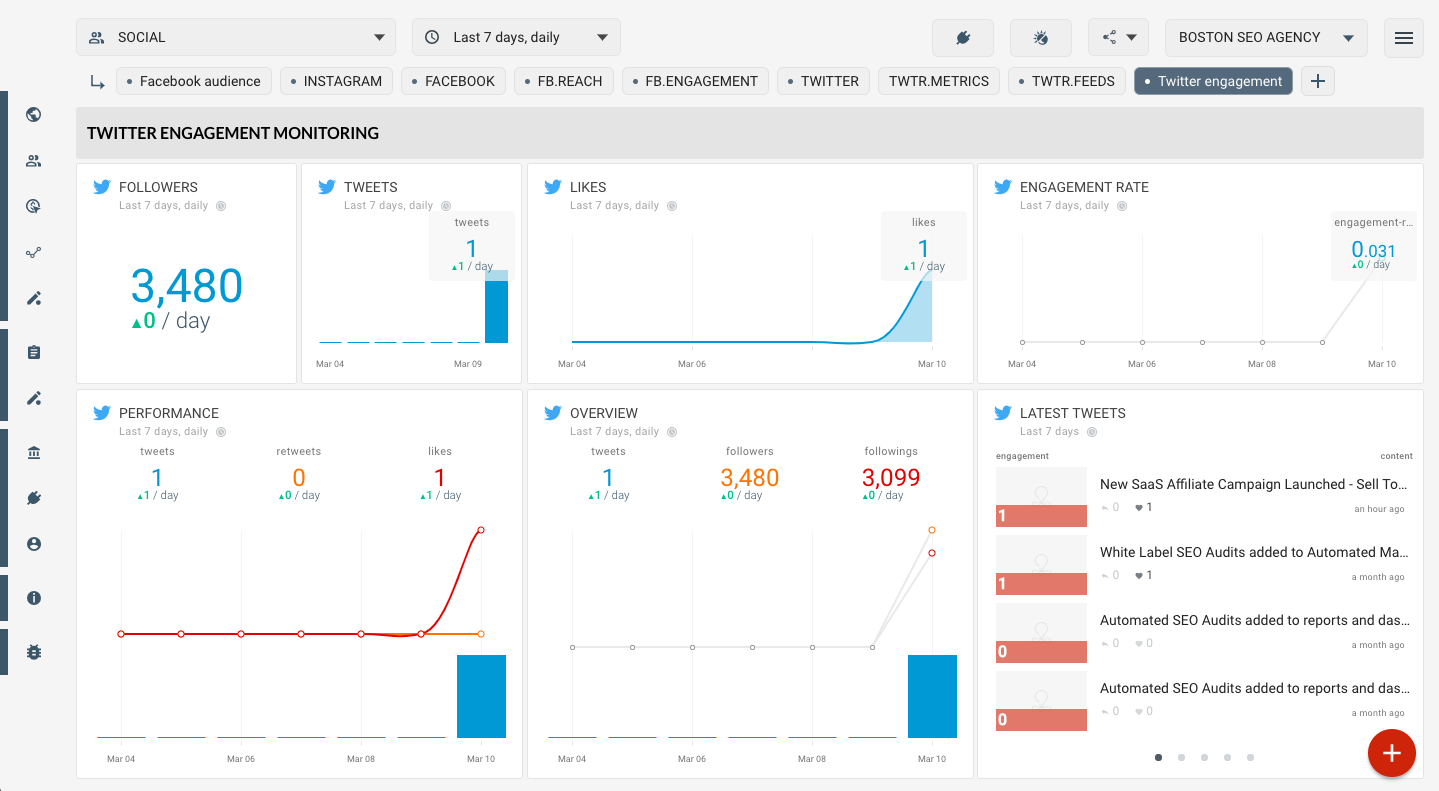
Twitter engagement

Facebook Social media template - Audience metrics
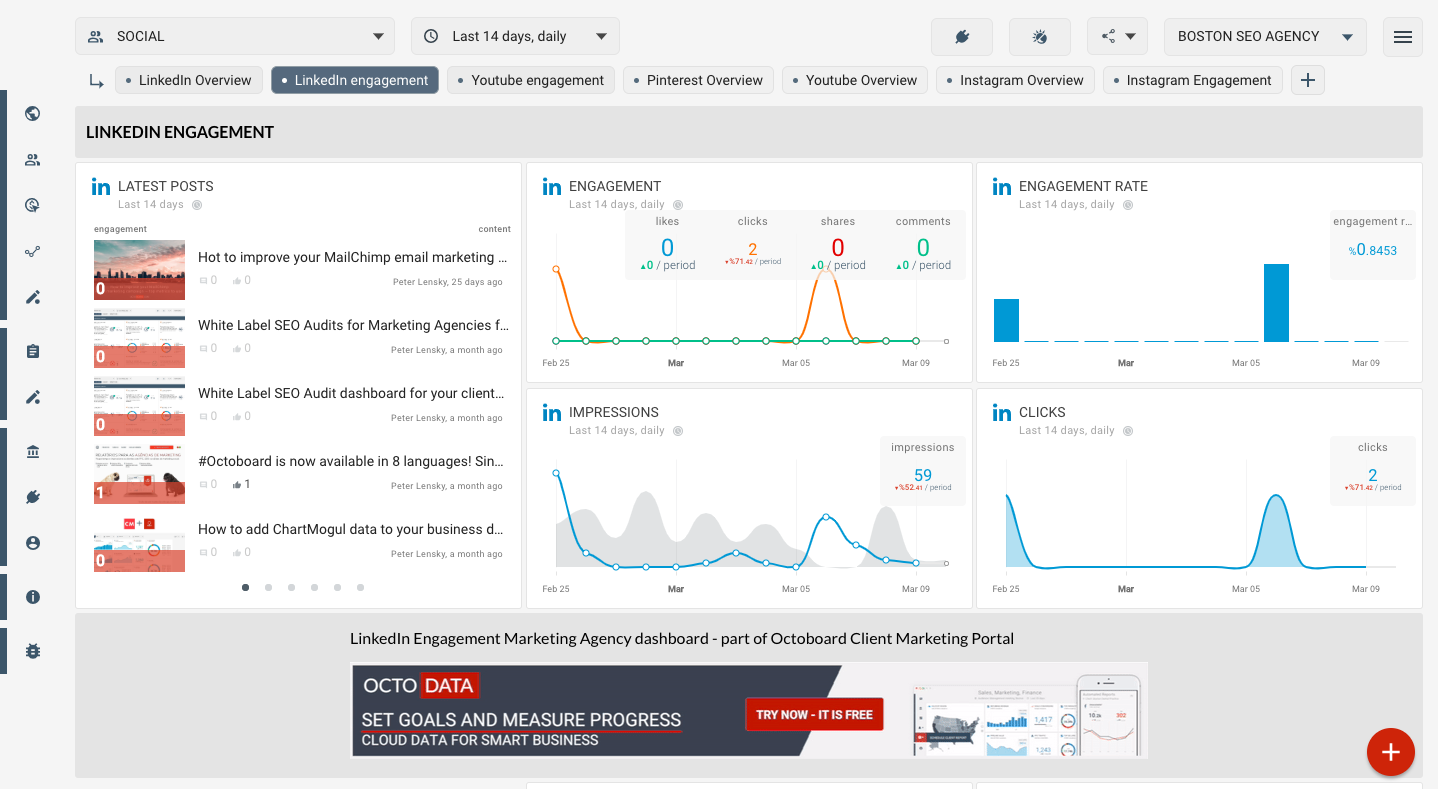
LinkedIn Engagement
Instagram Performance (Report)
Facebook Audience