Maximizing Social Media Success with the Facebook Overview: Insights, Metrics, and Analytics
Discover the power of the "Social Media Dashboard - Facebook Overview" by Octoboard for comprehensive insights into your social media performance.

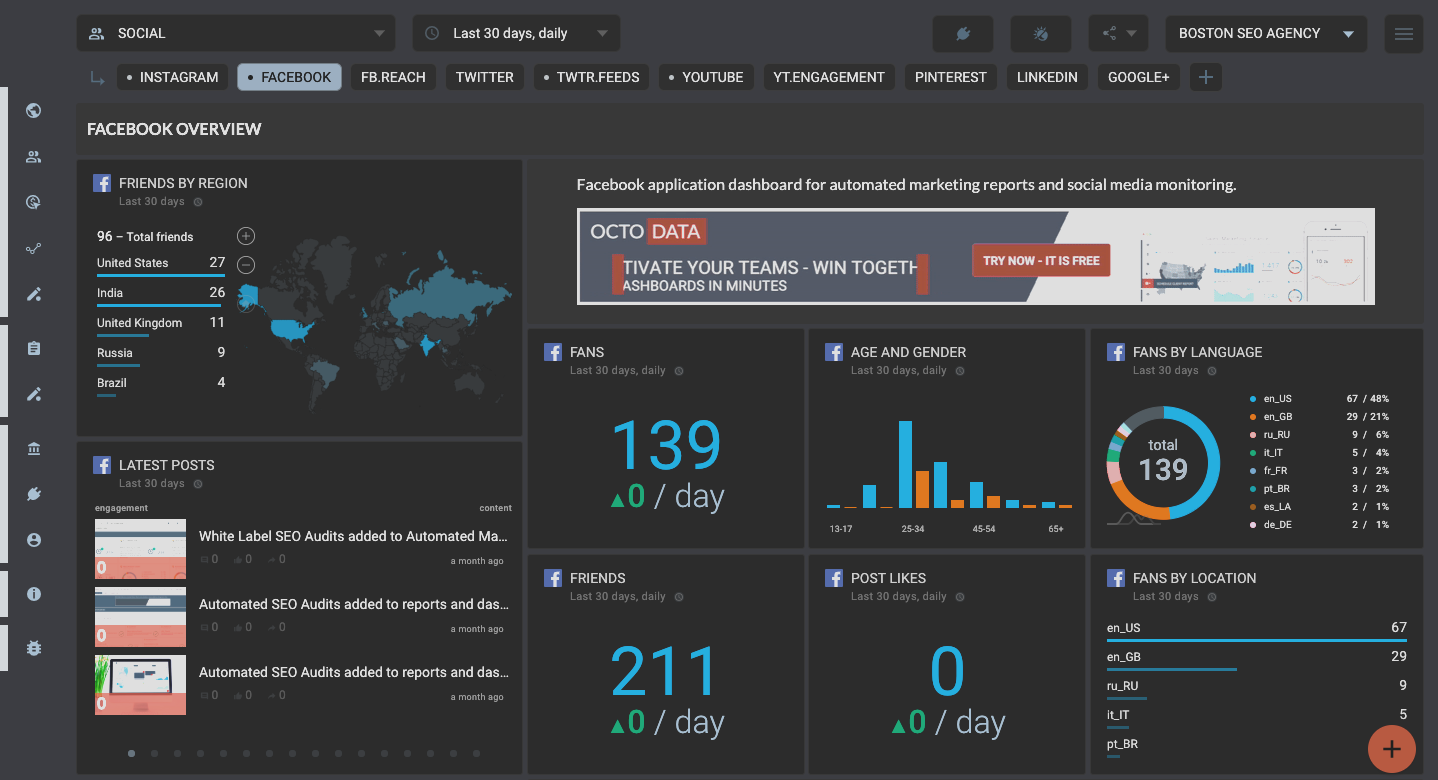
FACEBOOK OVERVIEW
Key Facebook metrics for Social Media marketing dashboard.
It is crucial for marketing teams and online businesses to have a clear understanding of their social media performance. This is where a comprehensive online dashboard, like the "Social Media Dashboard - Facebook Overview," comes into play. This powerful tool, automated by Octoboard, provides valuable insights into various metrics that can help drive marketing strategies, boost engagement, and optimize overall business success.
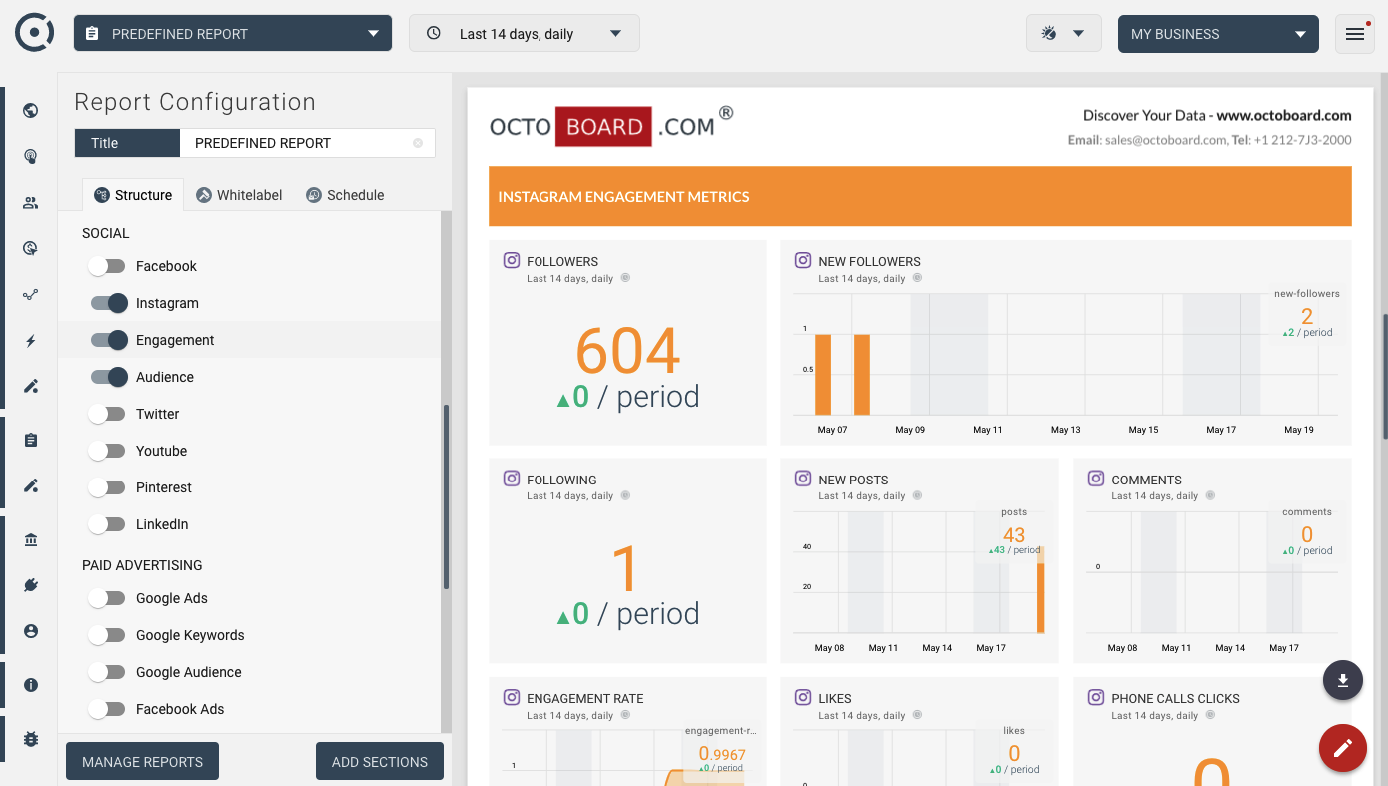
Understanding Key Metrics:
The "Social Media Dashboard - Facebook Overview" comprises several important metrics that can help marketing teams make data-driven decisions. Let's delve into these key metrics and explore their significance:
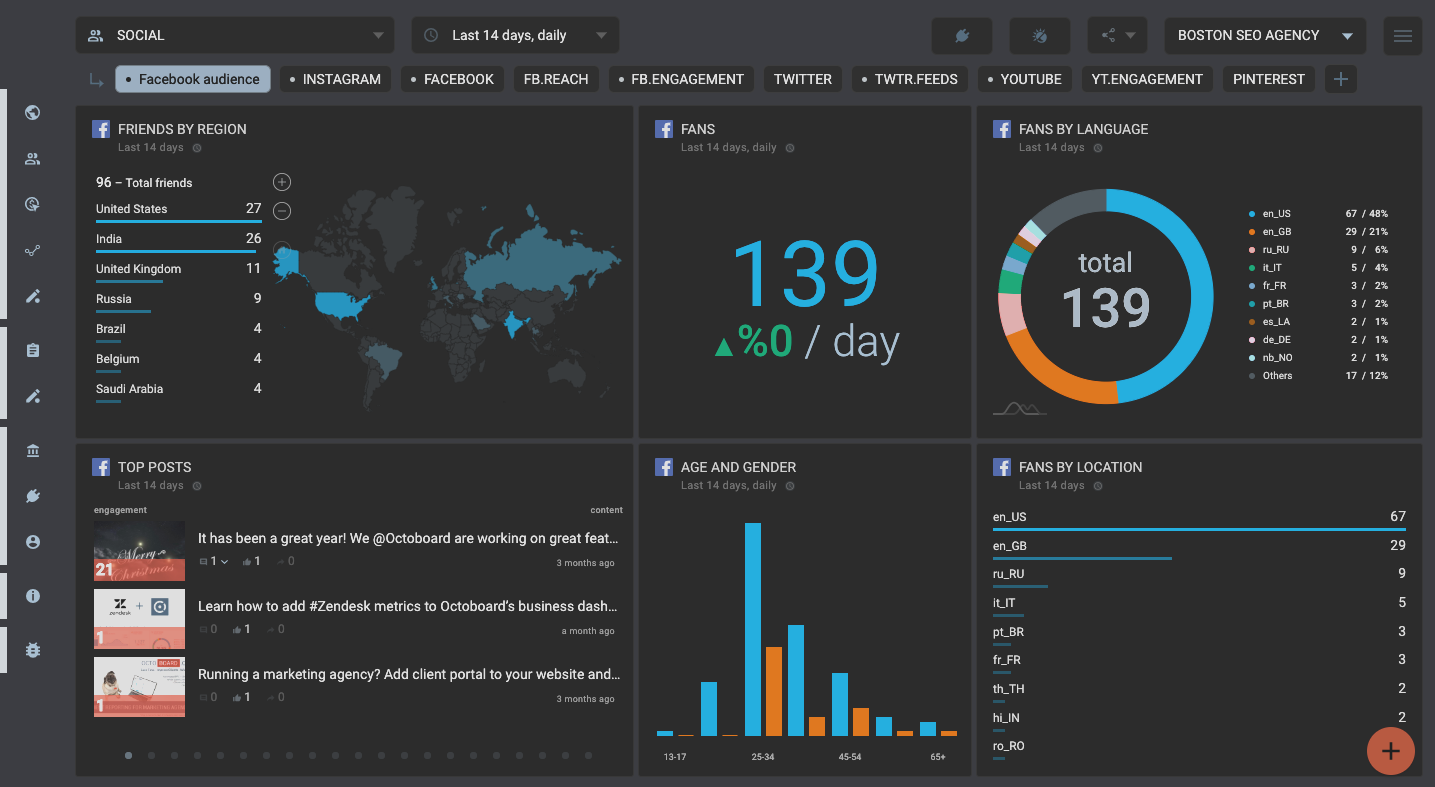
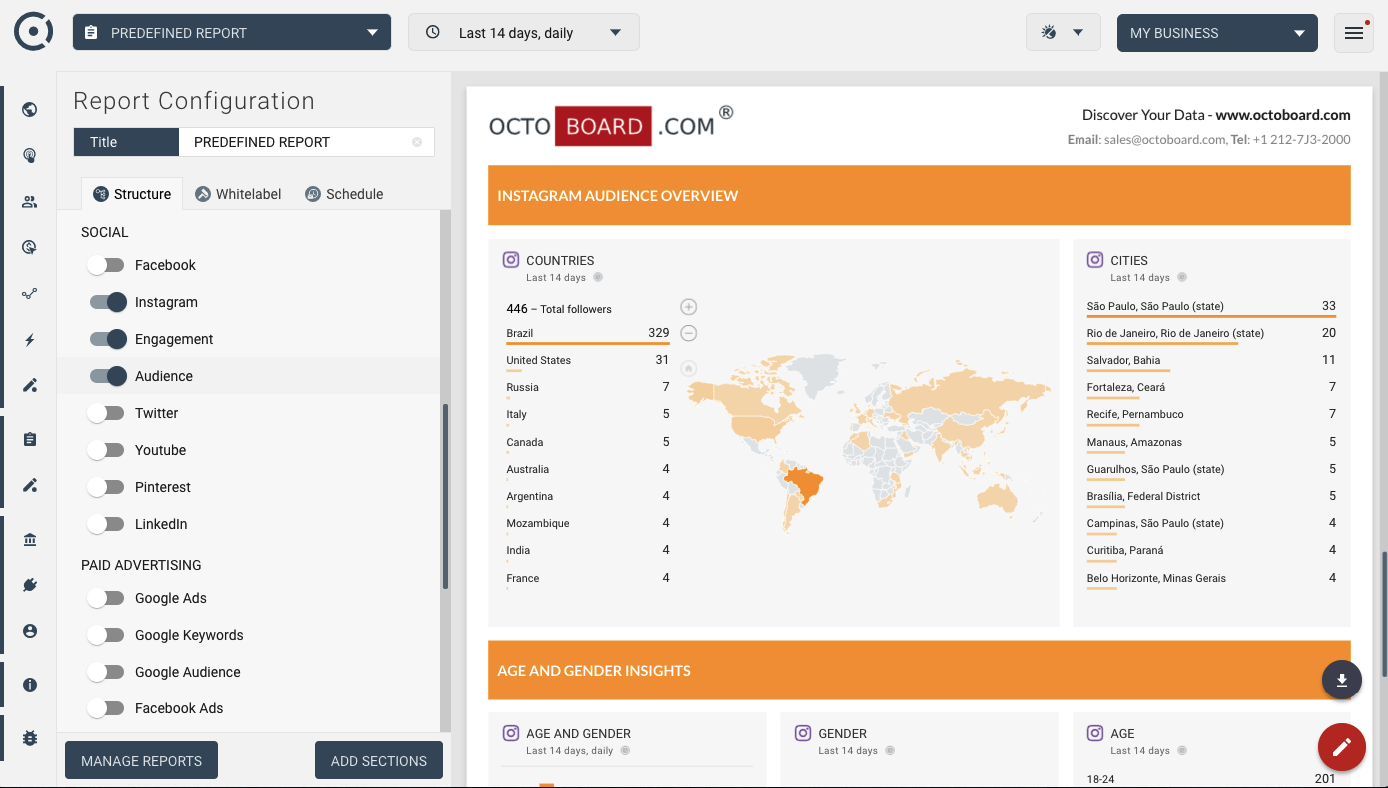
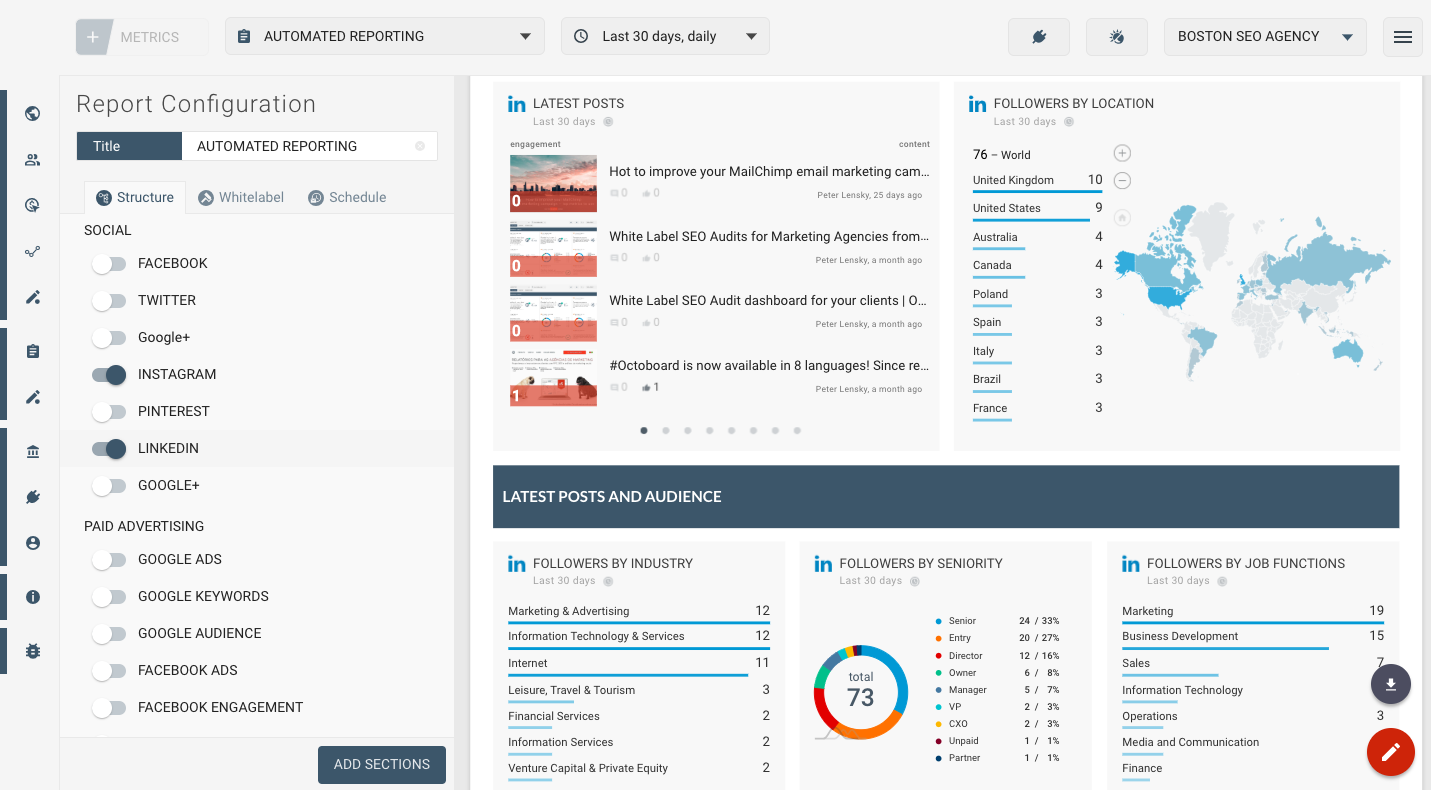
Facebook Fans by Country Map:
This metric presents an interactive map showcasing the distribution of your Facebook fans across different countries. It enables marketing teams to identify geographical areas where their audience is most concentrated. This information is invaluable when planning targeted marketing campaigns or expanding into new markets.
Facebook Fans Series:
The "Facebook Fans Series" metric provides a historical overview of the growth in your Facebook fan base over time. By tracking this metric, marketing teams can assess the effectiveness of their strategies and initiatives. Identifying spikes or dips in fan growth allows businesses to identify successful campaigns and areas that may require improvement.
Facebook Audience Demographic:
Understanding your audience is vital for effective marketing. The "Facebook Audience Demographic" metric provides valuable insights into the age, gender, and location of your Facebook audience. By analyzing this data, marketing teams can tailor their content and messaging to better resonate with their target demographic, resulting in improved engagement and conversions.
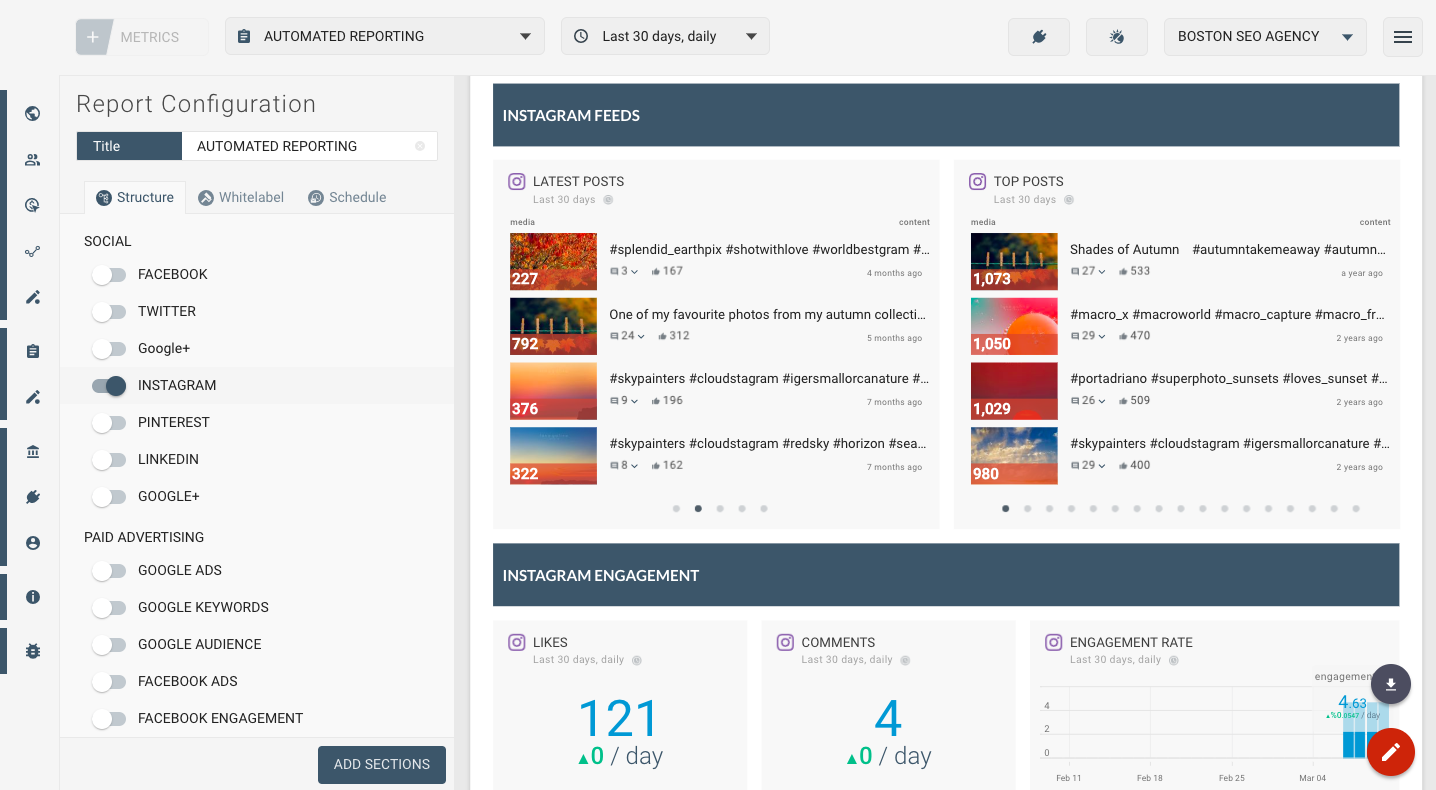
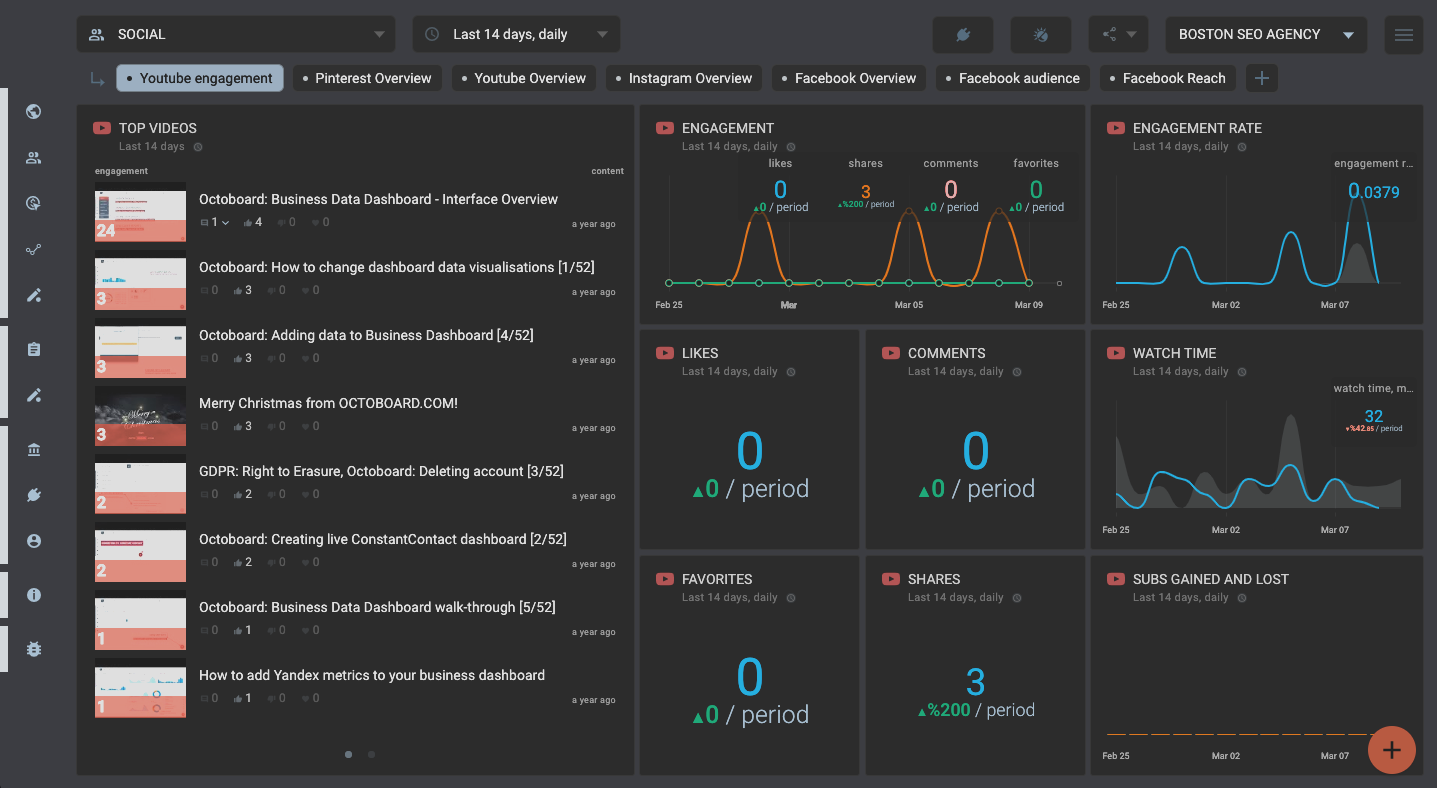
Facebook Shares:
This metric measures the number of times your Facebook content has been shared by your audience. It serves as an indicator of the relevance and value your content offers to your followers. Higher share counts imply that your content is compelling enough to be shared with others, expanding your reach and potentially attracting new customers.
Facebook Pages Likes Daily:
The "Facebook Pages Likes Daily" metric provides a daily snapshot of the number of new likes your Facebook page receives. This metric helps marketing teams understand the impact of their content strategy and promotional efforts on audience engagement and growth. Tracking daily likes allows businesses to identify patterns and determine the effectiveness of specific campaigns or posts.
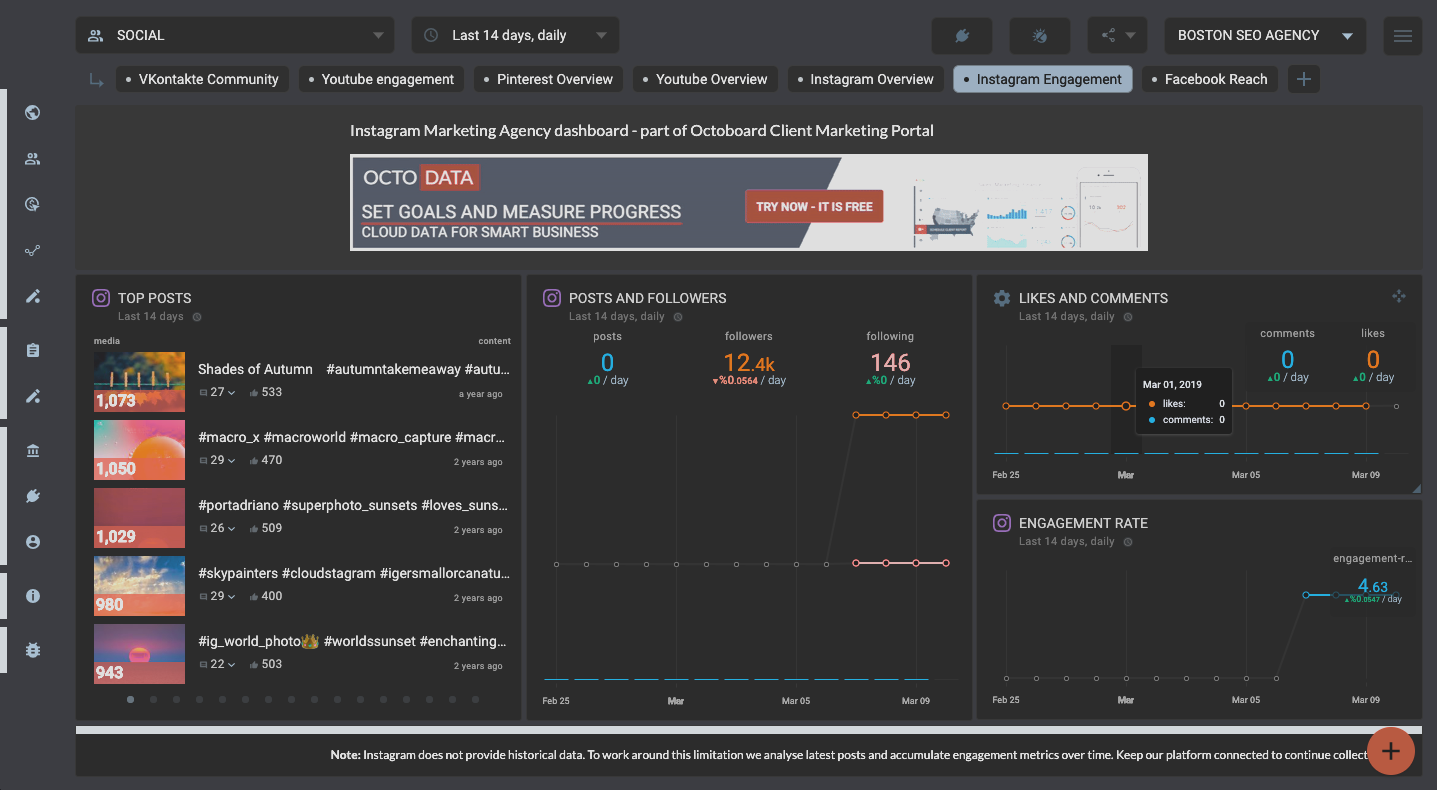
Facebook Impressions Reach Engagement:
This metric combines three crucial elements - impressions, reach, and engagement - into a single measurement. Impressions refer to the number of times your content is displayed, reach represents the unique number of users who have seen your content, and engagement reflects the level of interaction with your content (likes, comments, shares, etc.). Tracking this metric allows marketing teams to gauge the overall effectiveness of their Facebook content and optimize future campaigns for maximum impact.
Facebook Organic vs Paid:
Differentiating between organic and paid reach is crucial for assessing the effectiveness of your marketing budget. The "Facebook Organic vs Paid" metric provides a breakdown of how many users were reached organically versus through paid promotions. This information allows marketing teams to evaluate the return on investment for their paid campaigns and make informed decisions regarding resource allocation.
The Need for Automated Data Analytics:
The "Social Media Dashboard - Facebook Overview" report is generated and automated by Octoboard, an advanced data analytics and report automation software. Utilizing such a platform is essential for marketing teams and online businesses due to several reasons:
Time Efficiency: Manually collecting and analyzing data from multiple sources can be time-consuming. An automated data analytics platform like Octoboard saves valuable time by aggregating all the necessary information in one place.
Data Accuracy: With Octoboard, the risk of human error in data collection and reporting is minimized. Real-time data updates ensure that marketing teams have access to accurate and up-todate information for informed decision-making.
Comprehensive Insights: Octoboard's advanced analytics capabilities provide marketing teams with a comprehensive overview of their social media performance. The platform consolidates data from various sources and presents it in an easily digestible format, allowing teams to gain a holistic understanding of their Facebook metrics.
Customization and Flexibility: Octoboard offers customization options, allowing marketing teams to tailor their dashboards to their specific needs. This flexibility enables businesses to focus on the metrics that matter most to them and monitor their progress towards specific goals.
Real-Time Monitoring: Octoboard provides real-time monitoring of social media metrics, enabling marketing teams to promptly identify any issues or trends. This proactive approach allows for quick adjustments to strategies or campaigns, maximizing their effectiveness.
Collaboration and Reporting: Octoboard facilitates collaboration among marketing teams by providing easy sharing and reporting functionalities. The platform allows teams to collaborate on data analysis, share insights, and generate automated reports for stakeholders, ensuring everyone is on the same page.
The "Social Media Dashboard - Facebook Overview" powered by Octoboard is an invaluable tool for marketing teams and online businesses. It offers a comprehensive view of important metrics, such as Facebook fans by country, audience demographics, shares, likes, impressions, reach, engagement, and organic versus paid reach. With Octoboard's automated data analytics and reporting capabilities, teams can save time, gain accurate insights, and make data-driven decisions to optimize their social media strategies. Embracing advanced analytics platforms like Octoboard is essential in today's competitive digital landscape, ensuring businesses stay ahead of the curve and drive their marketing efforts towards success.
Octoboard customers who created this report also used the following data templates:
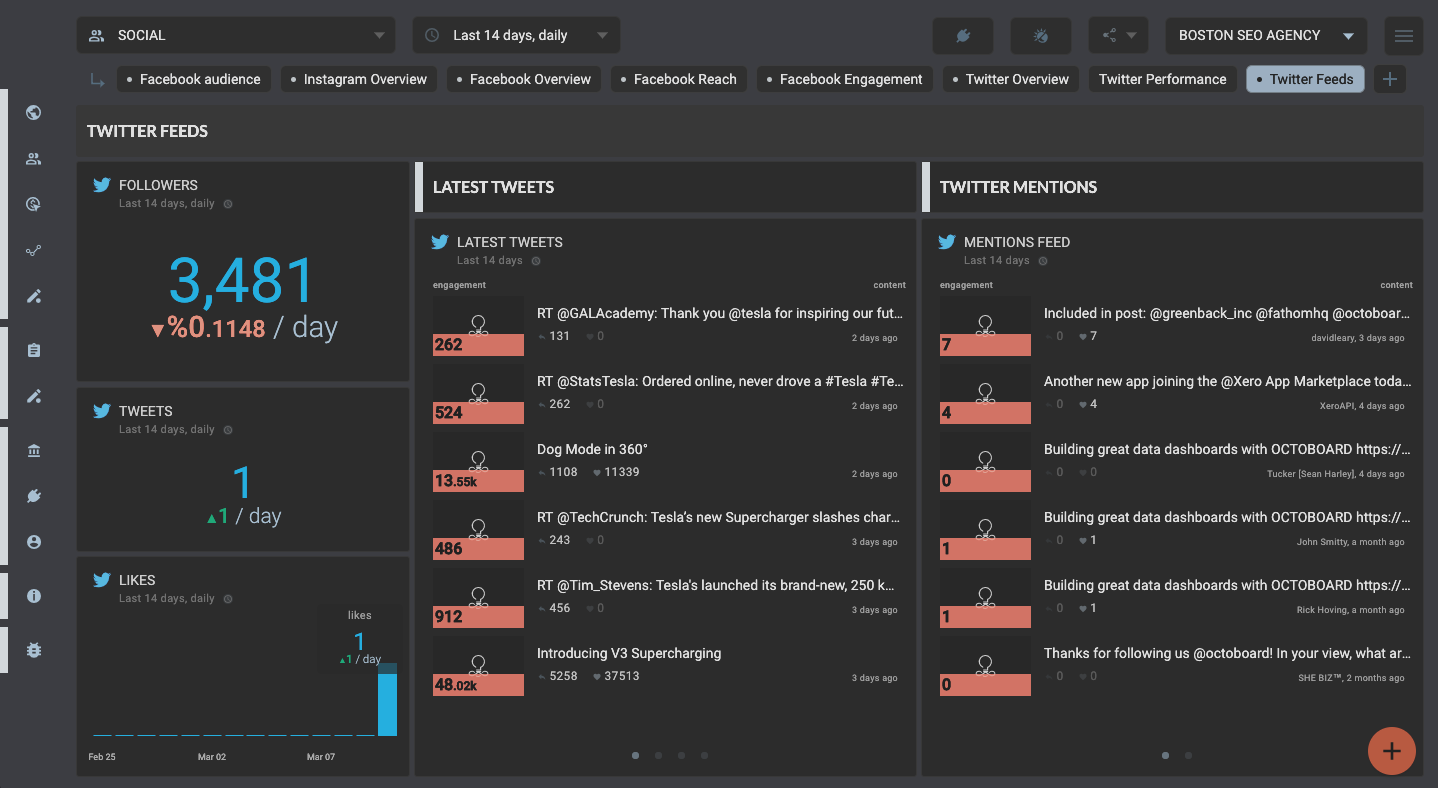
Twitter Feeds
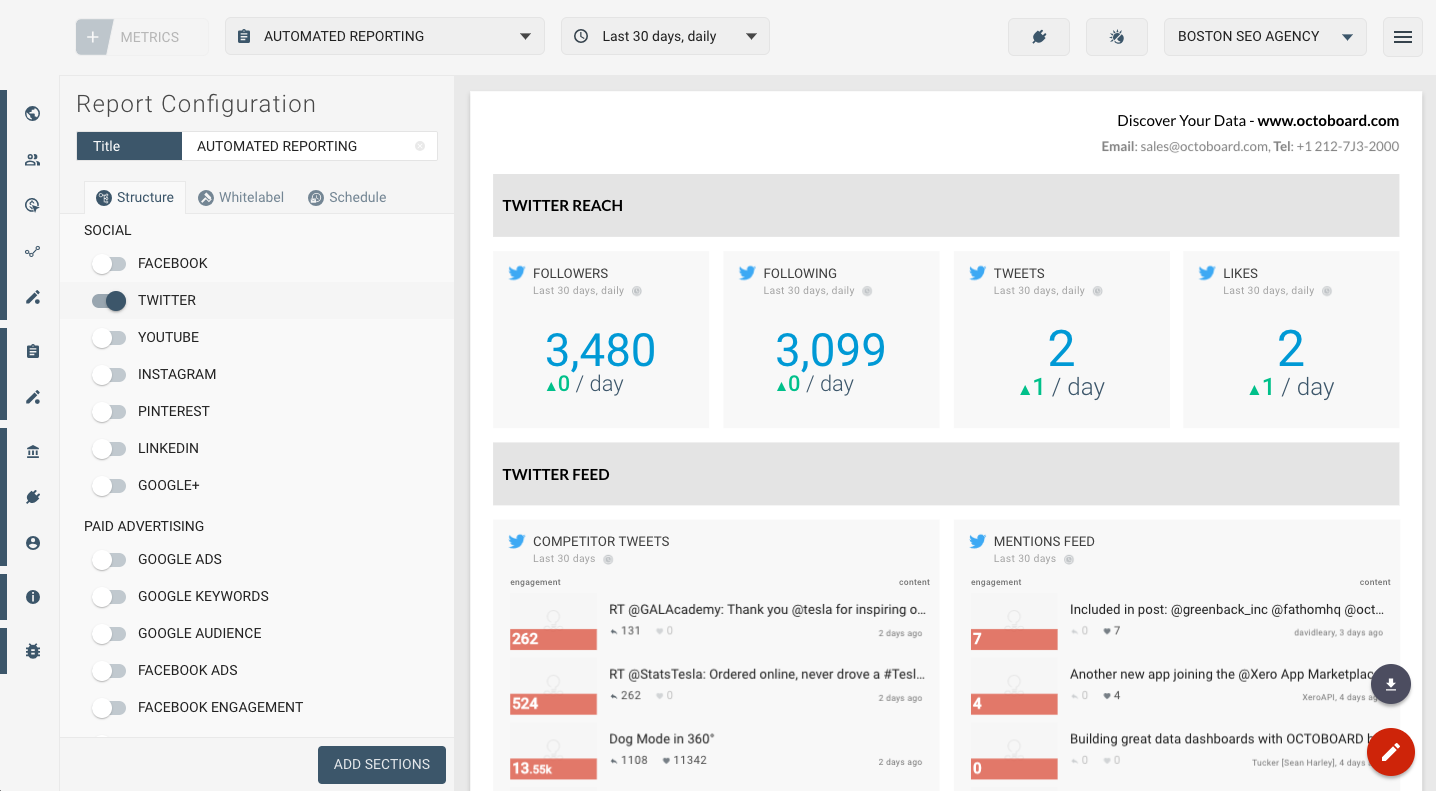
Twitter Overview (Report)
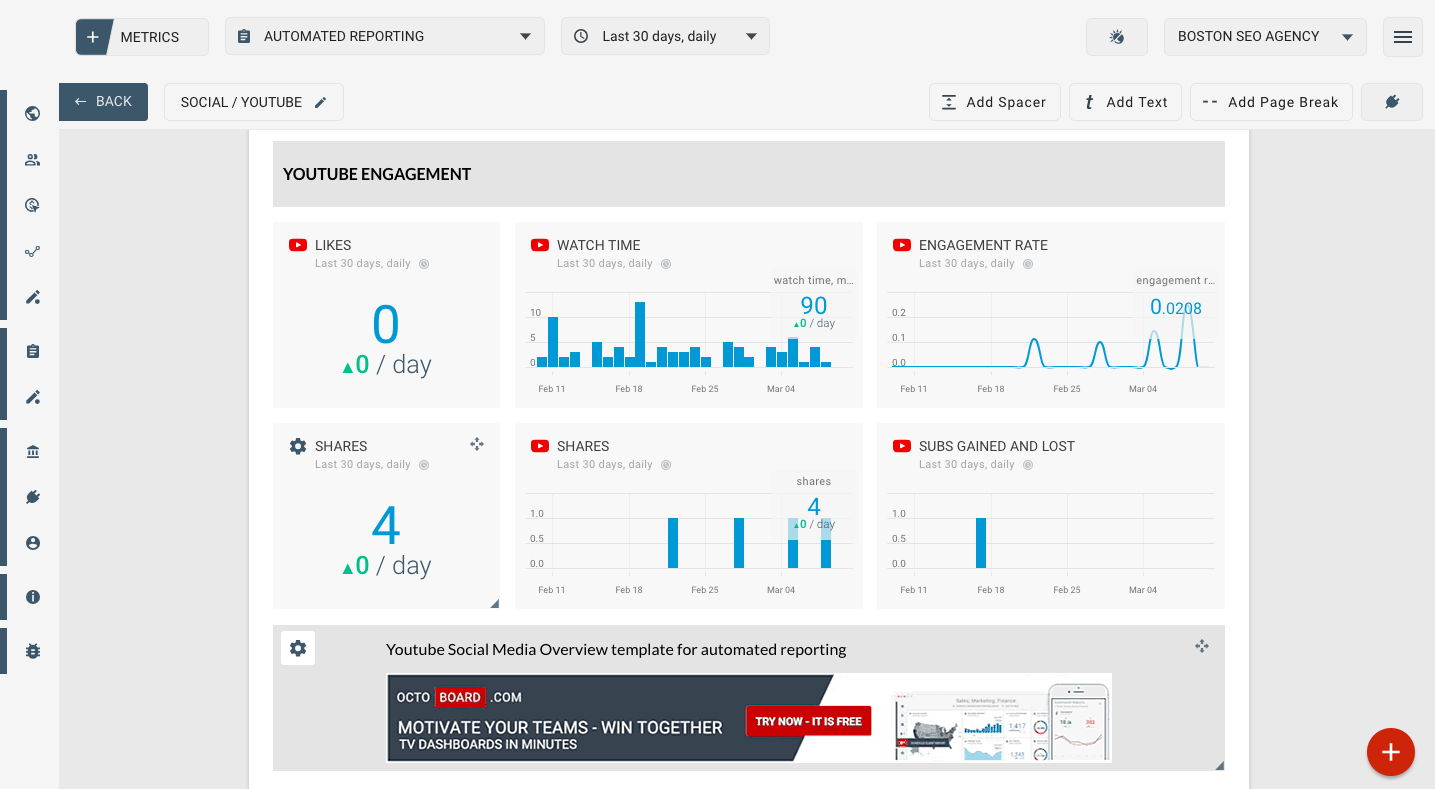
Youtube Engagement (Report)
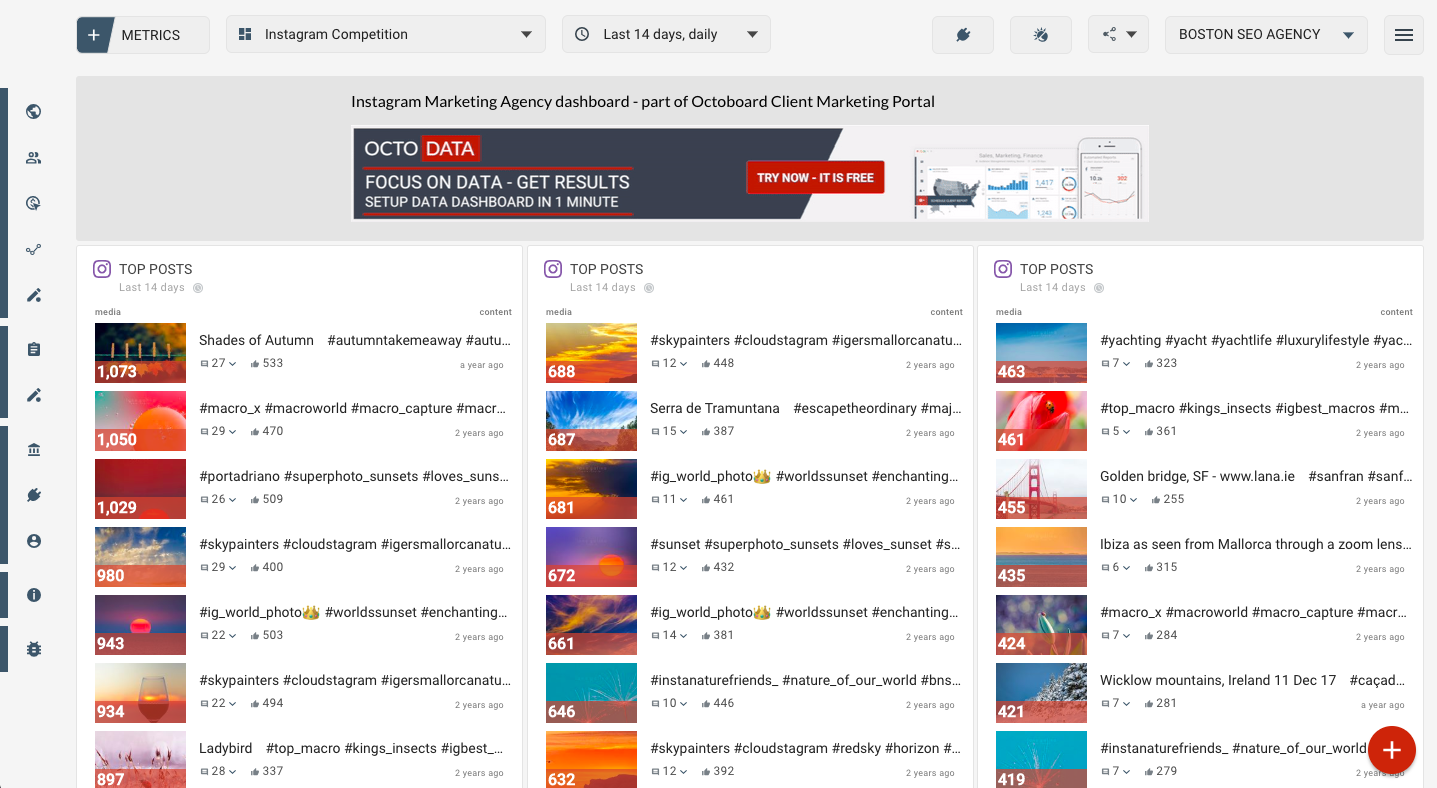
IG Competition - (Depreciated)
Facebook Social media template - Audience metrics
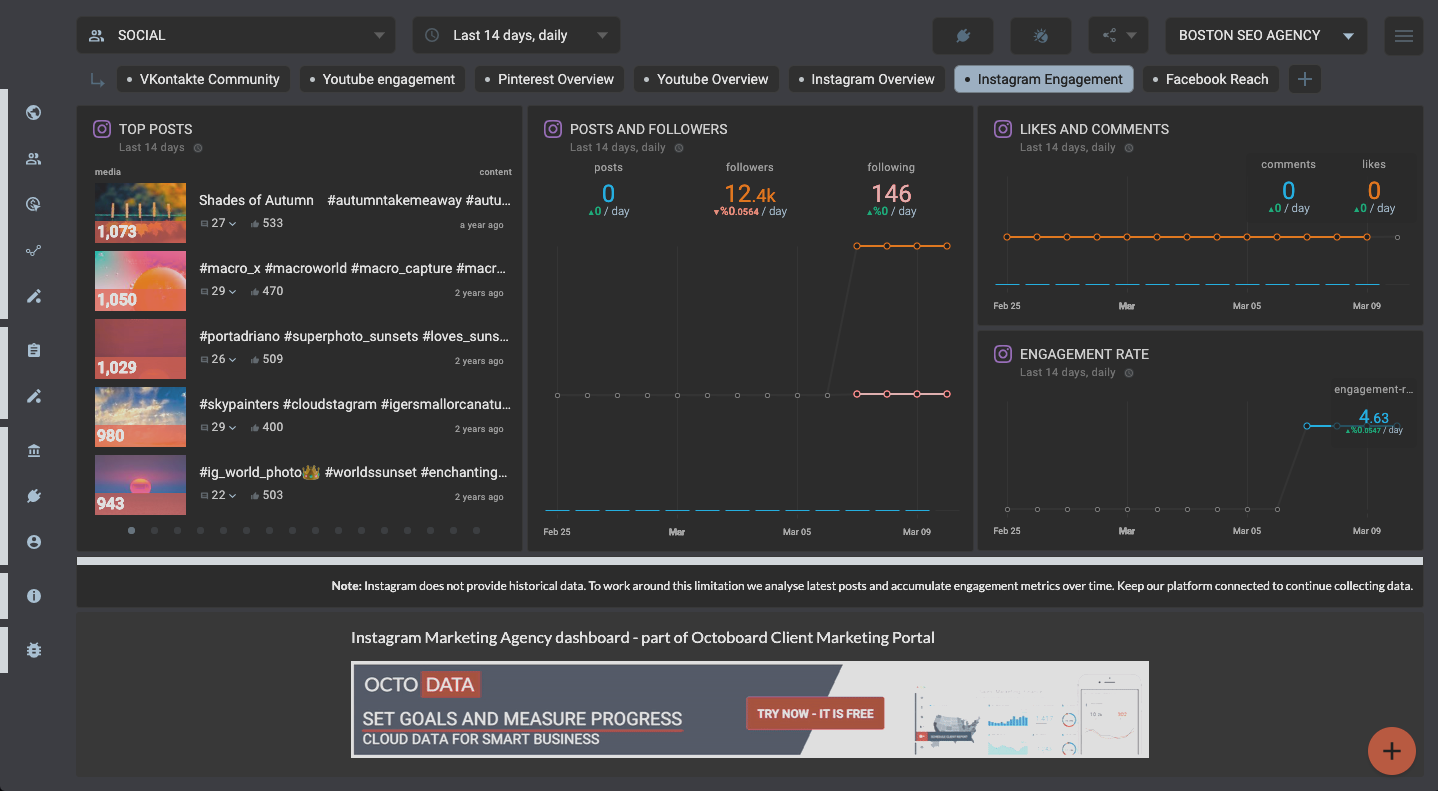
Instagram Engagement (Report)
IG Overview - (Depreciated)
IG Overview - Report (Depreciated)
Instagram Audience (Report)
LinkedIn Social Media report template
Youtube Engagement