Maximizing VKontakte Engagement with Real-Time Social Media Dashboards: A Guide to Octoboard
Learn how to enhance your VKontakte engagement with real-time social media dashboards.

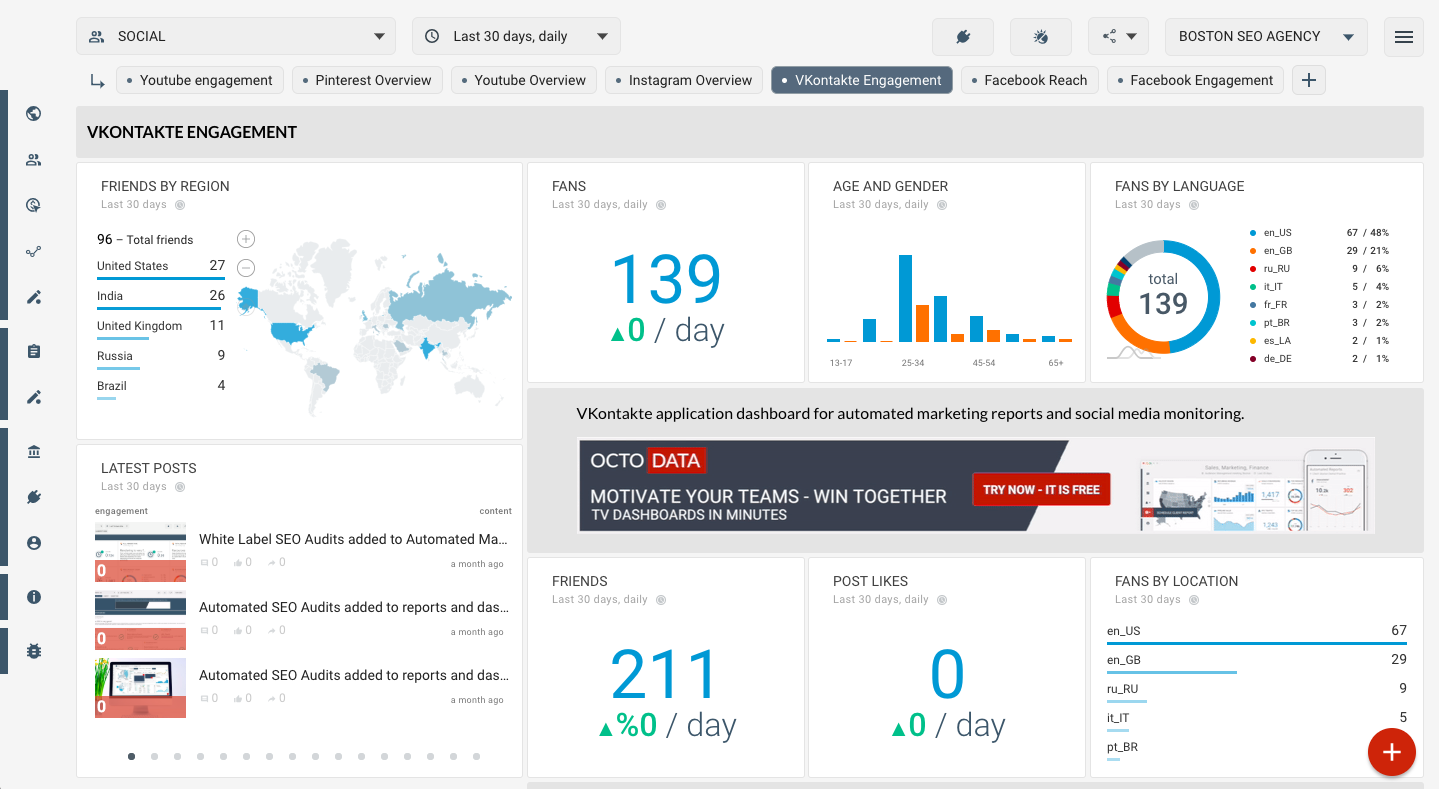
VKONTAKTE ENGAGEMENT
VK engagement metrics for Marketing Agency reports
Building Real-Time Social Media Dashboards: VKontakte Engagement
Social media has become an integral part of any marketing strategy, and VKontakte (VK), Russia's largest social network, is no exception. With its vast user base, understanding and monitoring VKontakte metrics is crucial for any marketing team looking to expand their reach and engage with their audience effectively. Utilizing platforms like Octoboard to create real-time social media dashboards based on VKontakte data can significantly enhance a marketing team's ability to track progress and make informed decisions.
Key VKontakte Metrics for Marketing Success
To understand the importance of a VKontakte dashboard, let's delve into the specific metrics it can track:
- Top Feed: This metric highlights the most engaging content on your feed, allowing teams to understand what captures their audience's attention.
- Community Impressions Visitors: This shows how many unique visitors have seen your posts, providing insight into your content's reach.
- Performance: It gauges overall performance metrics such as reach, engagement, and growth over time.
- Likes, Comments, Reposts: These are classic engagement metrics that reflect how your audience interacts with your content.
- Community Engagement Rate: This measures how actively involved your community is with your content, which is vital for fostering a loyal audience.
- Community Impressions: It gives an overview of how often your content is displayed, regardless of clicks or interactions.
Understanding and monitoring these metrics can give marketing teams valuable insights into their social media performance, helping them to tailor their content strategy accordingly.
The Advantages of Using Octoboard for Social Media Dashboards
Using a platform like Octoboard to create a VKontakte dashboard can bring several advantages:
- Time Efficiency: Octoboard automates the creation of social media dashboards, saving marketing teams hundreds of hours that would otherwise be spent manually gathering and analyzing data.
- Real-Time Updates: The dashboard updates in real-time, providing up-to-date information on VKontakte metrics.
- White Label Portals: Marketing agencies can build customized client portals with their branding, enhancing their professional image.
Displaying such a dashboard in an office not only provides visibility of social media efforts but also keeps the whole team aligned on the progress and goals.
Importance of Monitoring VKontakte Metrics
Monitoring VKontakte metrics is crucial for several reasons:
- Understanding Audience Engagement: Tracking likes, comments, and reposts helps in understanding what type of content resonates with the audience.
- Strategic Content Planning: By analyzing top feed and community engagement rates, teams can strategize their content to maximize engagement.
- Measuring Campaign Effectiveness: Community impressions and visitor metrics allow teams to gauge the reach and impact of their campaigns.
Integrating PPC Reporting with Octoboard
In addition to VKontakte metrics, Octoboard allows marketing teams to integrate multiple PPC channels into one dashboard. This is essential because:
- Unified Reporting: It provides a comprehensive view of all PPC campaigns, making it easier to compare and analyze performance across different platforms.
- Detailed Analytics: Teams can track impressions, user engagement, locations, devices, and more, offering a granular view of their campaigns' effectiveness.
The Octoboard PPC Analytics module takes this further by allowing marketing teams to build new metrics and use advanced formulas, catering to specific reporting needs across various PPC channels, locations, and currencies.
Advanced PPC Analytics for Marketing Agencies
For marketing agencies, the advanced PPC Analytics module is invaluable. It allows for:
- Custom Metrics and Dimensions: Agencies can tailor their analytics to the specific needs of their clients.
- Cross-Channel Reporting: Comparing data across different PPC channels helps in identifying the most effective platforms.
- Currency and Location-Specific Data: This feature is particularly useful for agencies dealing with international clients, enabling them to provide more relevant insights.
Automating Data Detection of Trends with Octoboard
Automating data detection of trends is a game-changer for marketing teams. With the Octoboard Generated ChatGPT/OpenAI feature, teams can:
- Identify Emerging Trends: Automatically detecting trends in VKontakte data helps in staying ahead of the curve.
- Make Data-Driven Decisions: This feature assists in making informed decisions based on the latest data insights.
- Monitor Marketing Progress: Regular trend analysis ensures that marketing strategies remain relevant and effective.
Google Sheets Data Export Feature
The Google Sheets data export feature by Octoboard is crucial for teams preferring to analyze data in a familiar spreadsheet format. The Octoboard Google Sheets add-on enables marketing teams to:
- Easily Access Data: Exporting data to Google Sheets allows for easy access and sharing among team members.
- Custom Analysis: Teams can perform custom analyses or combine VKontakte data with other data sources.
- Flexible Reporting: This feature provides flexibility in how data is reported and visualized, catering to diverse analytical needs.
In essence, a comprehensive VKontakte dashboard created using Octoboard's analytics platform offers a myriad of benefits for marketing teams. From saving time through automation to providing deeper insights through advanced analytics and trend detection, these tools are indispensable for modern marketers seeking to maximize their impact on social media platforms like VKontakte.
Octoboard customers who created this report also used the following data templates:
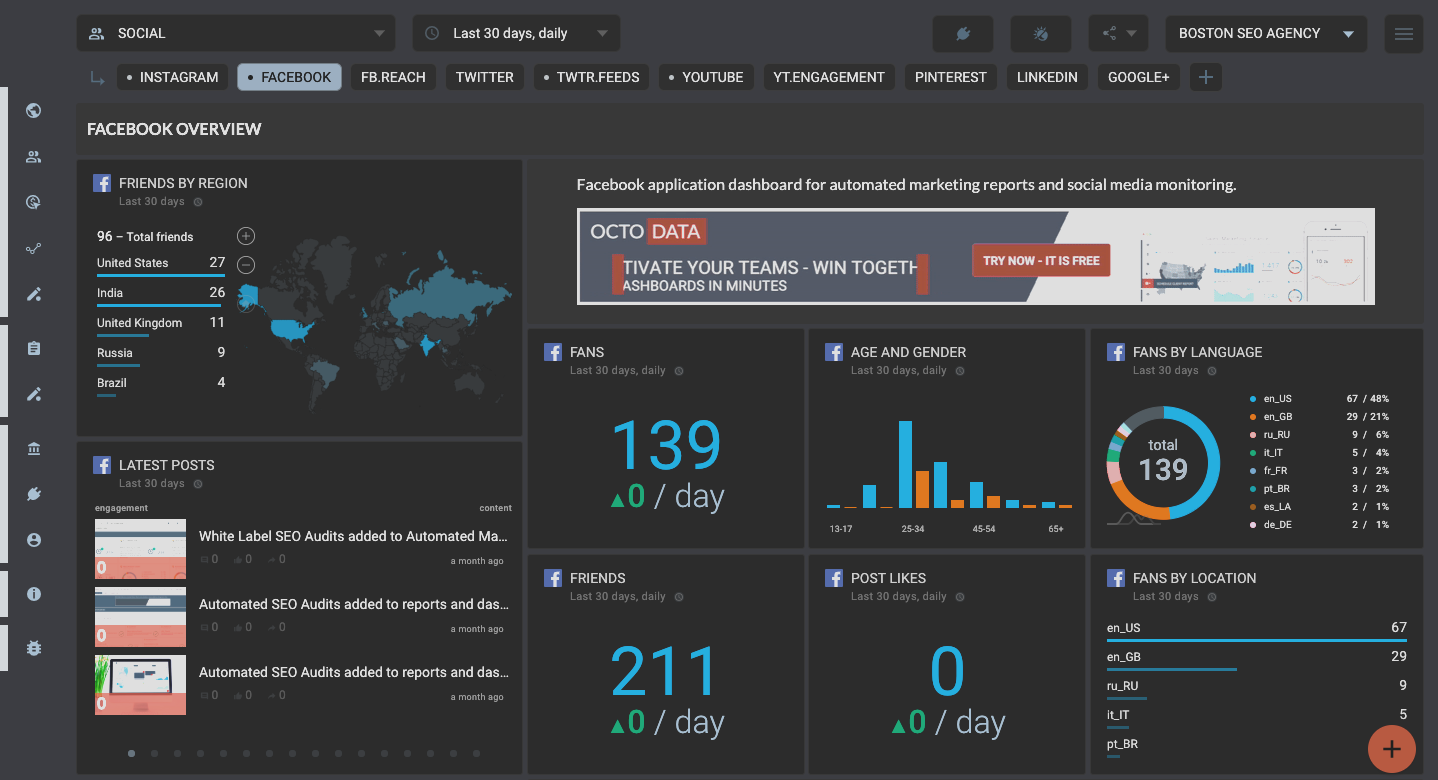
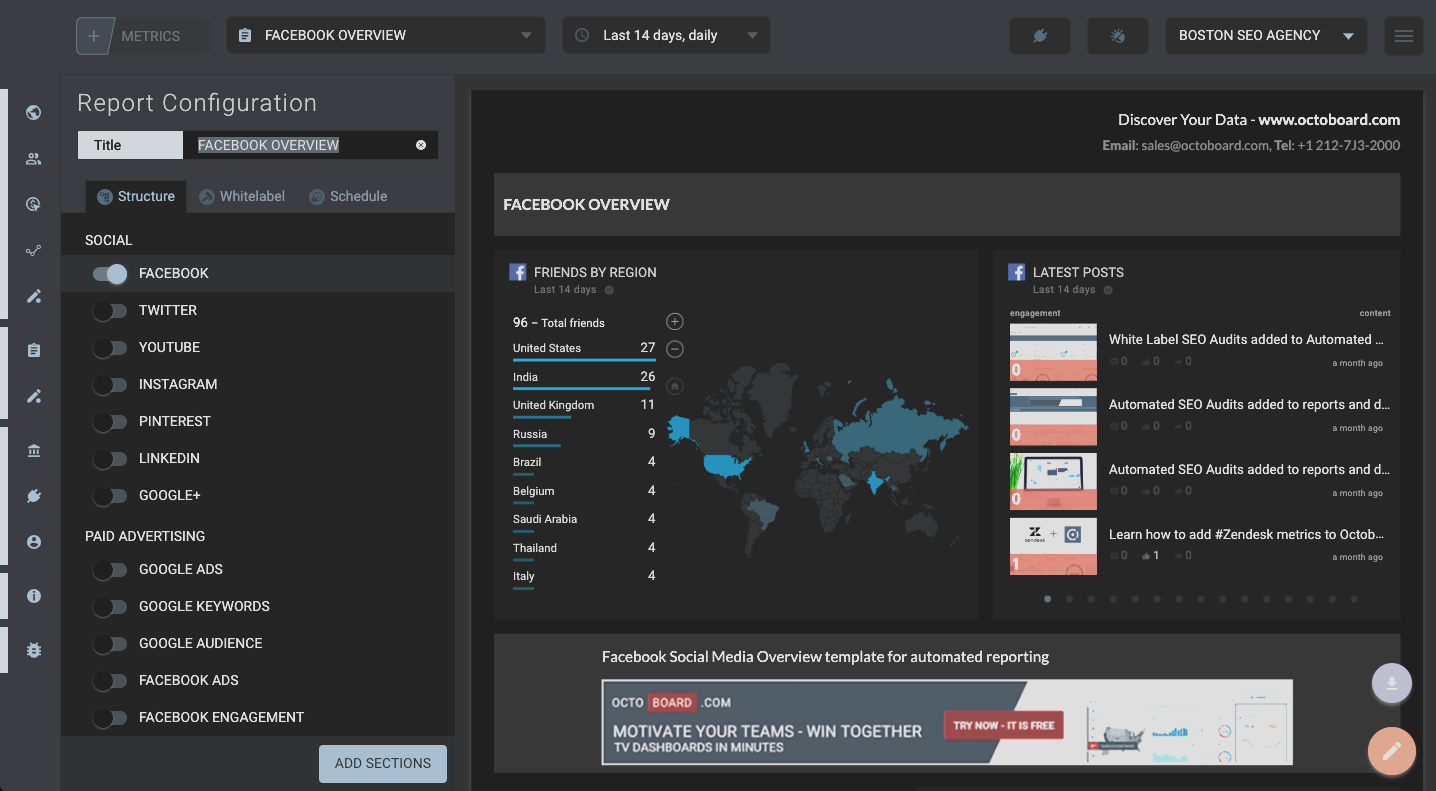
Facebook Overview
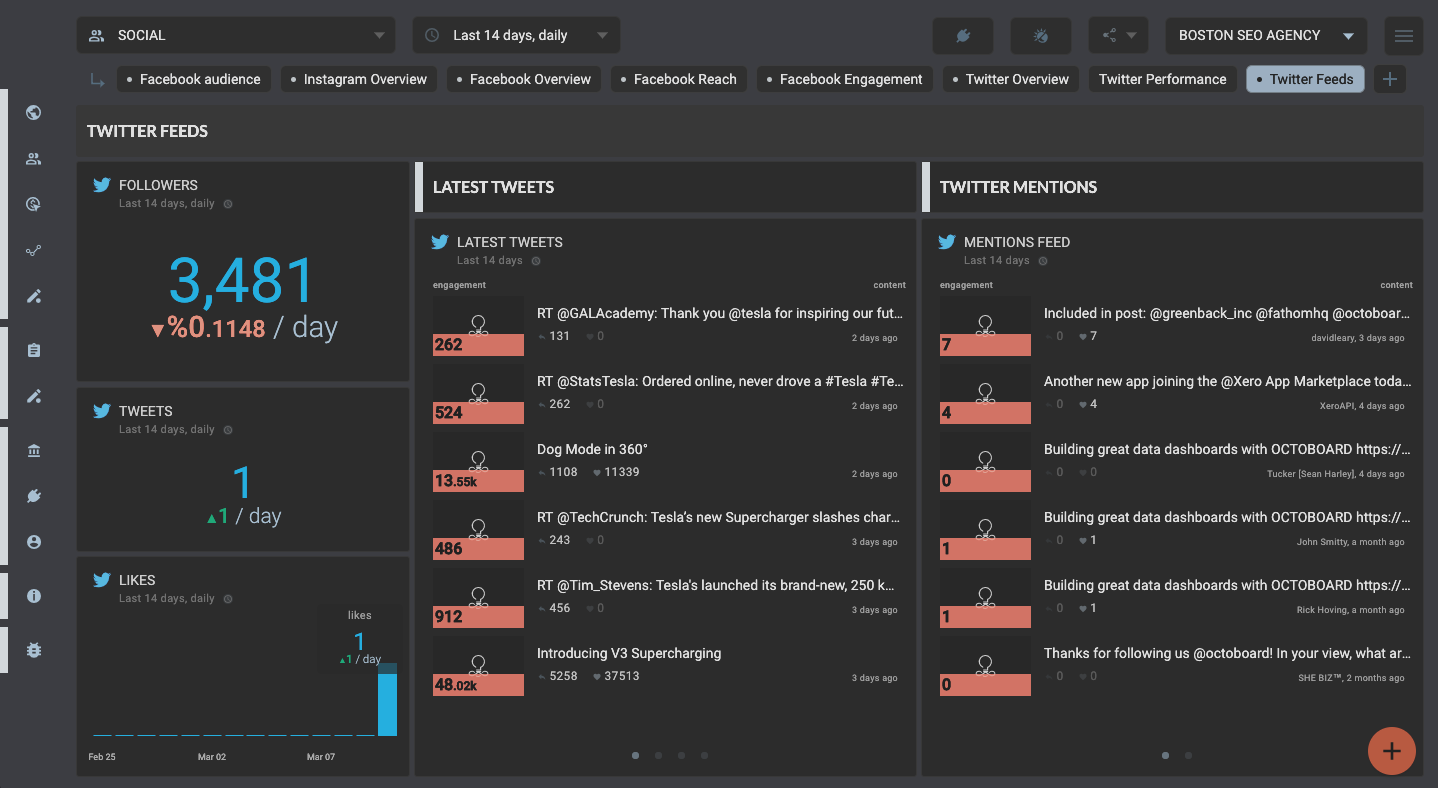
Twitter Feeds
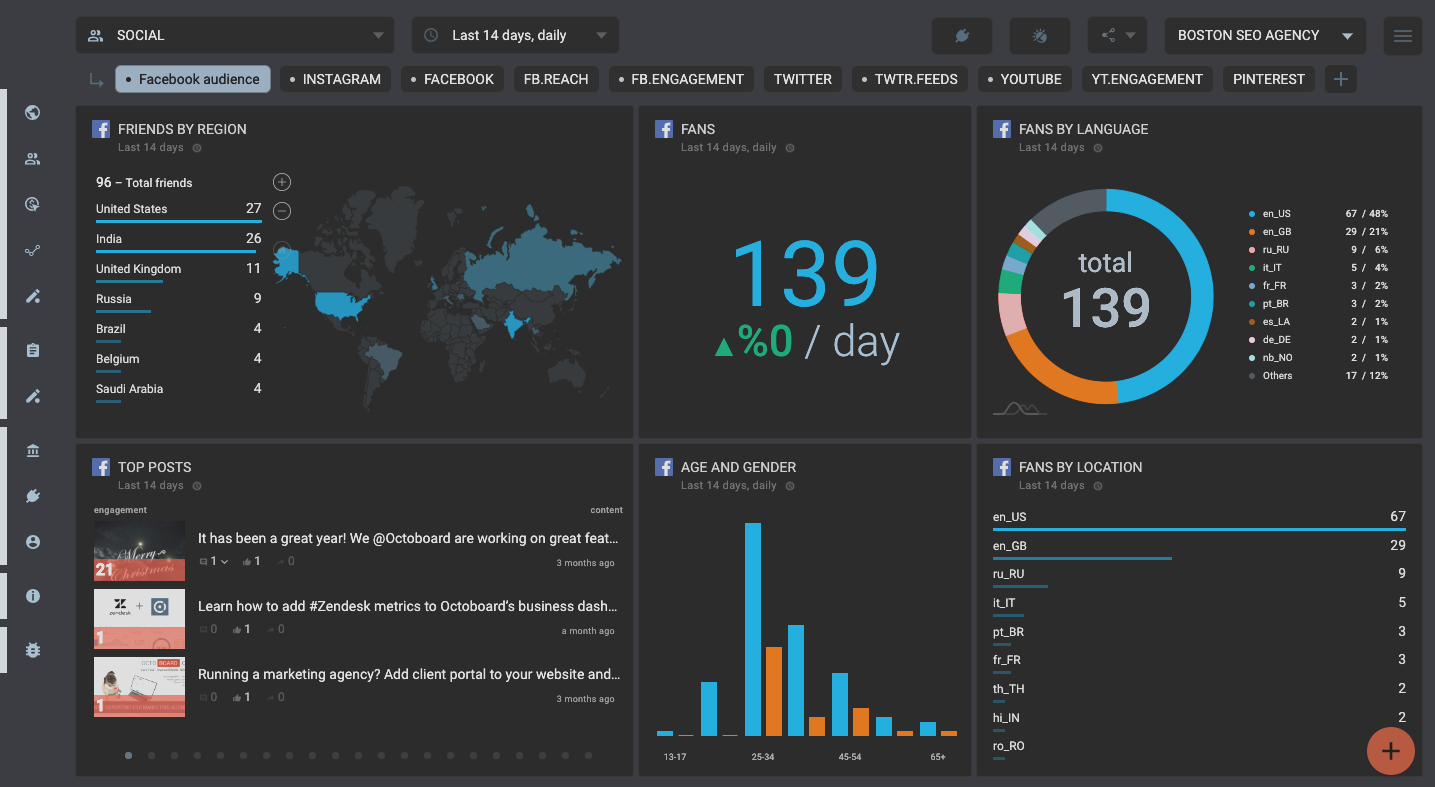
Facebook Audience
IG Overview - (Depreciated)
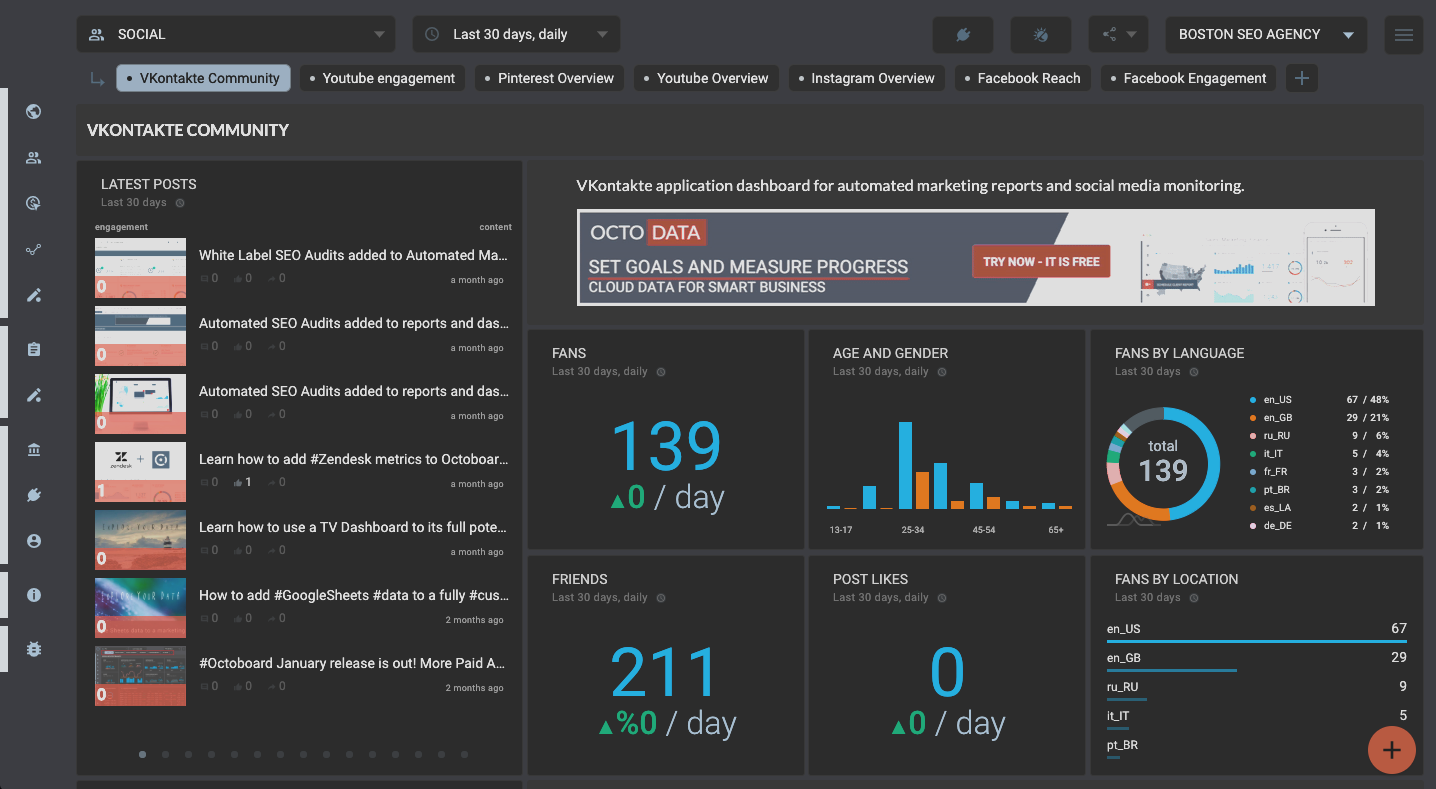
VKontakte Community
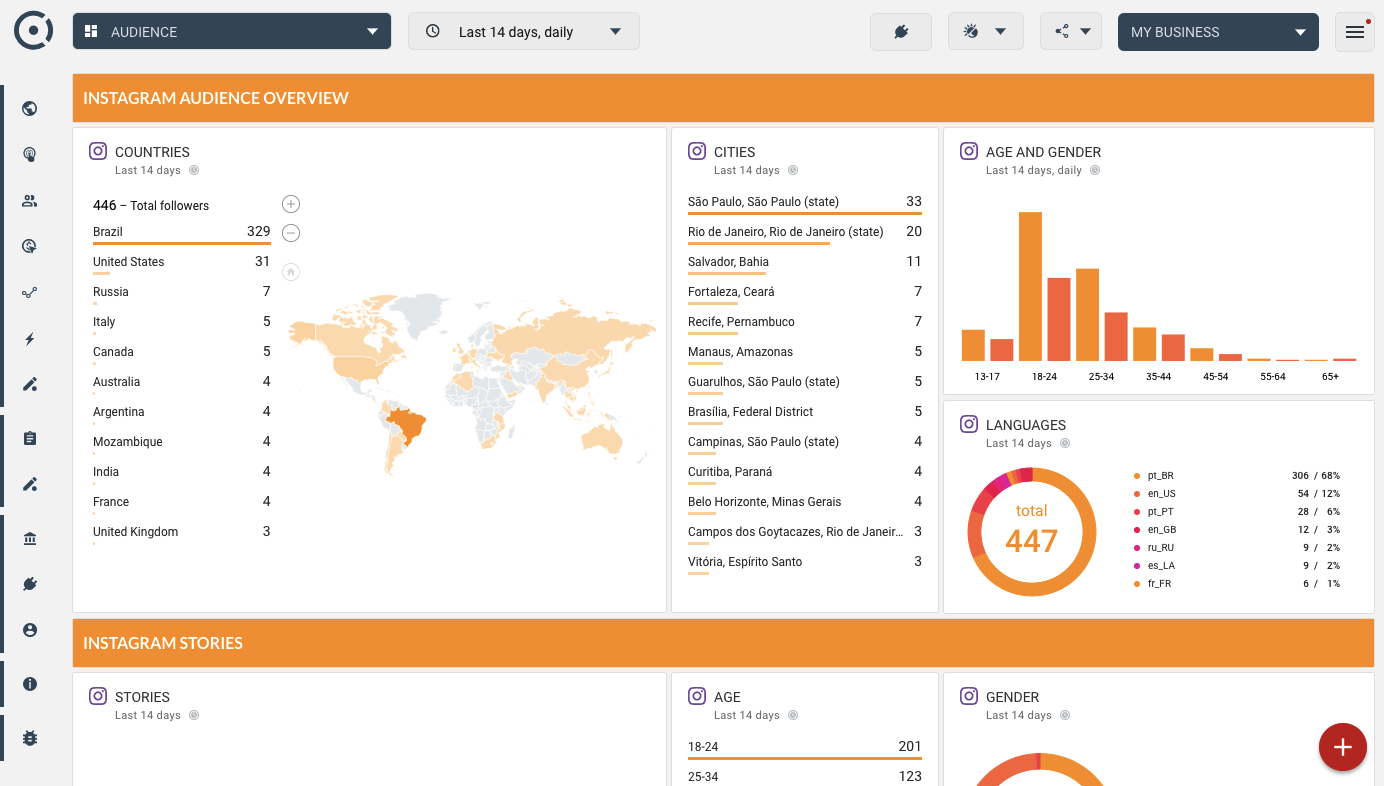
Instagram Audience
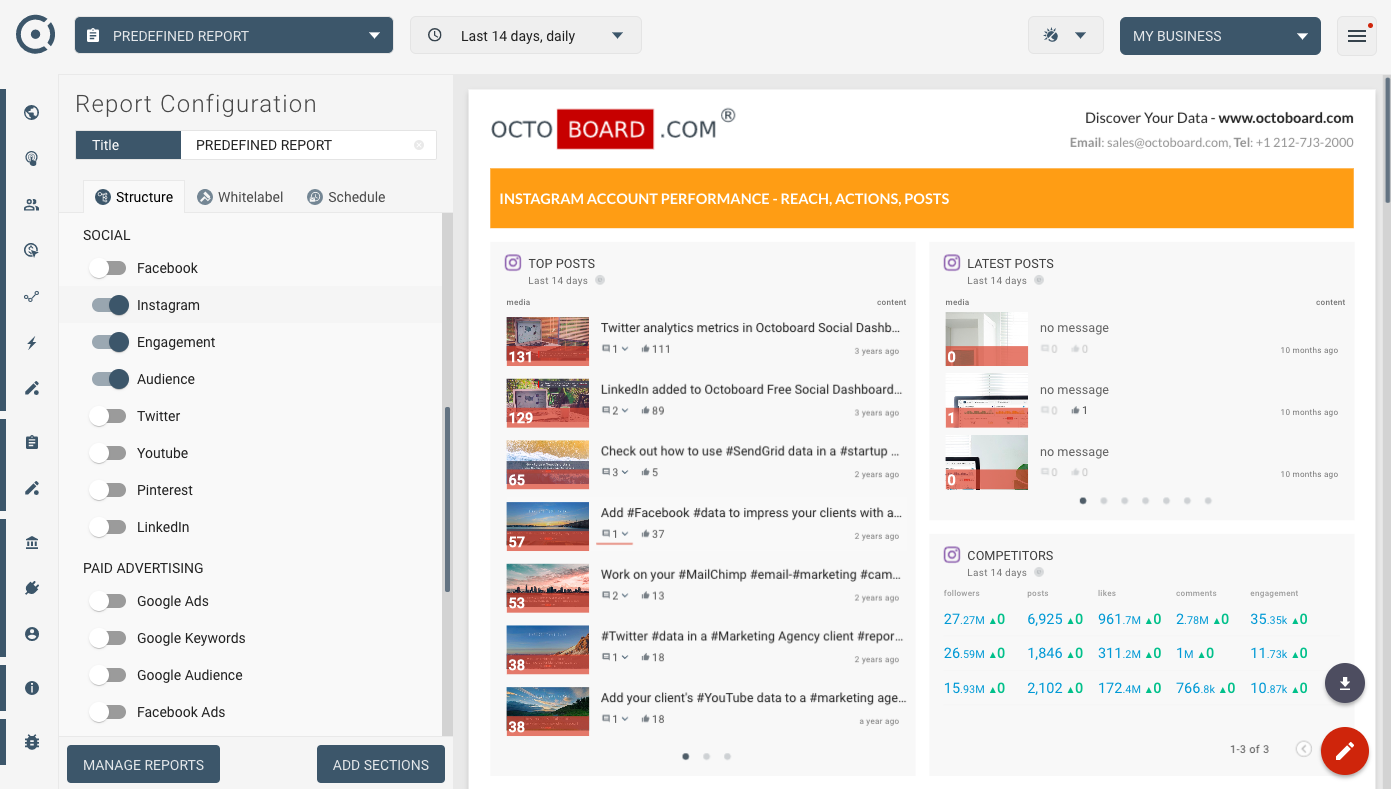
Instagram Performance (Report)
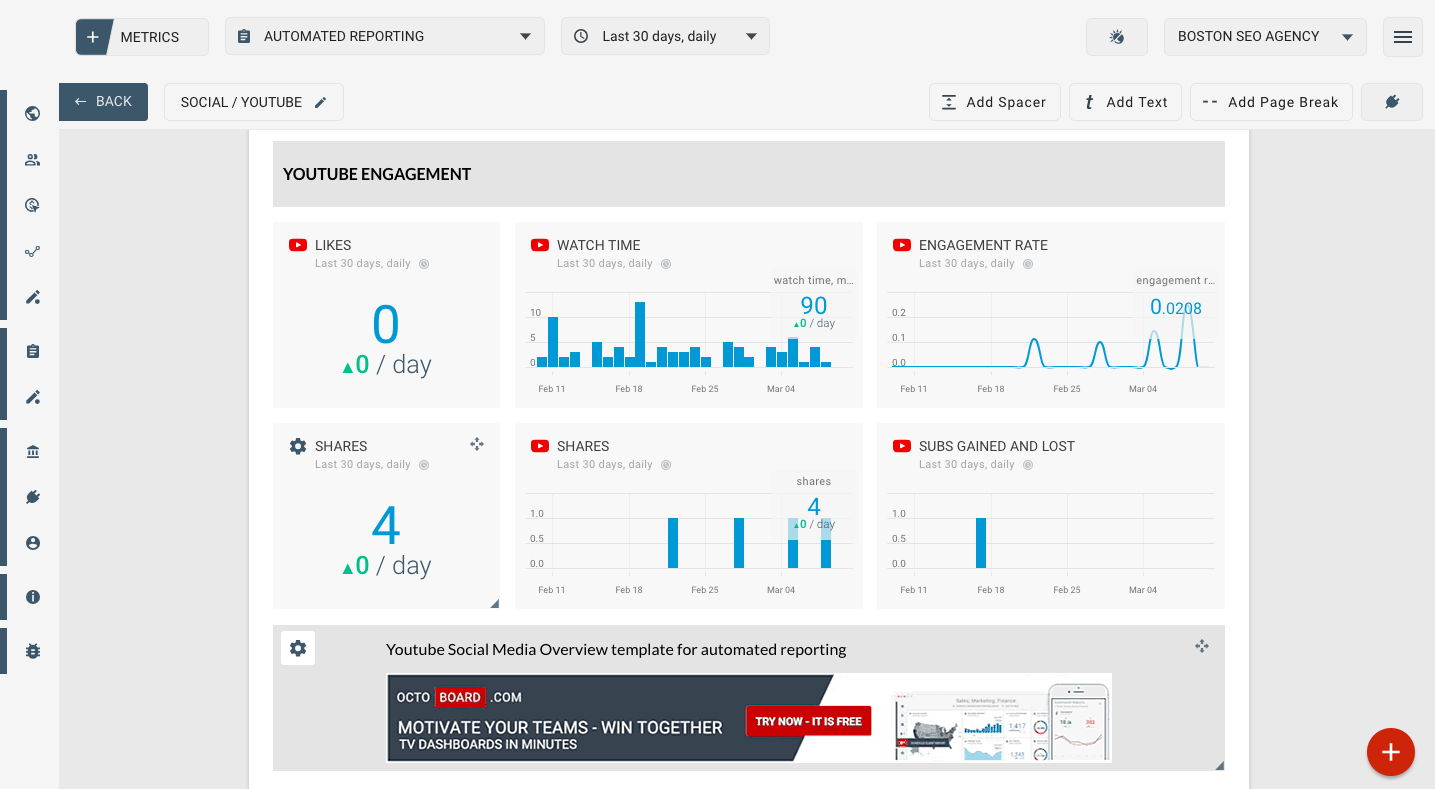
Youtube Engagement (Report)
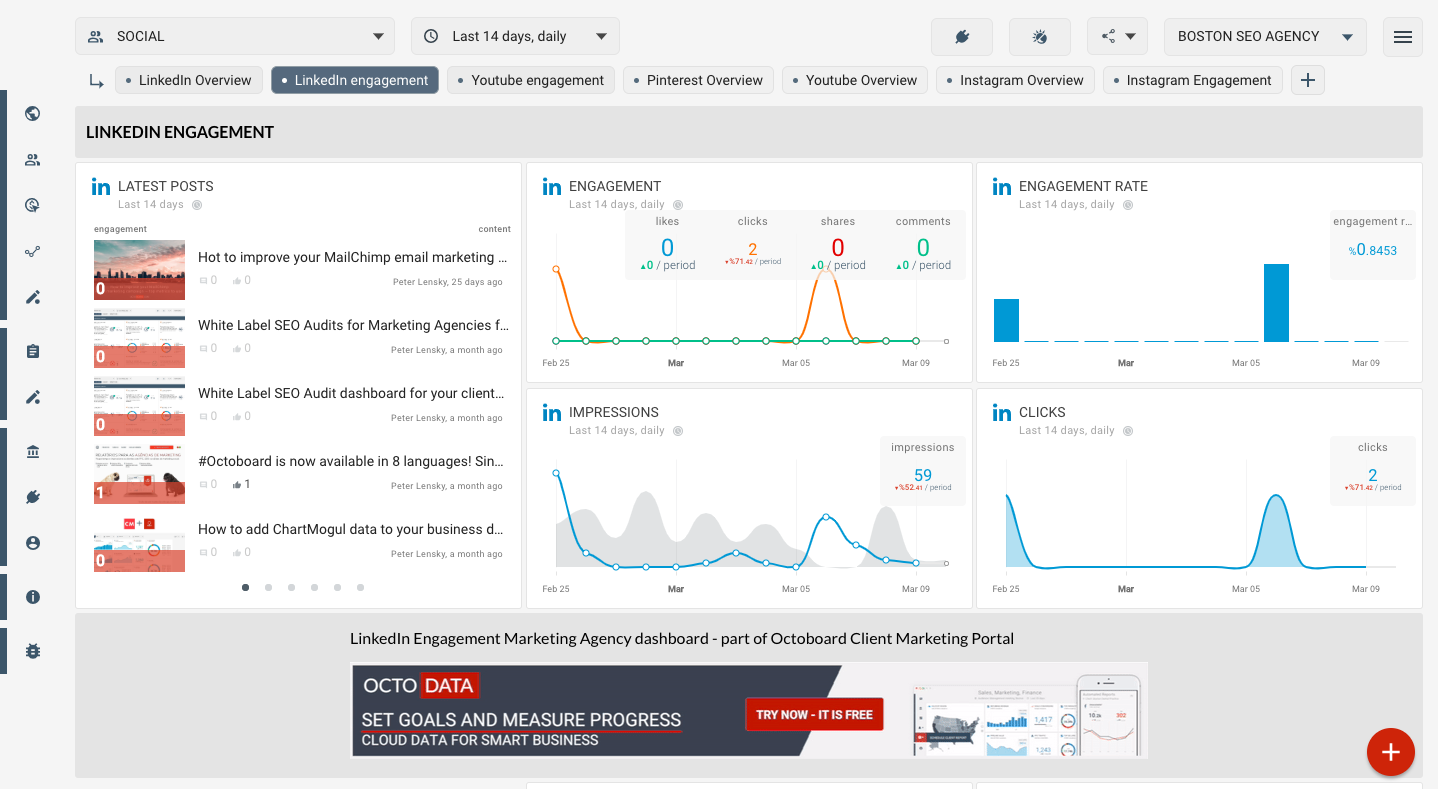
LinkedIn Engagement
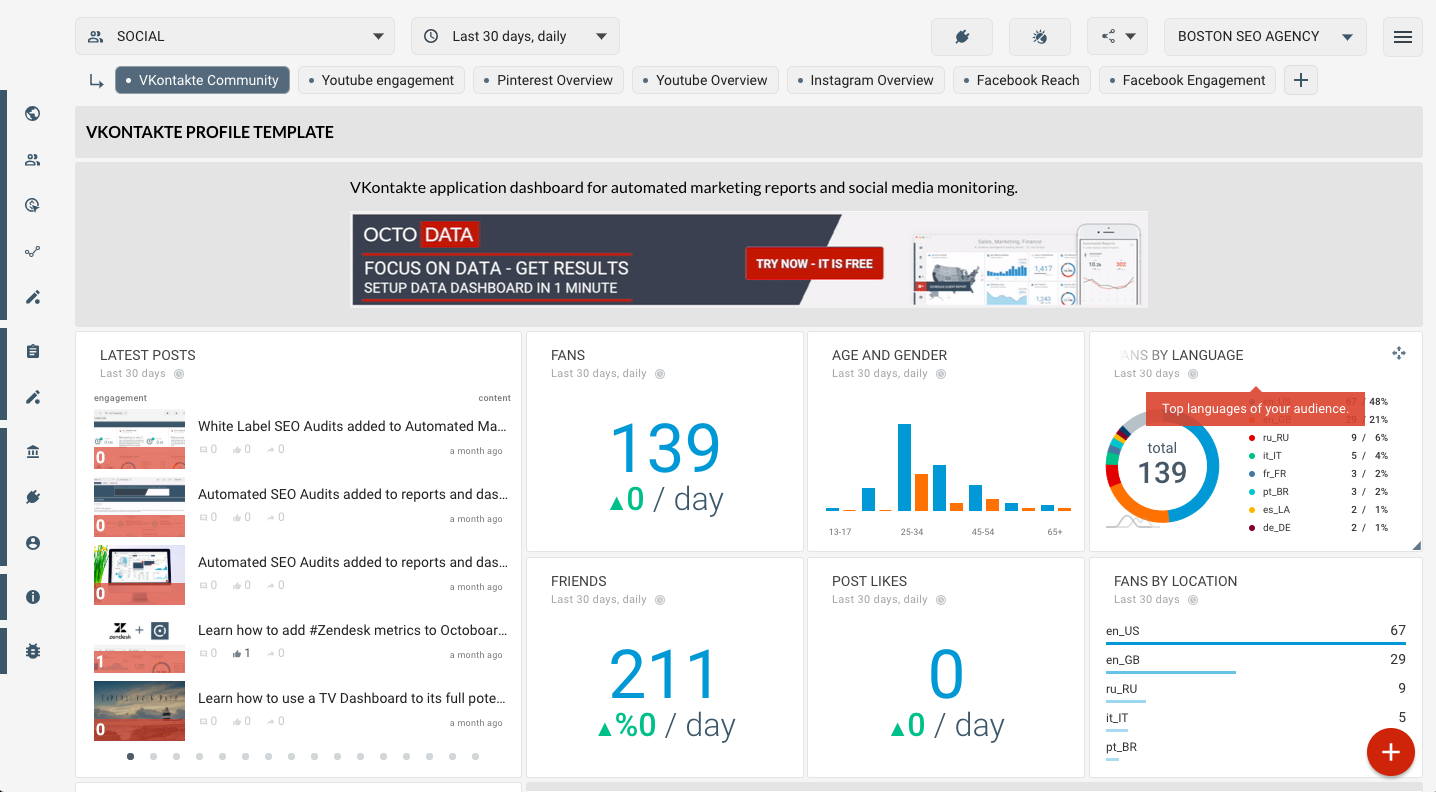
VKontakte Profile
Facebook Social Media Report template (Report)