LinkedIn Social Media Report Template: Automating Metrics Overview with Octoboard
Looking to optimize your LinkedIn social media reports? This blog post explores the significance of LinkedIn metrics, the automation of social media reports, and how Octoboard revolutionizes this arena.

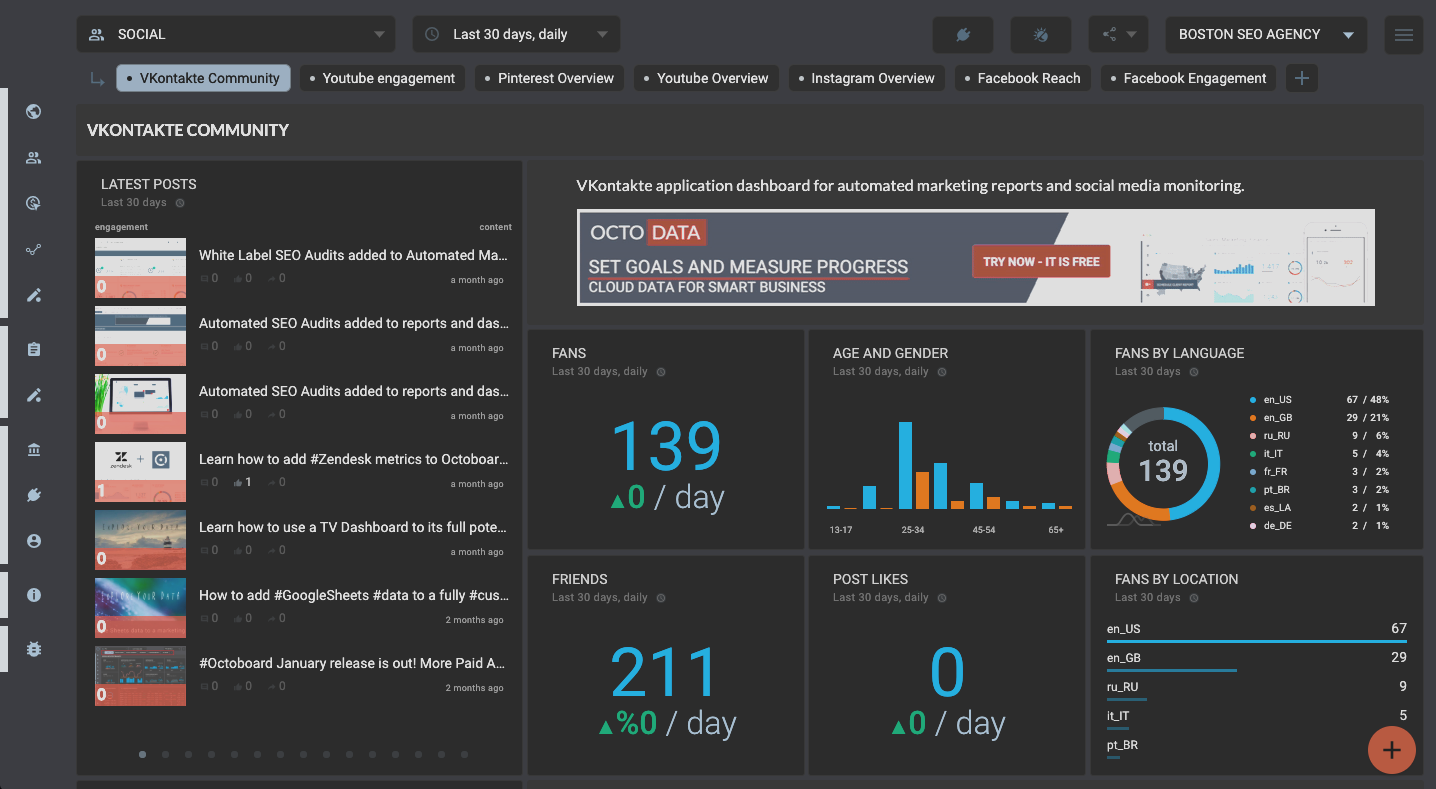
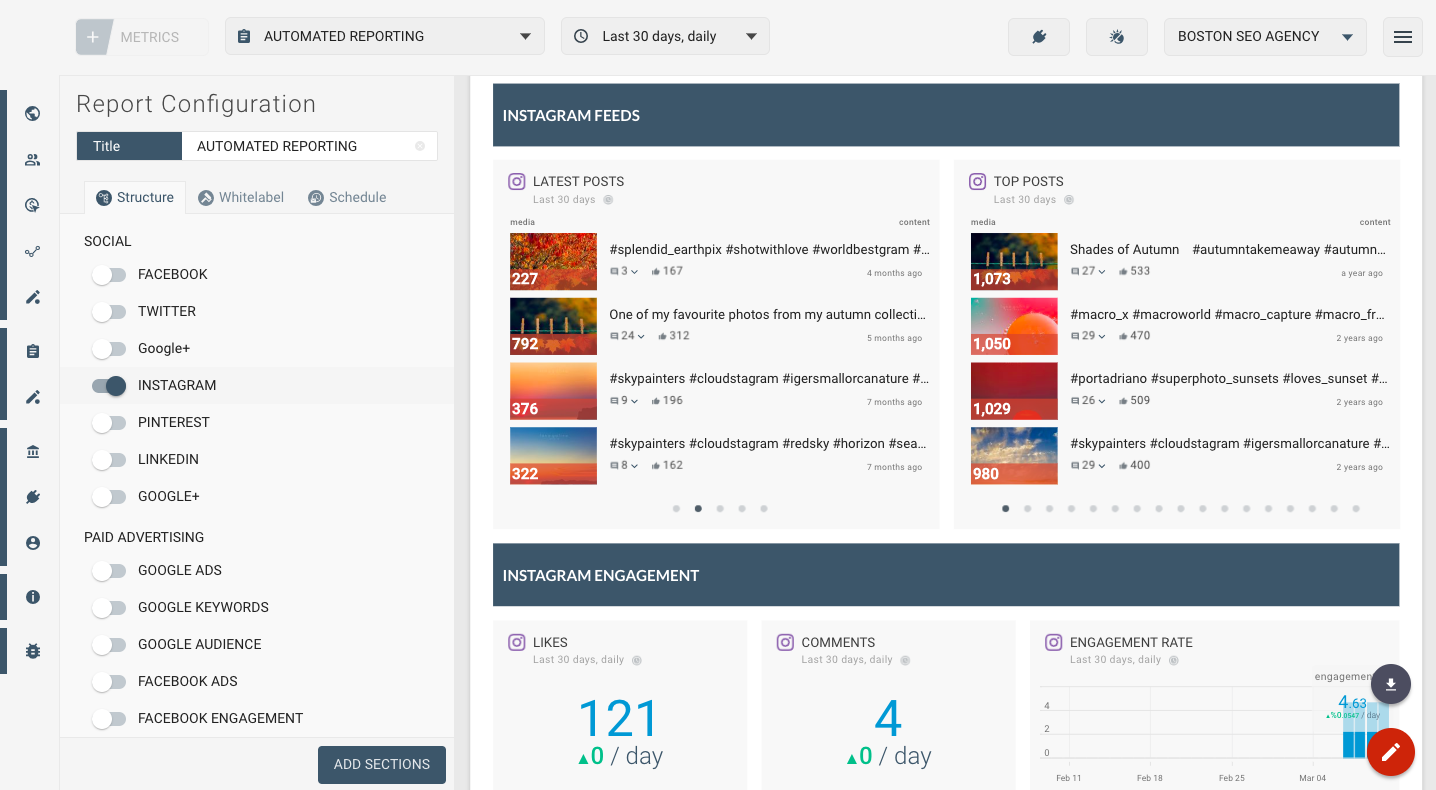
LINKEDIN SOCIAL MEDIA REPORT TEMPLATE
LinkedIn Social Media Dashboard for Marketing Agencies
Automated Social Media Report: LinkedIn Metrics Overview
In the ever-evolving world of digital marketing, staying ahead of the curve is not just beneficial; it's essential. As social media platforms continue to dominate the landscape of digital interaction, LinkedIn has emerged as a critical platform for B2B marketers and businesses aiming to establish their presence, engage with their audience, and showcase their brand's value. Leveraging LinkedIn data through automated reporting tools like Octoboard not only streamlines the process of social media analytics but also enhances the strategic decision-making process. This blog post dives into the significance of LinkedIn metrics, the automation of social media reports, and how platforms like Octoboard revolutionize this arena.
Understanding the Key LinkedIn Metrics for Social Media Analytics
LinkedIn provides a plethora of data metrics that are vital for businesses to monitor and analyze their social media performance. These metrics include:
- LinkedIn Recent Posts
- LinkedIn Clicks
- LinkedIn Likes
- LinkedIn Impressions
- LinkedIn Company Followers
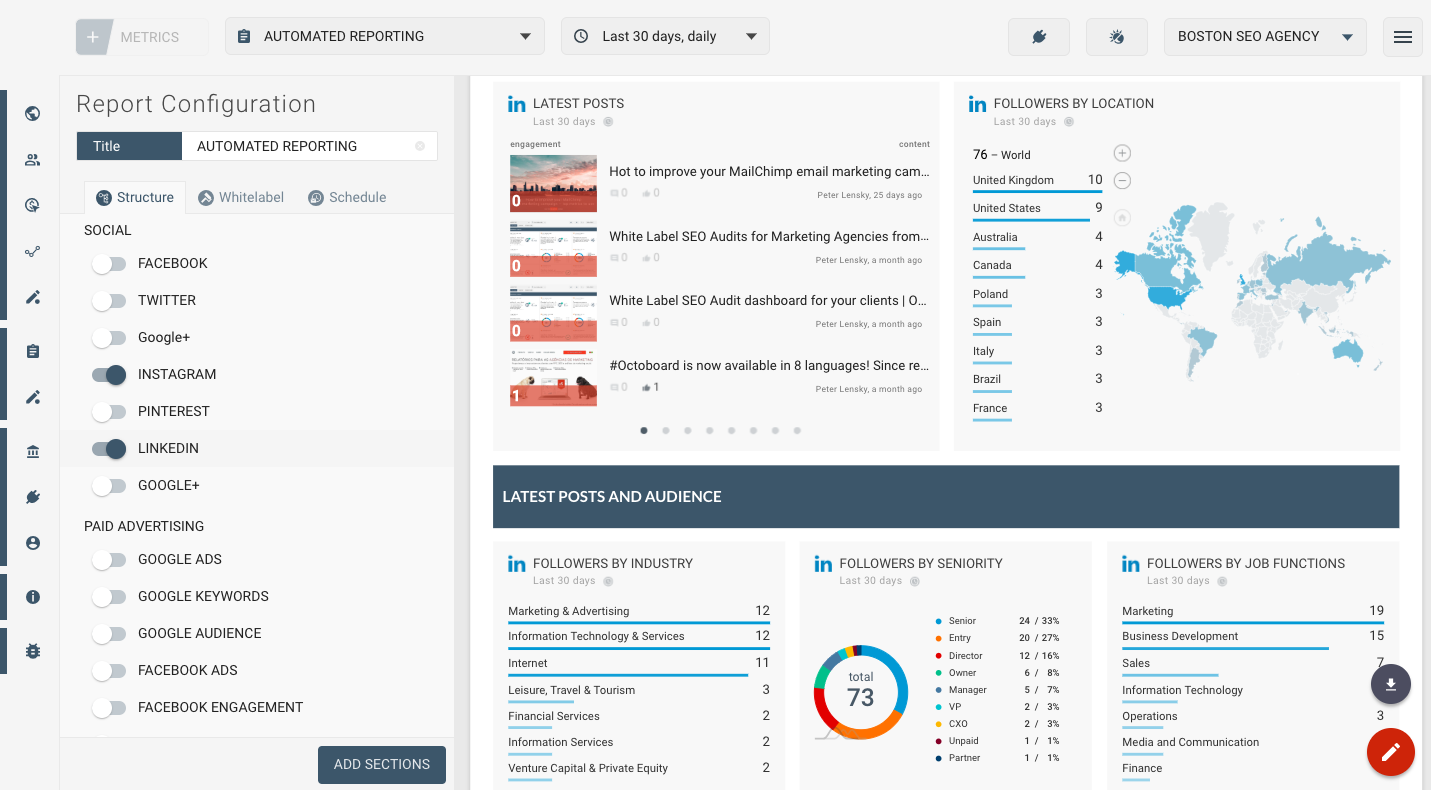
- LinkedIn Followers by Country Map
- LinkedIn Followers by Industry Bar
- LinkedIn Followers by Employee Seniorities Bar
- LinkedIn Followers by Job Functions Bar
Each of these metrics offers a unique insight into how a company's content is performing on LinkedIn, how engaging it is to the audience, and what kind of demographic is most interested in the content. For instance, tracking recent posts, clicks, likes, and impressions can help marketing teams gauge content performance and audience engagement levels. Meanwhile, analyzing company followers, including their country, industry, seniority, and job function, provides a deeper understanding of the audience demographic, enabling businesses to tailor their content strategy accordingly.
The Significance of Automating LinkedIn Reports with Octoboard
In the fast-paced digital marketing environment, efficiency and effectiveness are key. Manual data collection and report generation are not only time-consuming but also prone to errors. This is where automation comes into play. Using a platform like Octoboard for marketing analytics can save marketing teams hundreds of hours by automating social media report generation.
Automating LinkedIn reports and sending them out monthly or weekly to teams or management helps provide visibility of the social media efforts. It ensures that all stakeholders are on the same page regarding the performance and impact of LinkedIn marketing strategies. This visibility is crucial for continuously improving strategies and achieving better results over time.
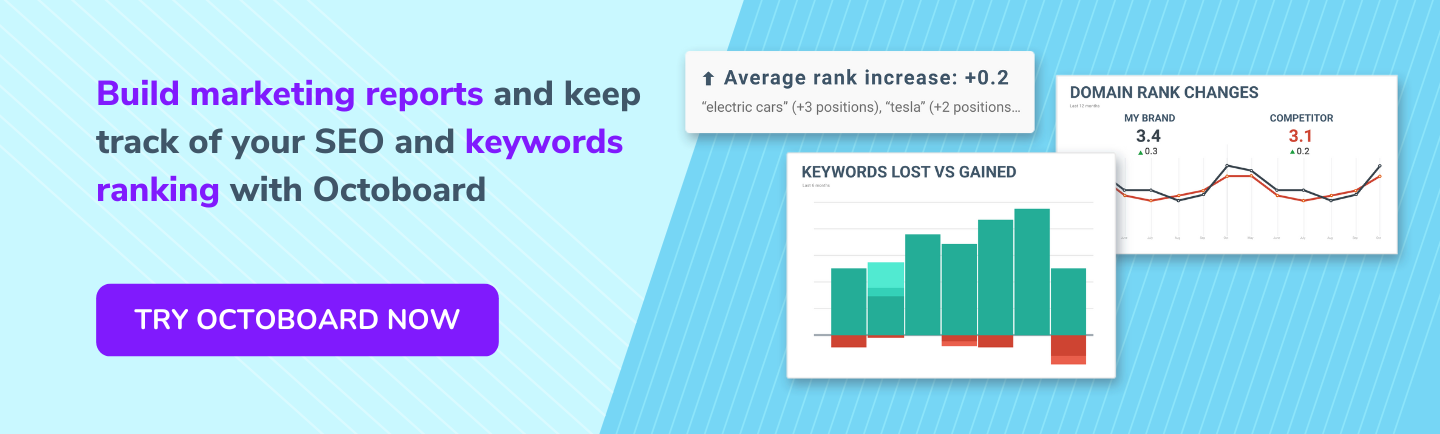
The Importance of Content for Higher Ranking on GA4 and Social Media Progress Monitoring
Creating compelling and relevant content is critical for higher ranking on Google Analytics 4 (GA4) and for successful social media engagement. Monitoring social media progress using Octoboard reports allows teams to understand which types of content resonate most with their audience, leading to better engagement, higher visibility, and improved SEO rankings. This insight is invaluable for refining content strategies and optimizing social media performance.
Bringing All Social Media Reporting in One Place
One of the significant advantages of using Octoboard is its ability to consolidate all social media reporting in one place. This centralized reporting mechanism is vital for marketing teams to have a holistic view of their social media efforts across platforms. It enables a comprehensive analysis of performance metrics, facilitating cross-platform strategy optimization and ensuring consistency in messaging and branding.
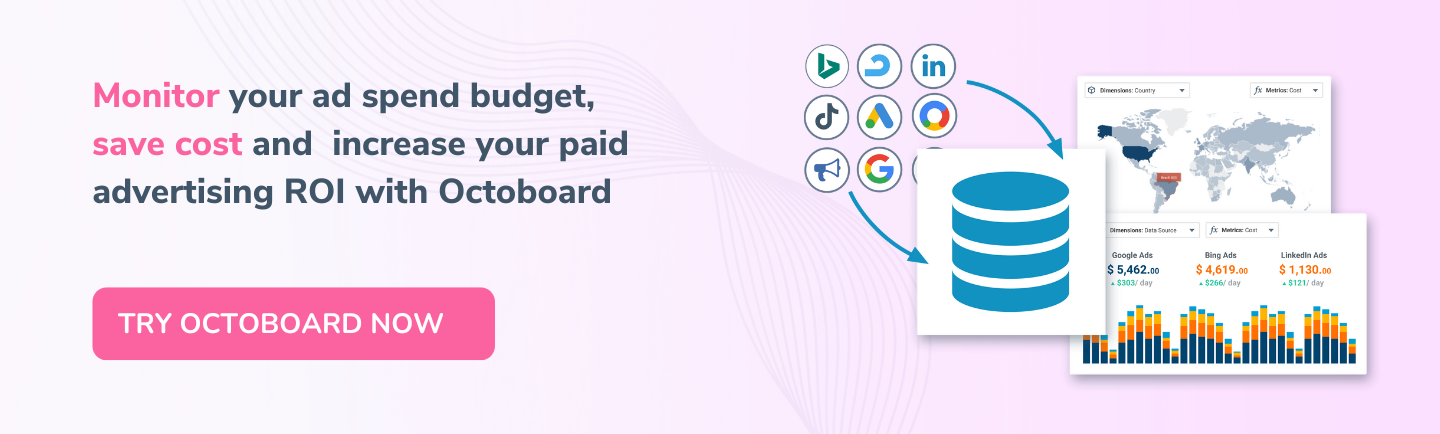
Advanced PPC Analytics for Marketing Teams
Octoboard's advanced PPC Analytics module offers marketing teams the flexibility to build new metrics, dimensions, and use advanced formulas to transform PPC data. This feature is invaluable for marketing agencies that manage campaigns across different PPC channels, locations, and currencies. It allows for the customization of reports to meet specific client needs and enhances the ability to make data-driven decisions for PPC strategy optimization.
Automating Data Detection of Trends with Octoboard
The ability to automatically detect trends and generate insights using LinkedIn data is a game-changer for marketing teams. Octoboard's Automated Data Insights feature enables marketing agencies and teams to stay on top of marketing progress by monitoring activity and identifying trends in real-time. This proactive approach ensures that strategies can be adjusted swiftly to leverage emerging opportunities or mitigate potential challenges, keeping marketing efforts aligned with objectives and market dynamics.
Google Sheets Data Export for Enhanced Data Visualization
The Google Sheets data export feature offered by Octoboard is another powerful tool for marketing teams. This feature allows for the easy export of LinkedIn data to Google Sheets documents, facilitating custom data analysis and visualization. Using Google Sheets for data visualization not only enhances the accessibility and understanding of data but also enables teams to share insights and collaborate more effectively, further streamlining the reporting and decision-making processes.
Conclusion
In today's digital age, the ability to quickly and accurately analyze social media performance is crucial for the success of any marketing strategy, particularly on platforms like LinkedIn. Automated reporting tools like Octoboard offer a comprehensive solution for marketing teams looking to save time, enhance strategic decision-making, and stay ahead in the competitive digital landscape. By leveraging the power of LinkedIn metrics and automating the reporting process, businesses can gain valuable insights into their social media performance, optimize their content strategies, and ultimately achieve their marketing objectives more effectively.
Octoboard customers who created this report also used the following data templates:

Facebook Reach
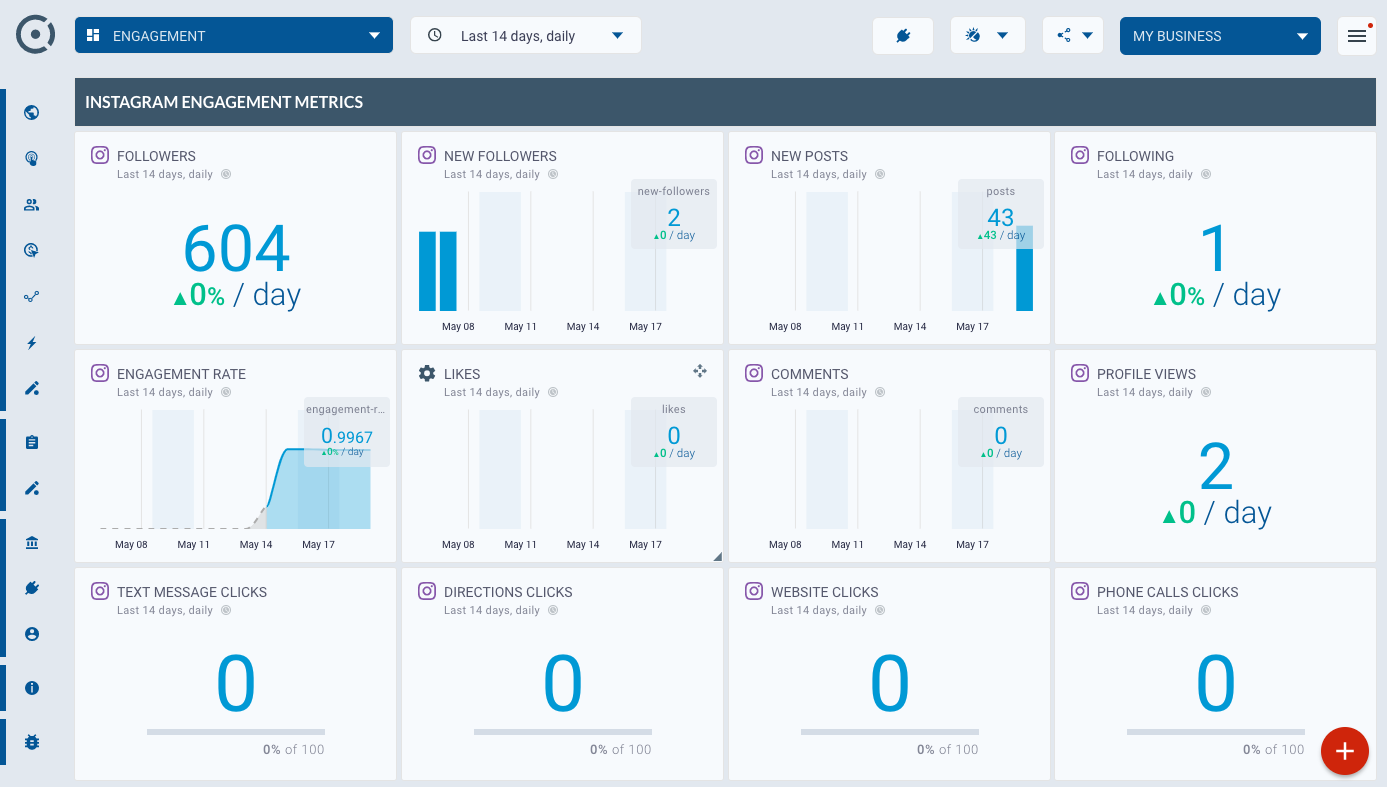
Instagram Engagement
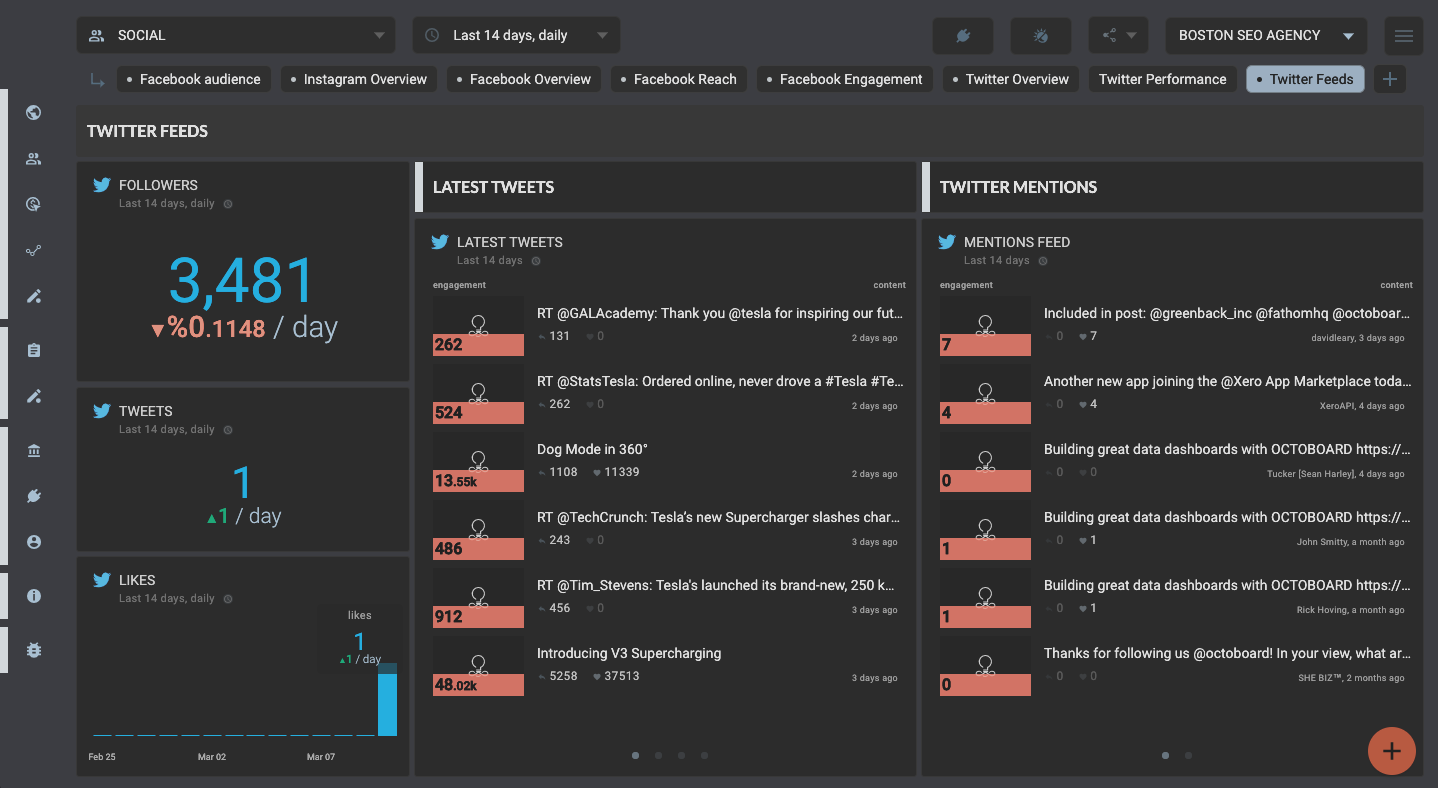
Twitter Feeds
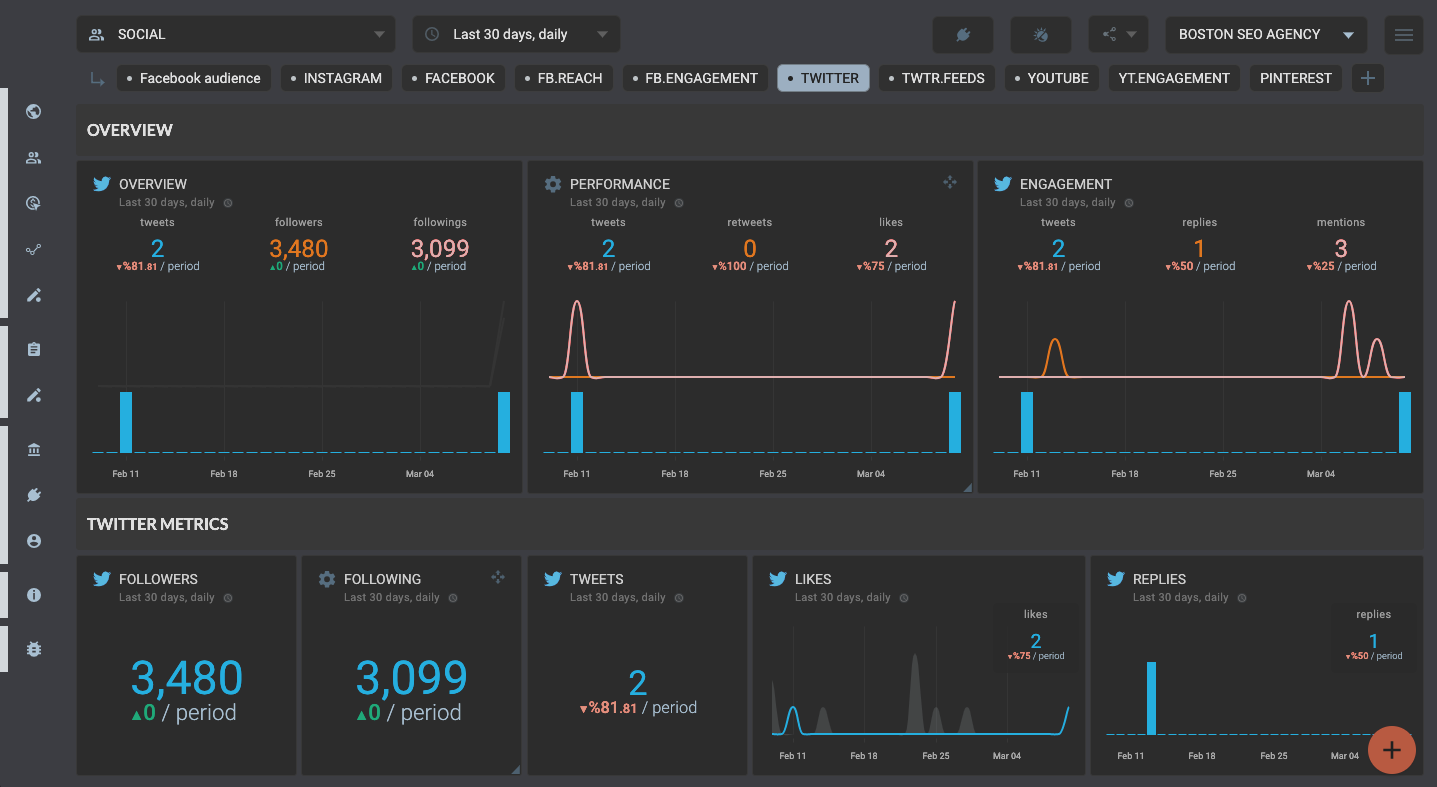
Twitter Metrics
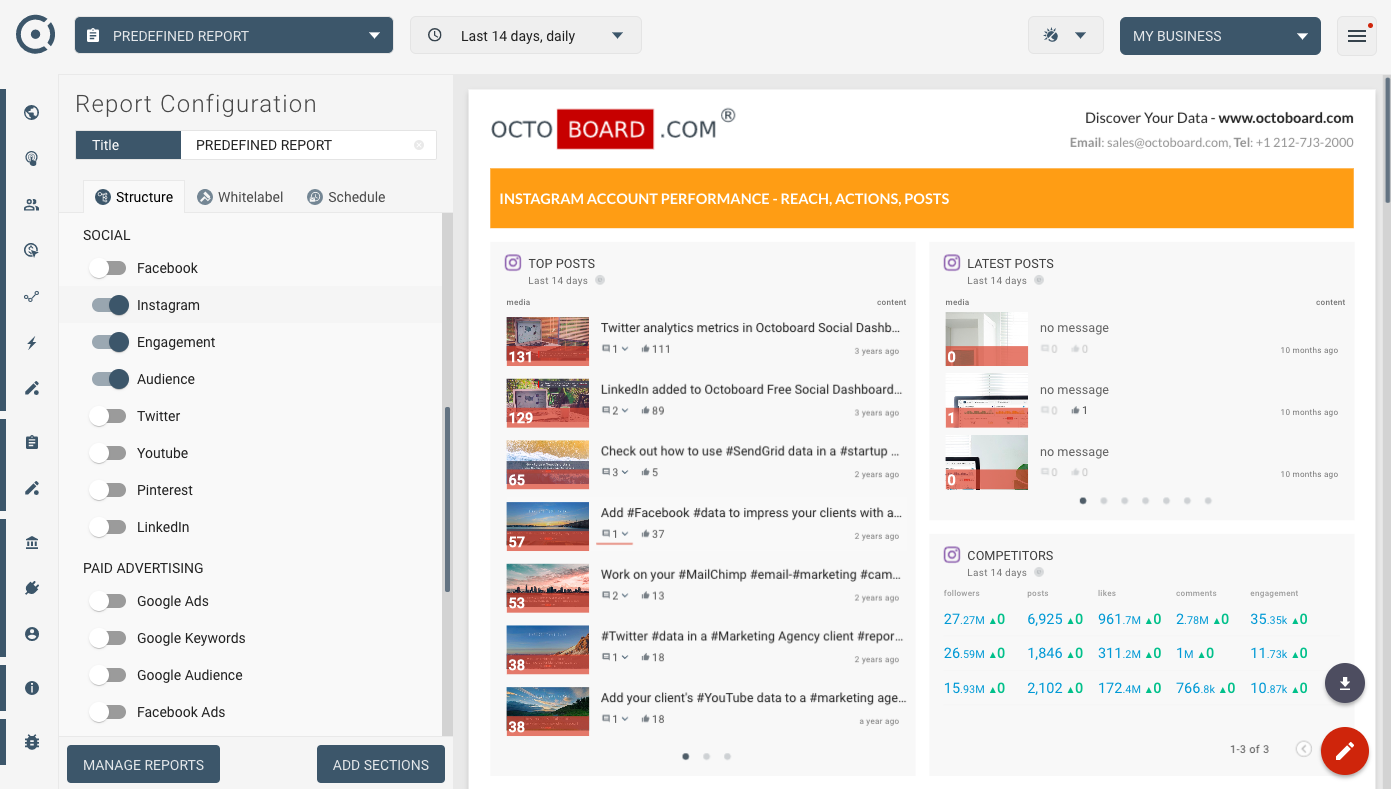
Instagram Performance (Report)
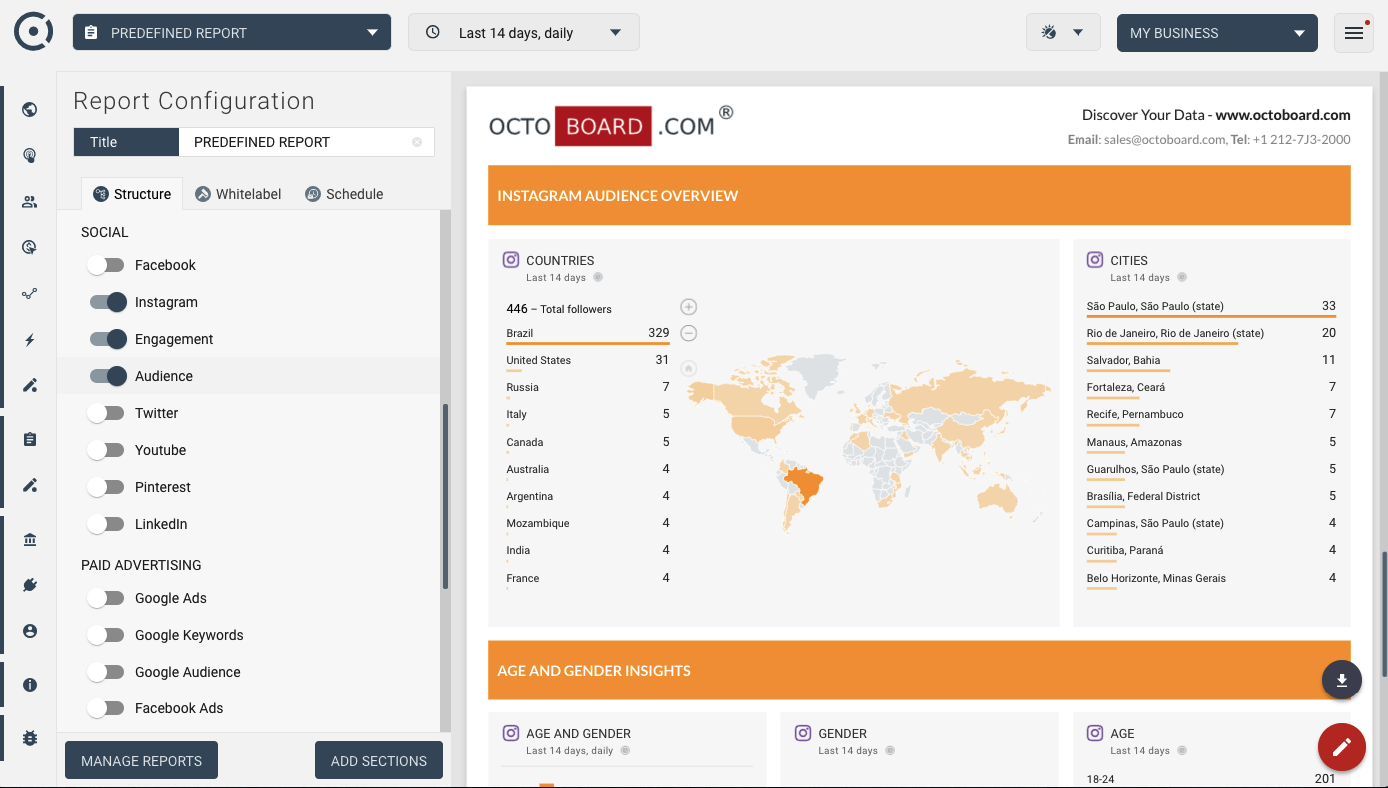
Instagram Audience (Report)
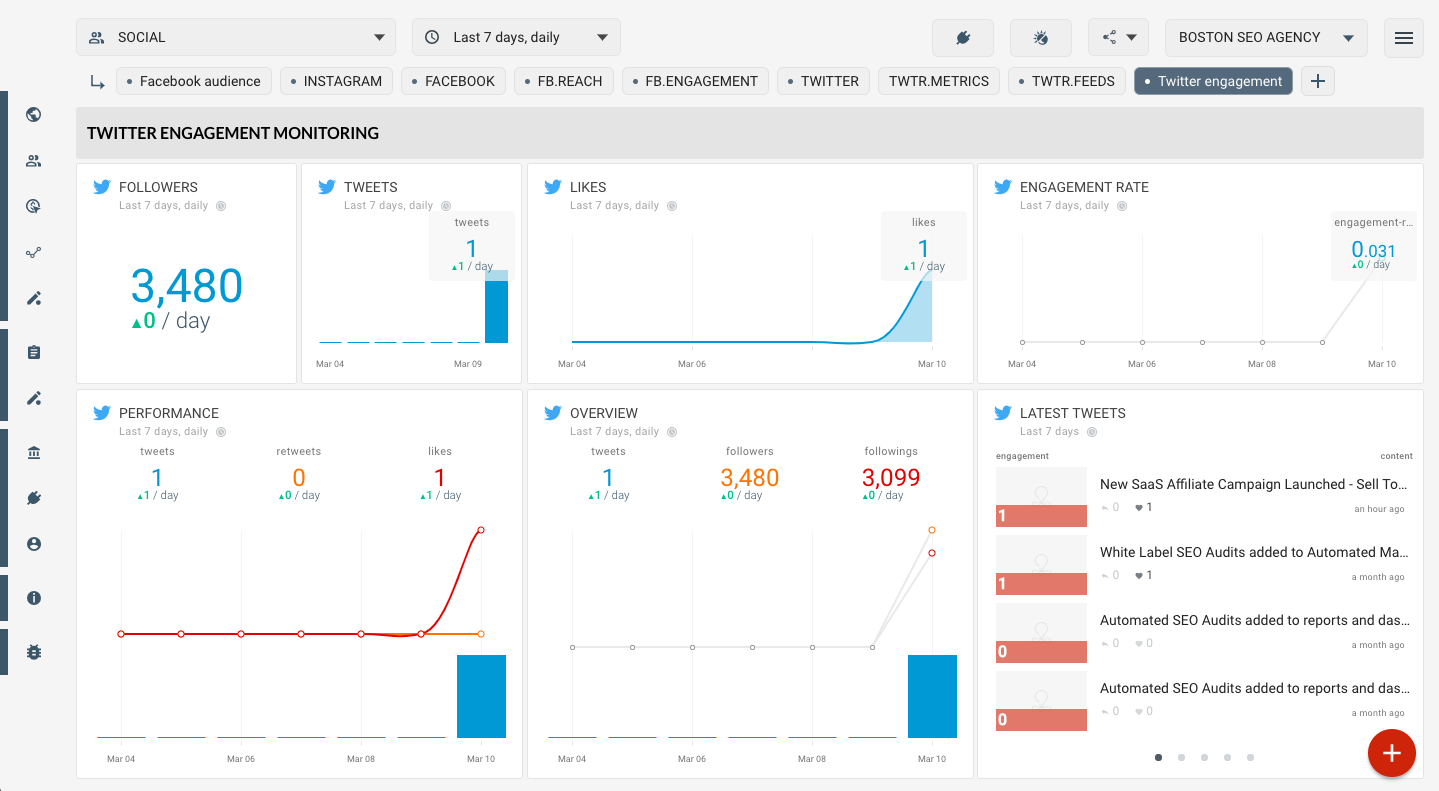
Twitter engagement
IG Overview - Report (Depreciated)
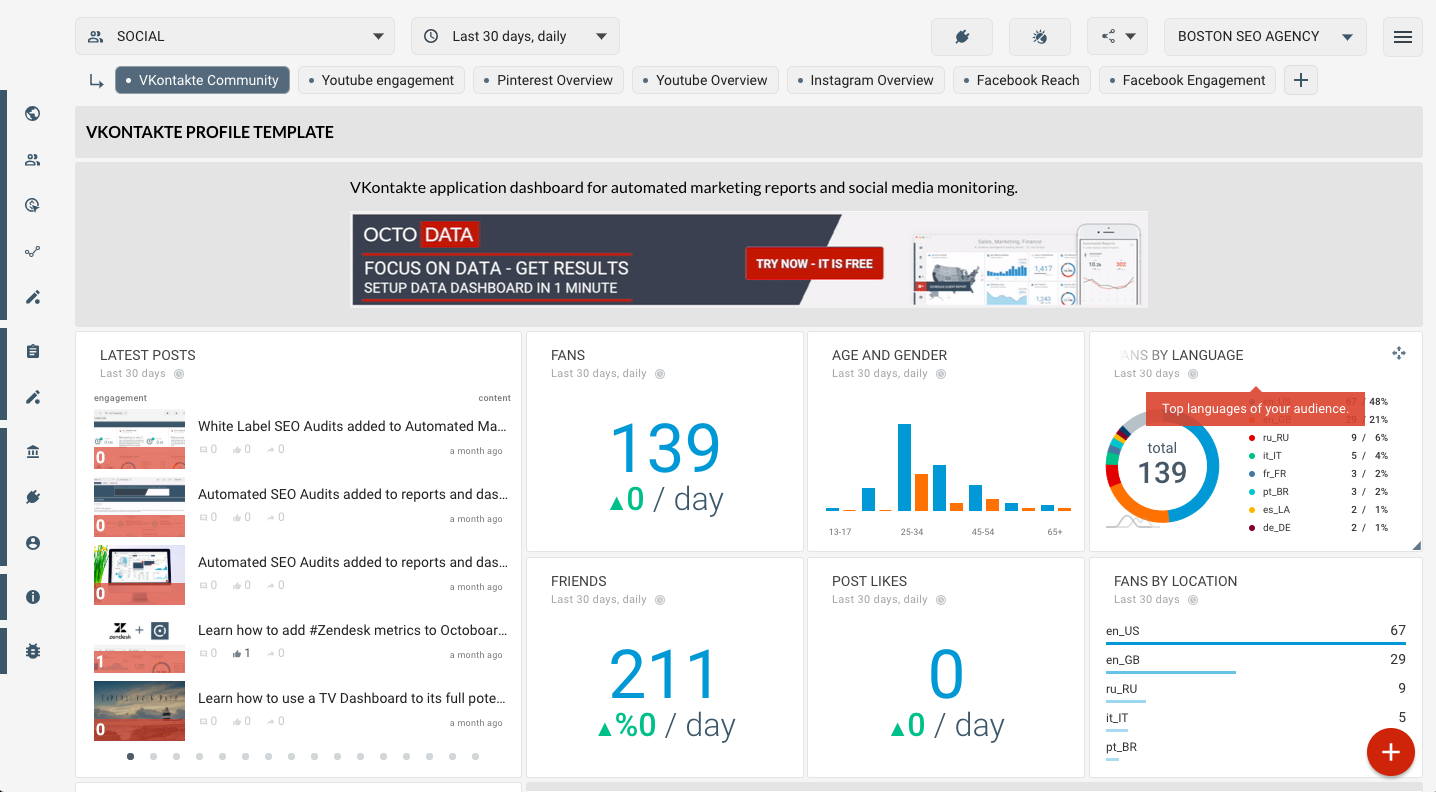
VKontakte Profile
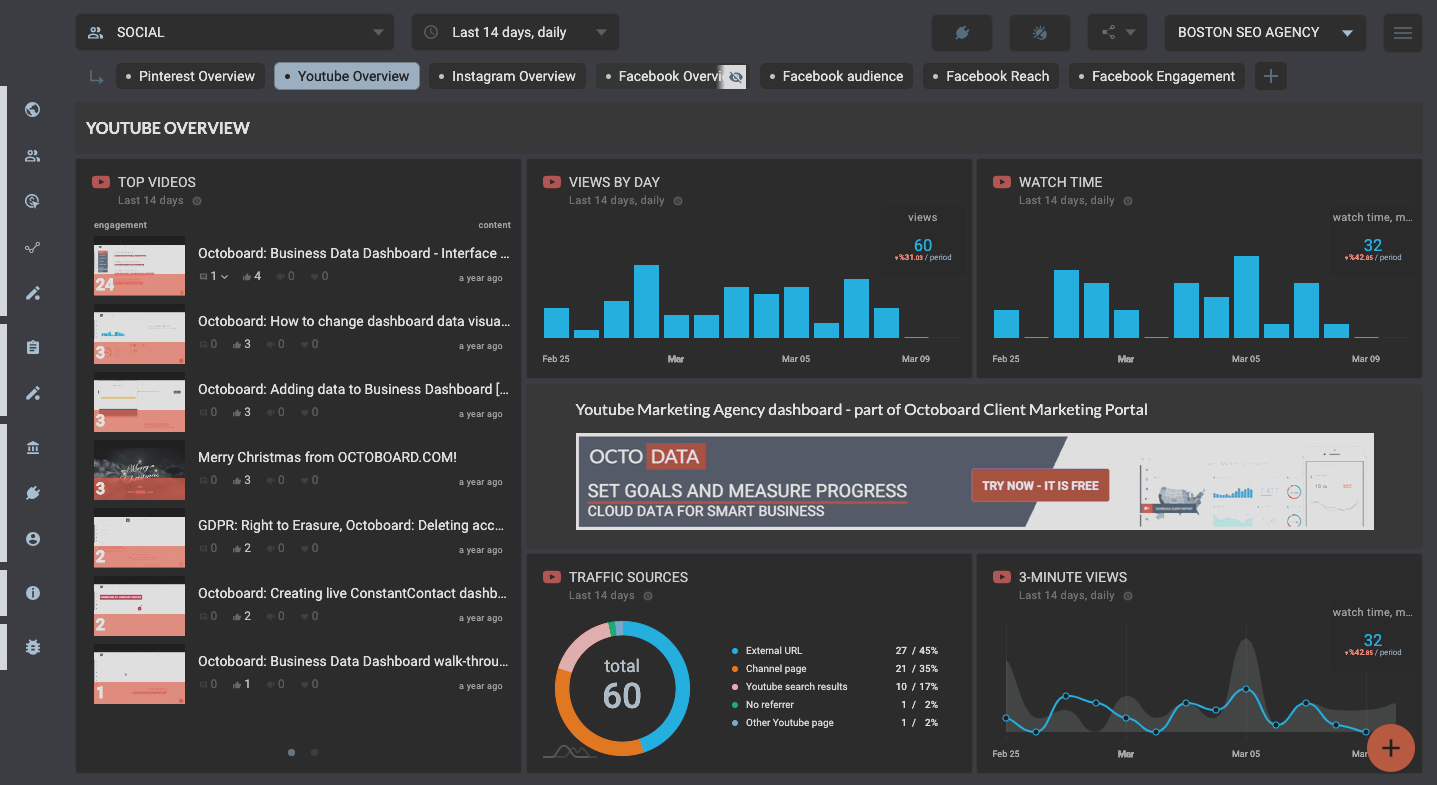
YouTube Overview
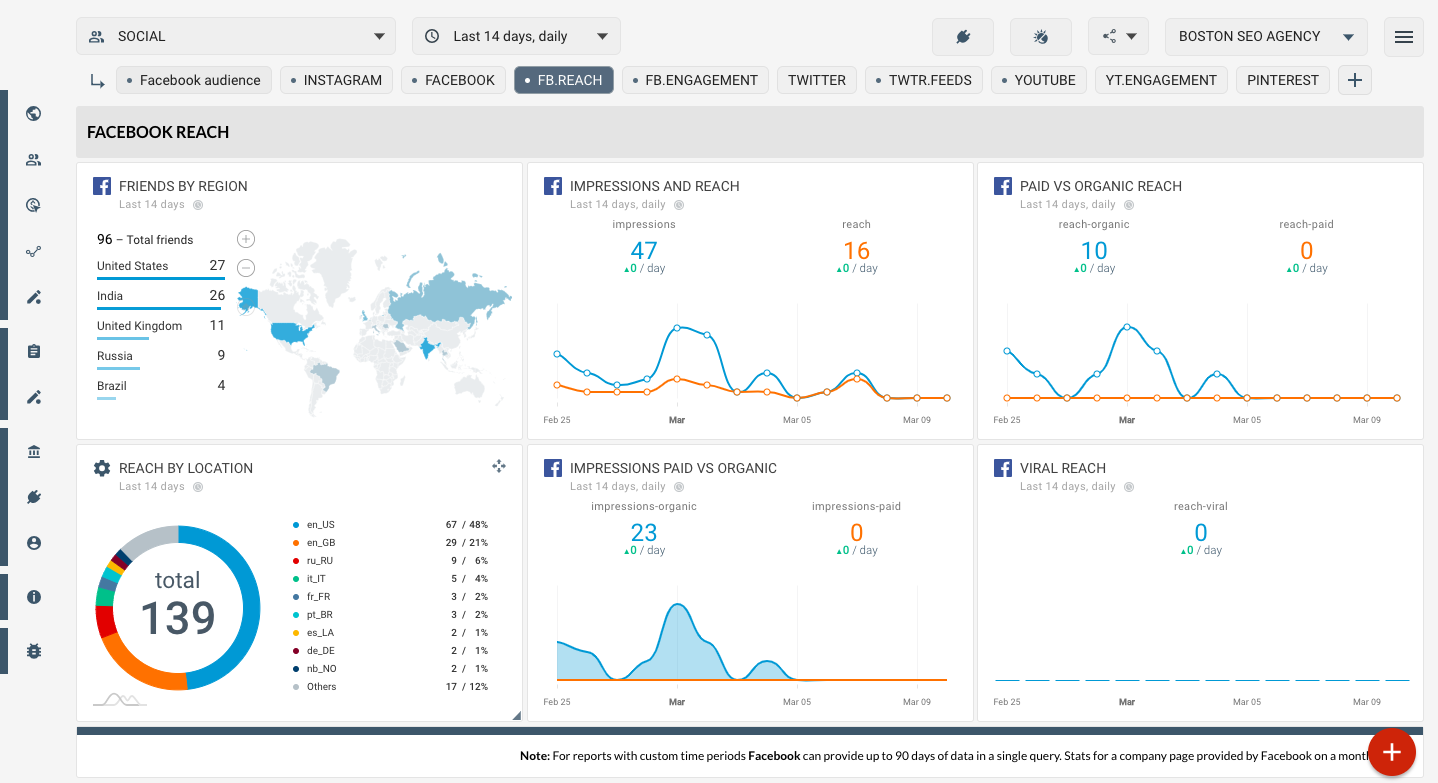
Facebook Social Media template - Reach