OCTOBOARD
English
PRICING
RESOURCES
LOGIN
TRIAL
TRIAL
English

Automated LinkedIn Social Media Reporting Tool for Marketing Teams and Clients

Build automated social media reports for your marketing teams and clients using LinkedIn data.

Automate LinkedIn reports and dashboards
Connect LinkedIn data and create automated reports and dashboards
Automated marketing reports
Business features include
 
Automated LinkedIn reporting
Automated reporting
Keyword rank tracker
Send data to Google Sheets
B2B lead generation
White label client portal
Send data to BigQuery
ChatGPT data insights
 
Automated marketing reports

Automate LinkedIn reports and dashboards

Connect LinkedIn data and create automated reports and dashboards

Multi-channel templates for LinkedIn

We created over 300 professional reports for you to use. Modify LinkedIn data reports or create new reports from scratch.

Automated marketing reports
 
Seo client reporting templates for agencies

Build LinkedIn reports quickly — Use our templates

No need to study all LinkedIn metrics or build reports from scratch. We have created over 350 templates for your dashboards and reports for you to choose from.
You can also create custom LinkedIn reports or modify any of the existing templates.

Seo client reporting templates for agencies
 
Octoboard business cloud data dashboards for churn reduction

Showcase your LinkedIn data

Show how hard you work for your clients. Create LinkedIn graphs and metrics that demonstrate positive historical changes and results.

Compare historical LinkedIn KPI changes and prove ROI to any business with regular and automated reporting.

Octoboard business cloud data dashboards for churn reduction
 
White label client portal

Enable white label client portal

Create and host white label client portal on your website using LinkedIn data. Use our library of templates, place your logo and send automated reports in seconds.

Share data view links

Create public and private LinkedIn dashboards and reports. Embed data views into any page of your website. Setup is very easy and does not require IT support.

White label client portal
 
Automated cloud data insights

Use OpenAI and ChatGPT to indentify LinkedIn data trends

Octoboard will constantly monitor LinkedIn data changes for you. We use ChatGPT and OpenAI to identify LinkedIn trends and send regular updates.

Connect once and enable our AI engine

We employ our own machine learning algorithms to automatically discover LinkedIn trends that you may miss. Connect to your LinkedIn data and receive insights in your Email box.

Automated cloud data insights

LINKEDIN REPORTING

LinkedIn user engagement, popularity and followers analytics for personal and company LinkedIn accounts.

Octoboard data dashboard: Linkedin application dashboard

In today's digital age, online marketing is not just about having an active presence on platforms but about making informed decisions based on accurate and timely data. This is especially true for platforms like LinkedIn, which offer a goldmine of professional networking opportunities. With countless metrics to track and an ever-evolving landscape, relying on manual processes or spreadsheets is no longer feasible. That's where the importance of a software platform or SaaS product like Octoboard comes into play.

The Rise of Automated Analytics Platforms

Automation has transformed the way businesses operate. For marketing teams and online businesses, automation in analytics reporting isn't just a convenience—it's a necessity. Tracking every LinkedIn metric manually is time-consuming, prone to human error, and inefficient. An automated data analytics platform such as Octoboard streamlines this process, offering actionable insights at your fingertips.

Automate all your marketing reports and use our free Open AI connection to capture new data trends with Octoboard.


Delving into Key LinkedIn Metrics

To truly understand the need for such automation, let's explore the key LinkedIn metrics:

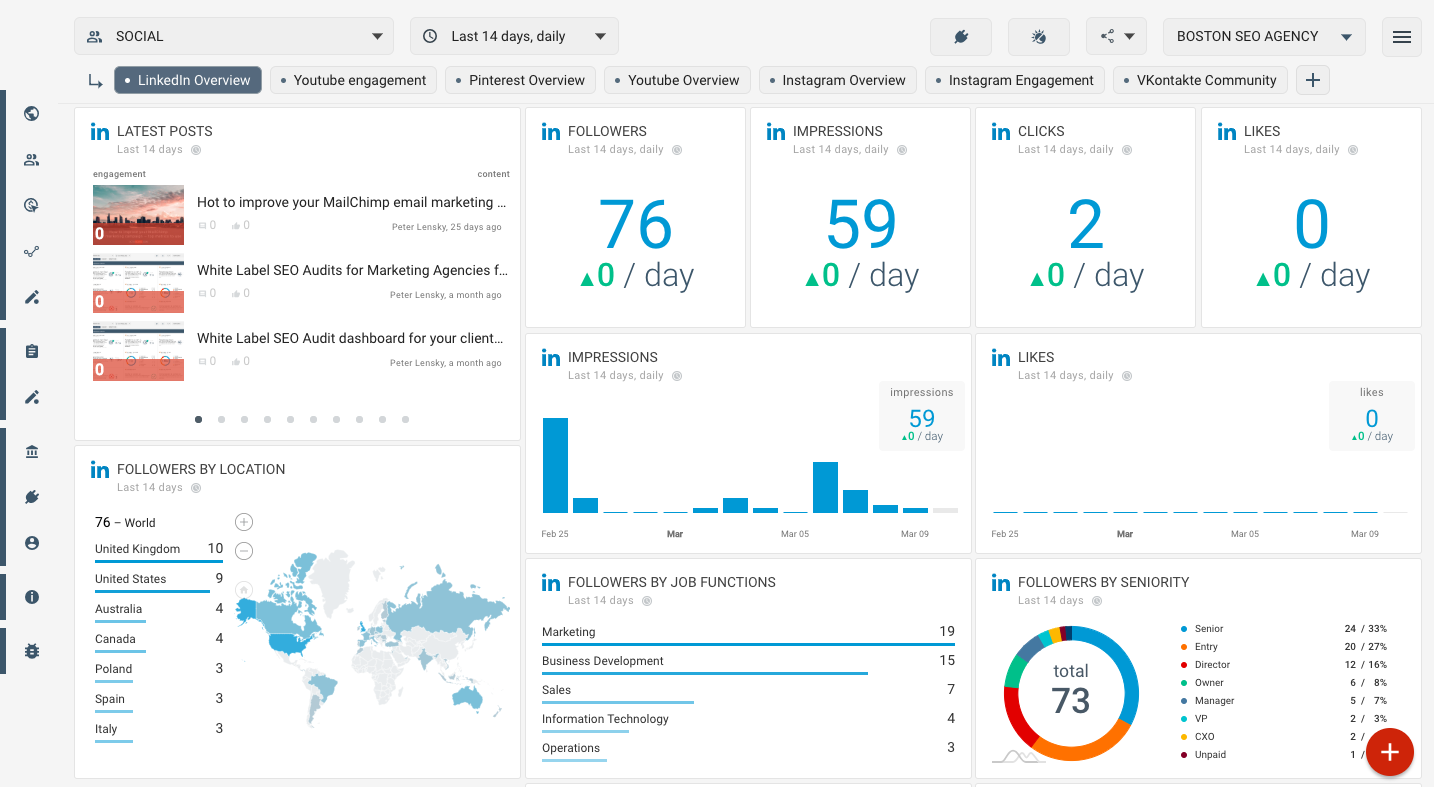
LATEST POSTS and TOP POSTS

These metrics provide a snapshot of recent content and the content that's performing best. Monitoring these helps businesses adapt their content strategy based on what resonates with their audience.

CONNECTIONS

An essential metric, connections represent the network's size. A growing number of connections can indicate expanding reach and networking potential.

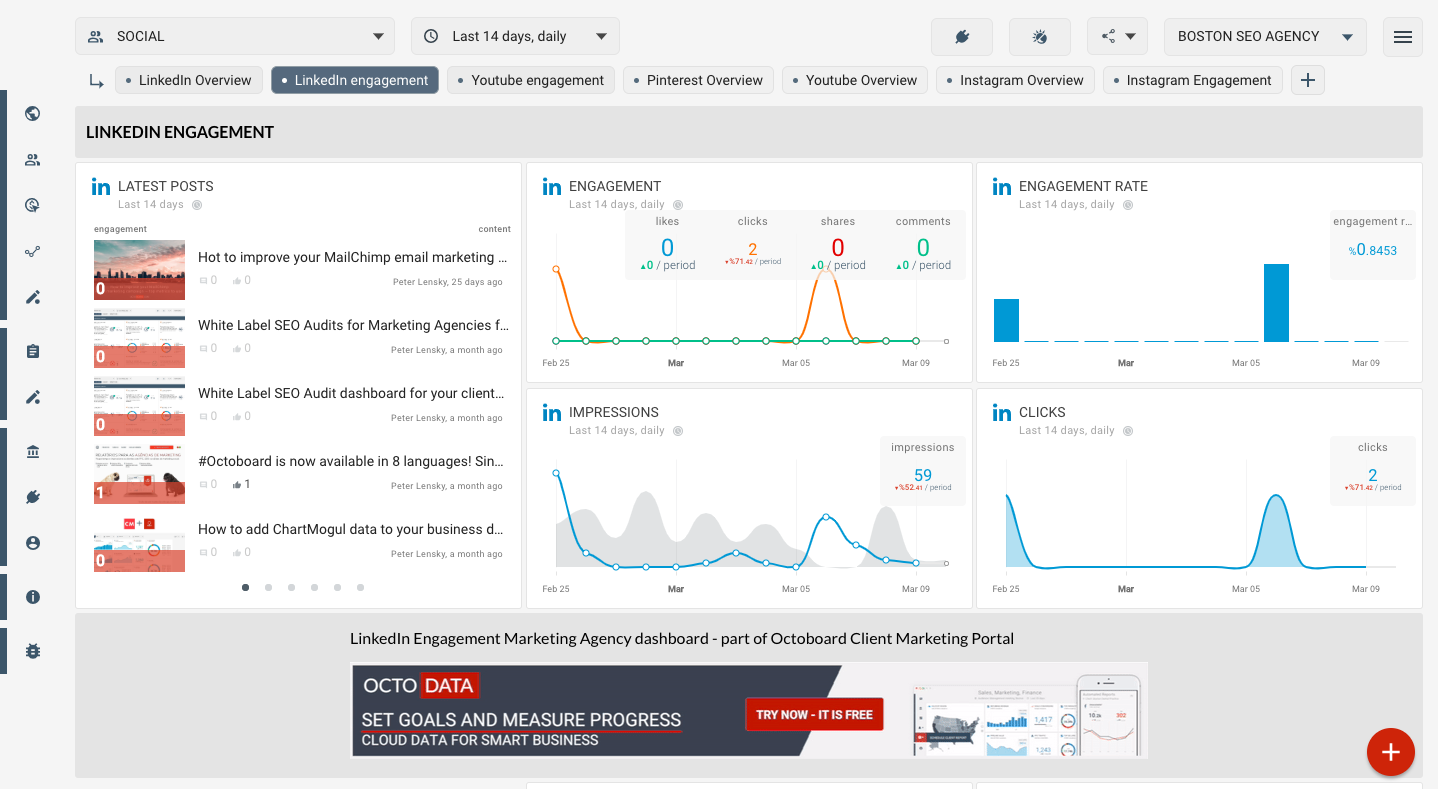
CLICKS, LIKES, COMMENTS, SHARES

These are engagement metrics. They show how your audience interacts with your content. High engagement often translates to increased brand visibility and trust.

IMPRESSIONS and UNIQUE IMPRESSIONS

Impressions measure how often your content is displayed. Unique Impressions, on the other hand, indicate the number of distinct users who saw the post. These metrics gauge content visibility.
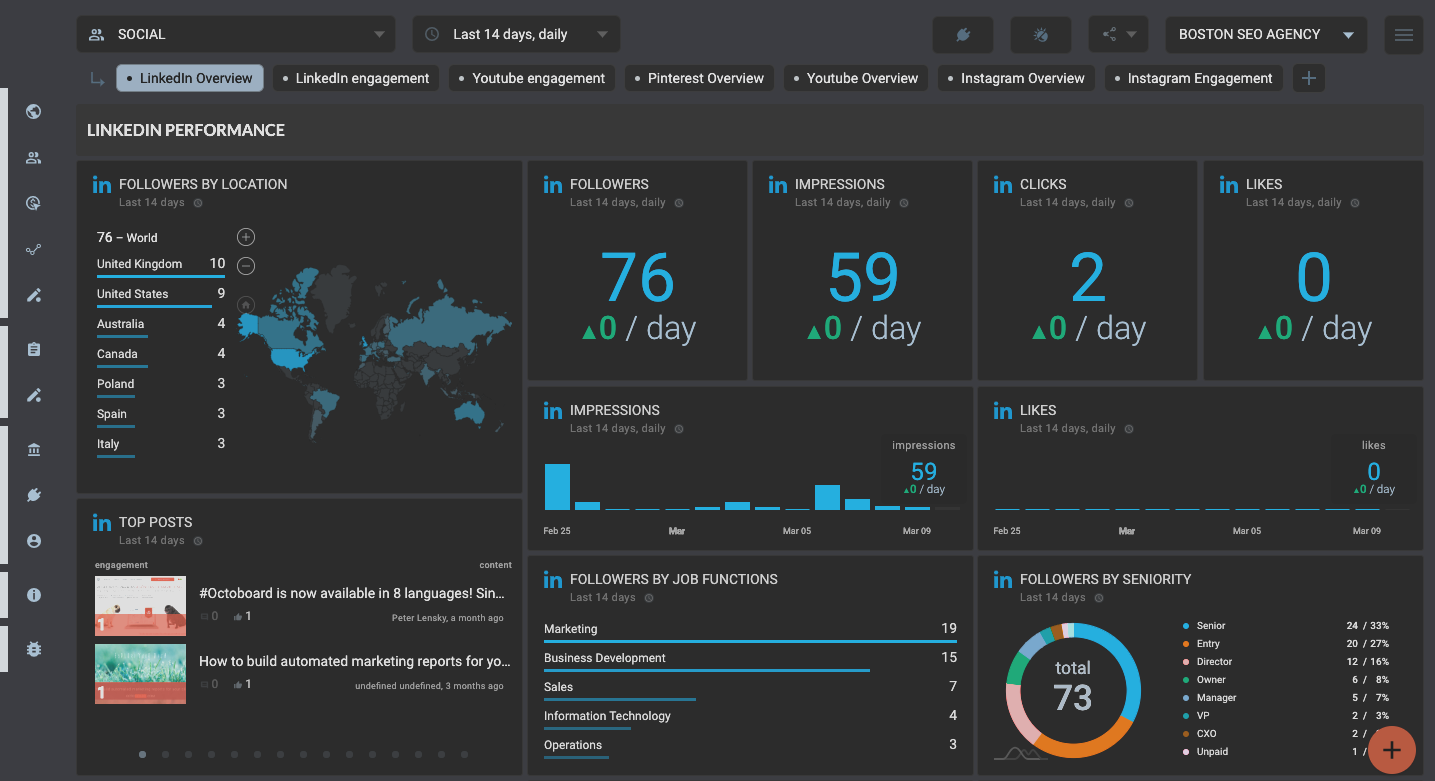
FOLLOWERS

This is a straightforward yet vital metric indicating the number of individuals who've opted to see your updates. Growth in followers is a positive sign of expanding brand awareness.

Create cross-channel PPC reports. Monitor your ad spend across all platforms with Octoboard.


ENGAGEMENT and ENGAGEMENT RATE

While engagement accounts for interactions with the content, the engagement rate provides a percentage of those engaged out of the total who viewed the content. It's an indicator of content relevance and quality.

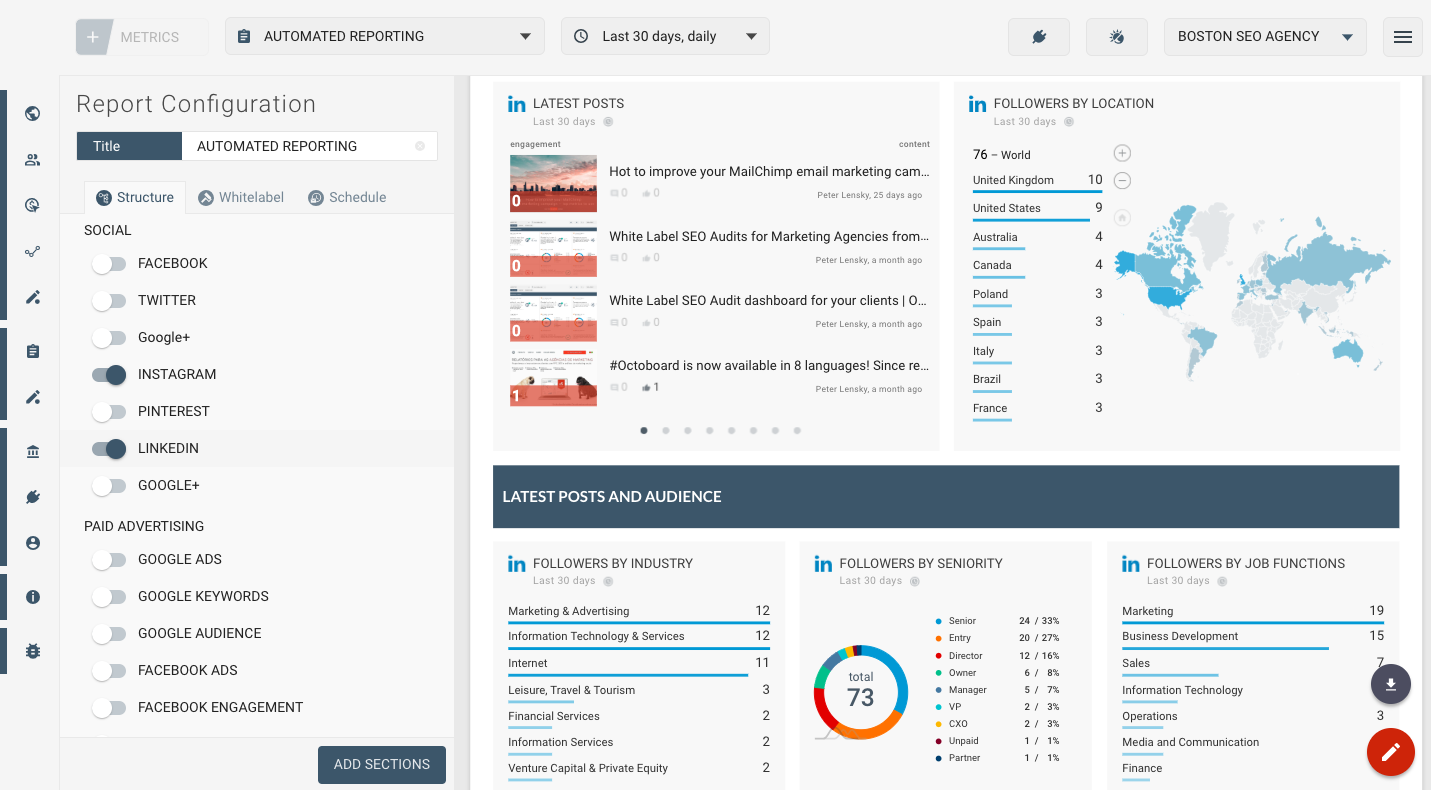
FOLLOWERS BY DEMOGRAPHIC Metrics

The breakdown of followers by Company Size, Location, Job Functions, Industry, and Seniority offers granular insights. Understanding your audience demographics is crucial for crafting tailored content and campaigns.

Why These Metrics Matter for Your Business

Each of these metrics offers a piece of the bigger picture. When integrated, they provide a comprehensive view of your LinkedIn strategy's performance. For instance, if you notice a high number of impressions but a low engagement rate, it's a cue to re-evaluate your content.

Marketing teams require these insights to adapt and evolve. By understanding what works and what doesn't, businesses can allocate resources efficiently, maximize ROI, and build stronger relationships with their audience.

Save time by automating your reports, grow revenue and retain customers with Octoboard.


Octoboard - Your Solution to LinkedIn Reporting

Octoboard offers a solution that's tailored for today's businesses. Instead of spending hours collating data, with Octoboard, you have all your vital metrics consolidated and visualized. This not only saves time but also ensures that decision-makers have the most accurate data at their disposal.

Tips
To start with LinkedIn, consider selecting one of the following metric groups:

  • Posts popularity
  • Content reach
  • User engagement metrics
  • LinkedIn followers analysis


Notes
Use your standard LinkedIn login to start collecting data. LinkedIn only reports data for Company pages (not for personal accounts). You have to be Company Page Administrator to view data. Please contact your Page Admin to request access. IMPORTANT: When you are adding a second LinkedIn account, cookies may create a problem. To work around the issue, make sure you have logged out of your LinkedIn account before adding second connection to Octoboard.

Automated data reports enabled by Octoboard software

Click for details...
OCTOBOARD dashboards, templates and reports gallery: Linkedin engagement template

LINKEDIN ENGAGEMENT

LinkedIn engagement metrics and user actions.
Click for details...
OCTOBOARD dashboards, templates and reports gallery: Linkedin template for online marketing dashboards

LINKEDIN SOCIAL MEDIA DASHBOARD TEMPLATE

LinkedIn Social Media dashboard template for Marketing Agencies
Click for details...
OCTOBOARD dashboards, templates and reports gallery: Linkedin marketing template for automated reporting

LINKEDIN SOCIAL MEDIA REPORT TEMPLATE

LinkedIn Social Media Dashboard for Marketing Agencies

LinkedIn metrics

Can I track my LinkedIn posts’ popularity and audience feedback in real-time?
It is important to know when your audience reads and reacts to your content. Engage with your readers when you have their attention. The more timely and responsive you are the higher will be overall engagement. For active social network users, it is important to be able to check user feedback without the need to log in and out of websites. Use Platform to watch engagement in popular social networks without the need to constantly switch between applications.

LATEST POSTS

Most recent company posts on your LinkedIn page sorted by date (latest at the top).
Description

We use Engagement to rank your Linkedin content. Latest Posts widget sorts posts by time of creation. Most recent posts are at the top.

Post Engagement is calculated using the sum of weighted user actions. We applied different weightings to actions. Because comments, for example, are more valuable than Likes.

Post Engagement = Likes x 1 + Comments x 20 + Shares x 30


Last 50 company updates (posts) will be used to calculate top posts and display post data.
USE THIS METRIC

TOP POSTS

Tops posts on your company LinkedIn page ranked by Engagement.
Description
Your posts are ranked by Engagement. Most engaging posts are shown at the top. If you want to sort your posts by date (latest posts at the top), select different sorting or pick Latest Posts widget.

Engagement is calculated using the sum of weighted user actions. We applied different weightings to actions. Because comments, for example, are more valuable than Likes.

Engagement = (Likes x 1 + Comments x 20)


USE THIS METRIC

CLICKS

Number of clicks on your LinkedIn company page.
USE THIS METRIC

LIKES

Likes received by your LinkedIn company page audience.
Description
Likes is the number of times people Like your videos. Likes are an indicator of how well your content resonates with people.
USE THIS METRIC

COMMENTS

Number of comments on your LinkedIn company page content.
Description
Comments is the number of comments people make on your videos. Comments can provide insight into how people feel about your content, products or brand overall.

A maximum of 100 comments will be returned for a given post (company update).
USE THIS METRIC

SHARES

Number of times your LinkedIn content has been shared.
Description
Shares is the number of times people share your content. Shares measure how much your content is amplified by those who see it.
USE THIS METRIC
How often is my content shown to LinkedIn members?
An indication of your content REACH in LinkedIn can be provided by FOLLOWERS and IMPRESSIONS count. Increase of these measures over time is always a good thing.

IMPRESSIONS

Your company update impressions over time.
USE THIS METRIC

UNIQUE IMPRESSIONS

Your company update unique impressions over time.
USE THIS METRIC

FOLLOWERS

View the total number of Company Followers.
USE THIS METRIC
Do my visitors like and interact (engage) with my LinkedIn content?
ENGAGEMENT shows how much people interact with your content. Factors that influence engagement include users’ replies and retweets. This is an important metric to keep an eye on because higher consumer engagement is a sign of great content. ENGAGEMENT RATE is a metric that is used heavily in analyzing social media. Because the engagement rate is calculated relative to the number of followers a company has on social media (or number of views), the rate for both small and large companies can be compared equally.

ENGAGEMENT

Key Engagement metrics for your LinkedIn page - Likes, Shares, Comments and Clicks - all in one widget.
USE THIS METRIC

ENGAGEMENT RATE

Your LinkedIn content Engagement Rate.
Description
Engagement Rate is a metric that is used heavily in analyzing social media. Because the engagement rate is calculated relative to the number of followers a company has on social media (or number of views), the rate for both small and large companies can be compared equally.
USE THIS METRIC
Who is my LinkedIn audience?
LinkedIn provides breakdowns of your followers by their company size, location, job function, industry and seniority. Use this information to tailor LinkedIn updates and increase followers’ interest. Track account POPULARITY and ENGAGEMENT over time with Platform to see if you are getting traction and if your LinkedIn efforts are paying off.

FOLLOWERS BY COMPANY SIZE

Your followers broken down by company size.
USE THIS METRIC

FOLLOWERS BY LOCATION

Your followers broken down by countries.
USE THIS METRIC

FOLLOWERS BY JOB FUNCTIONS

Your followers broken down by job functions.
USE THIS METRIC

FOLLOWERS BY INDUSTRY

Your followers broken down by industry.
USE THIS METRIC

FOLLOWERS BY SENIORITY

Your followers broken down by seniority.
USE THIS METRIC
Get more value out of your cloud data. Start using performance metrics now.
GET OCTOBOARD FREE