Automated Twitter Social Media Reporting Tool for Marketing Teams and Clients
Build automated social media reports for your marketing teams and clients using Twitter data.

TWITTER REPORTING
Twitter social media trends - activity, user engagement and competition monitoring.
In today's fast-paced digital age, where a tweet's performance can determine a brand's reach or a marketing campaign's success, analytics play a paramount role. Keeping track of multiple data metrics manually can be both time-consuming and error-prone. This is where the role of a software platform or SaaS product comes into the picture. For marketing teams and online businesses, automating these tasks not only ensures accuracy but also increases efficiency.
- Why Use a Software Platform for Twitter Reporting?
A robust software platform can efficiently handle the volume of data churned out by Twitter daily. It ensures that you don't miss out on key insights because of human error or oversight. Additionally, with the power of automation, these platforms can generate regular reports, monitor real-time metrics, and offer in-depth insights that might be difficult to ascertain manually.
- Octoboard: A Comprehensive Solution
Octoboard is one such software that comes to the rescue of businesses and marketing teams. Using Octoboard for Twitter analytics reporting offers the following advantages:
Automated Data Retrieval: Manual data entry and calculations are no longer required. Octoboard fetches all metrics automatically.
Easy Visualization: Complex data metrics are converted into understandable visuals and charts, which can be easily interpreted by any team member.
Customizable Reports: Depending on the needs of a particular campaign or period, reports can be tailored to focus on specific metrics.
- Breaking Down Key Metrics
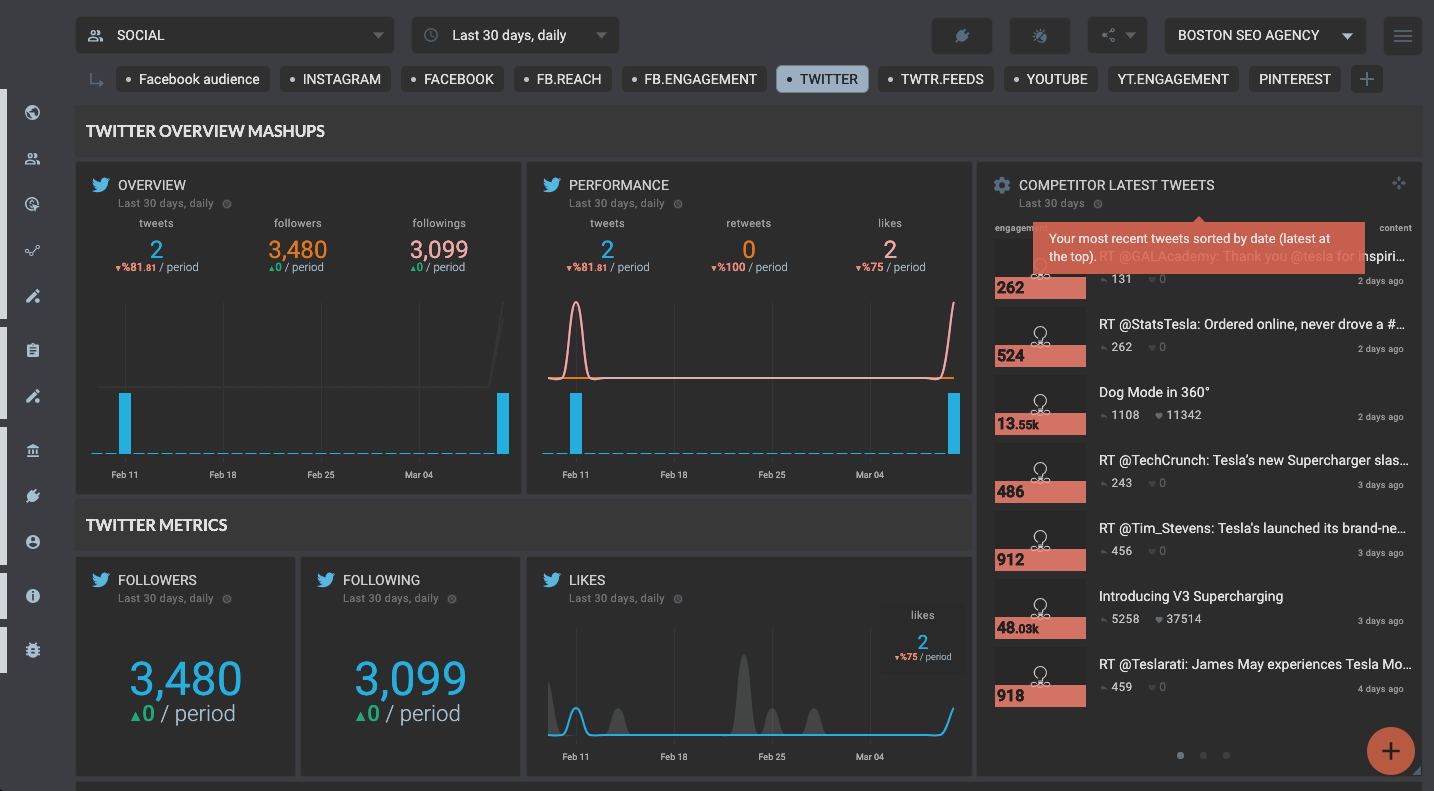
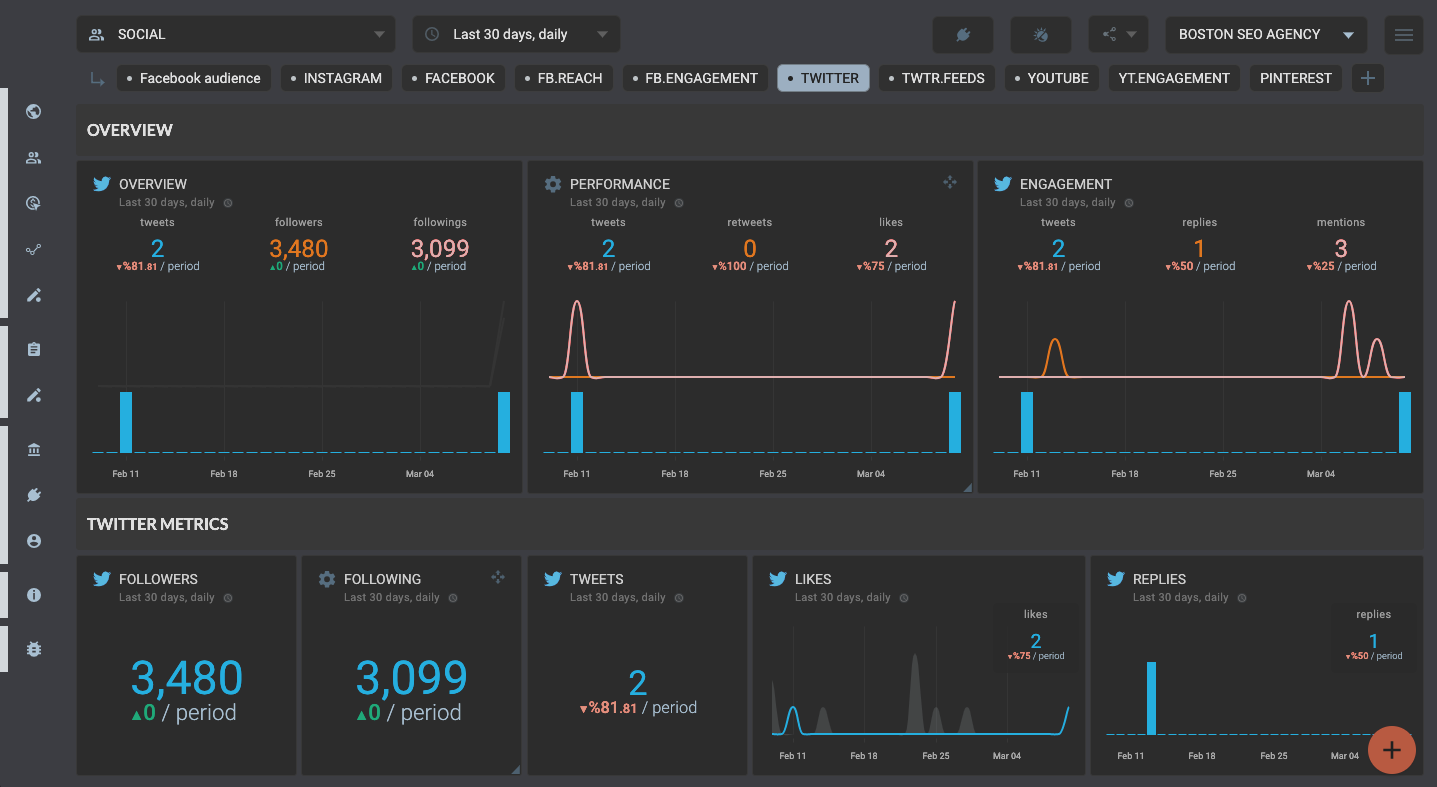
- OVERVIEW
This provides a bird's eye view of the Twitter account's overall performance. It's a snapshot that quickly shows the health and reach of your online presence.
- PERFORMANCE
It's an in-depth look at how your tweets and campaigns are performing. This metric often includes metrics such as reach, impressions, and click-through rates.
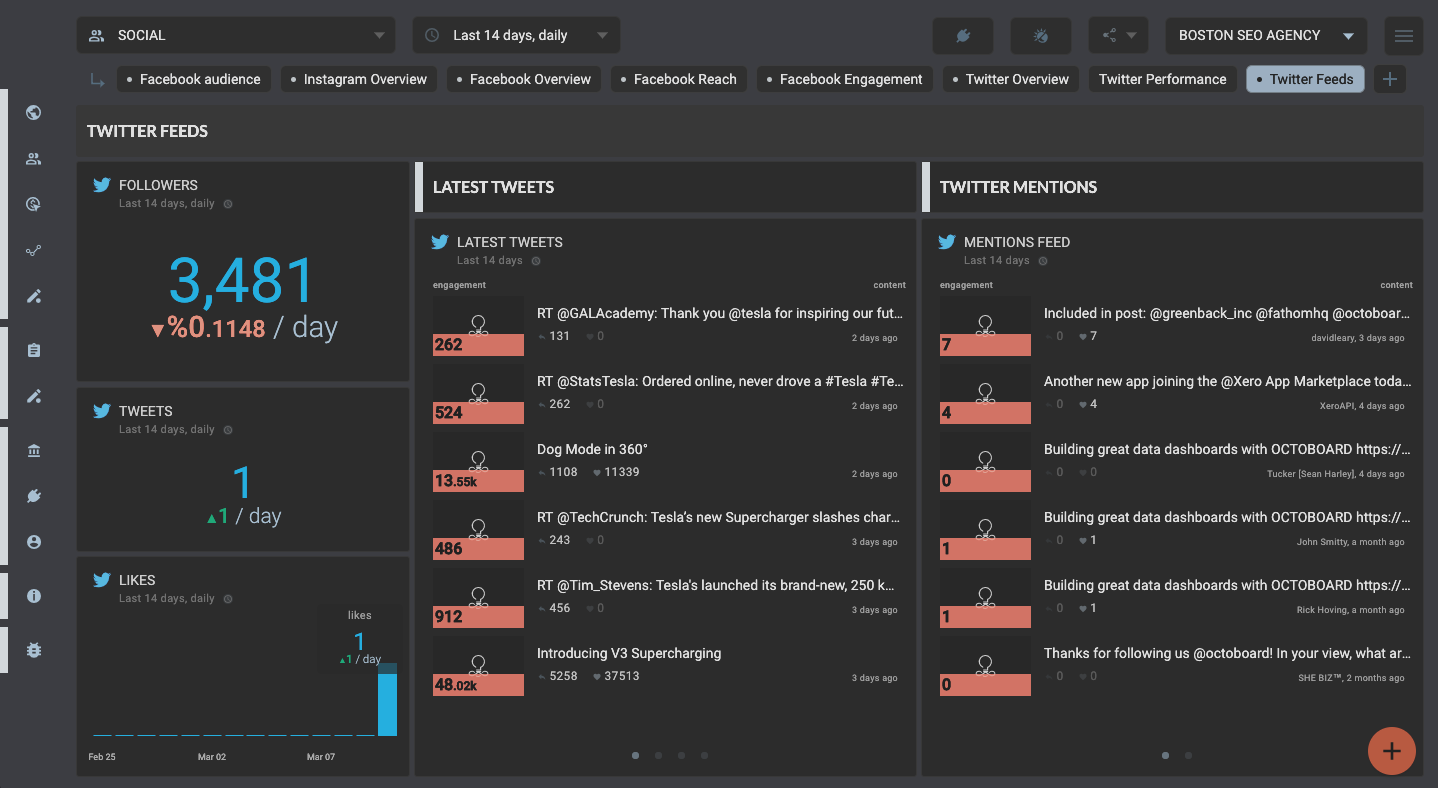
- LATEST TWEETS & TOP TWEETS
These sections showcase your most recent tweets and those that have received the most engagement. Understanding what content works is pivotal for planning future campaigns.
- ENGAGEMENT & ENGAGEMENT RATE
Engagement quantifies the interaction received on tweets. The engagement rate is a metric that calculates this interaction as a percentage of total impressions. High engagement often signifies resonating content.

- LIKES, RETWEETS, FAVORITES, & REPLIES
These are primary indicators of a tweet's popularity. They provide direct feedback on what your audience appreciates.
- FOLLOWING & FOLLOWERS
A measure of your account's growth and influence. A rising follower count suggests increasing brand popularity.
- TWEETS
This metric offers insights into your posting habits. Regular tweeting is often linked to better engagement and visibility.
- LISTED
The number of lists your account is added to. Being listed often means you are considered an authority or influencer in a particular niche.
- MENTIONS & MENTIONS FEED
Mentions reflect the buzz around your brand. It's a direct measure of how often others are talking about you. The mentions feed gives you a detailed view of these conversations, allowing you to engage or address any concerns.
- The Way Forward
Twitter is a dynamic platform. Its rapid pace means metrics change continuously, and strategies need to be updated accordingly. By leveraging Octoboard's data analytics platform, marketing teams can stay ahead of the curve, ensuring they harness the full potential of their Twitter presence. With automation, accuracy, and deep insights, the sky's the limit for online businesses and marketing teams.
- Live tracking of your tweets
- Twitter account popularity measurement
- User engagement metrics
- Competitor monitoring
Automated data reports enabled by Octoboard software
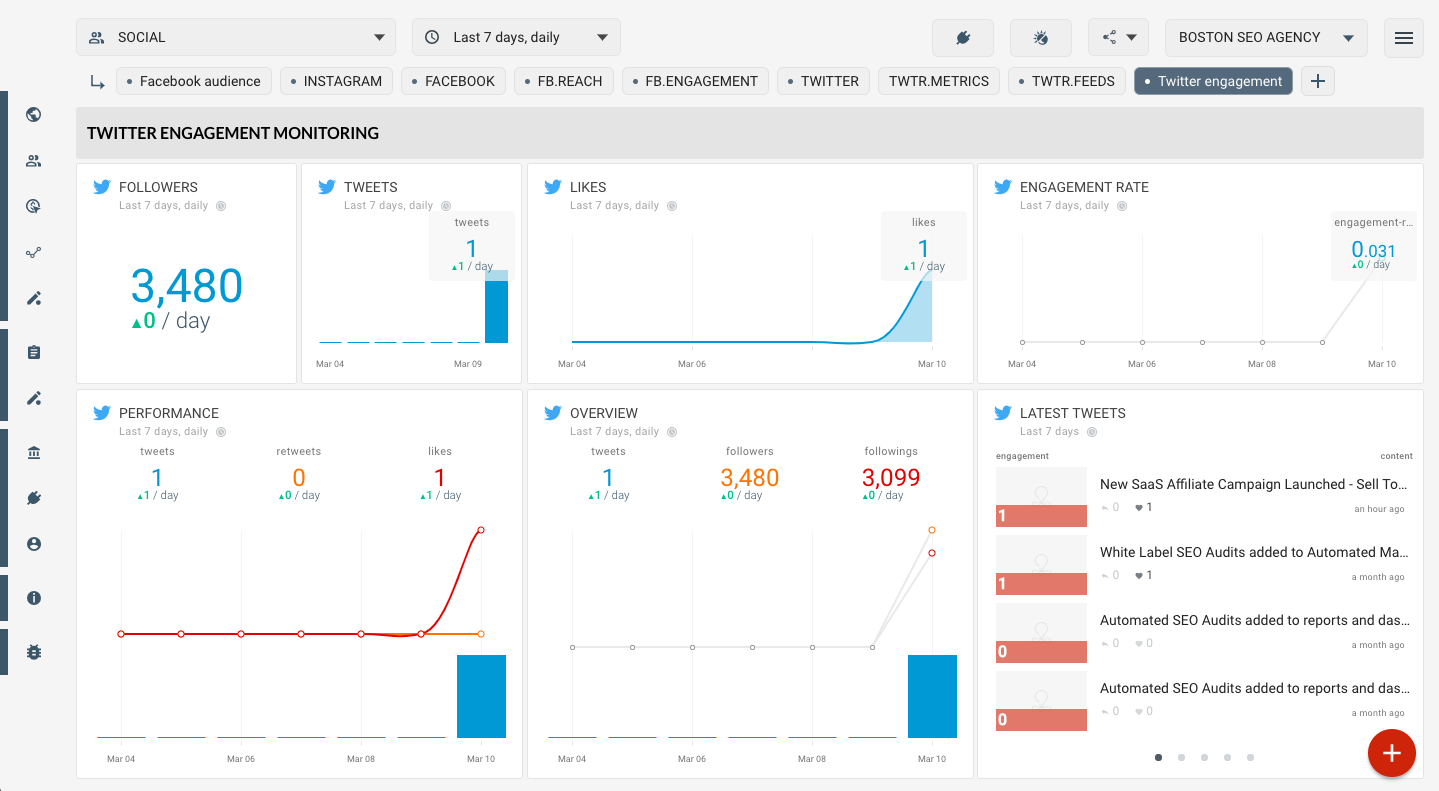
Twitter engagement

Twitter Overview
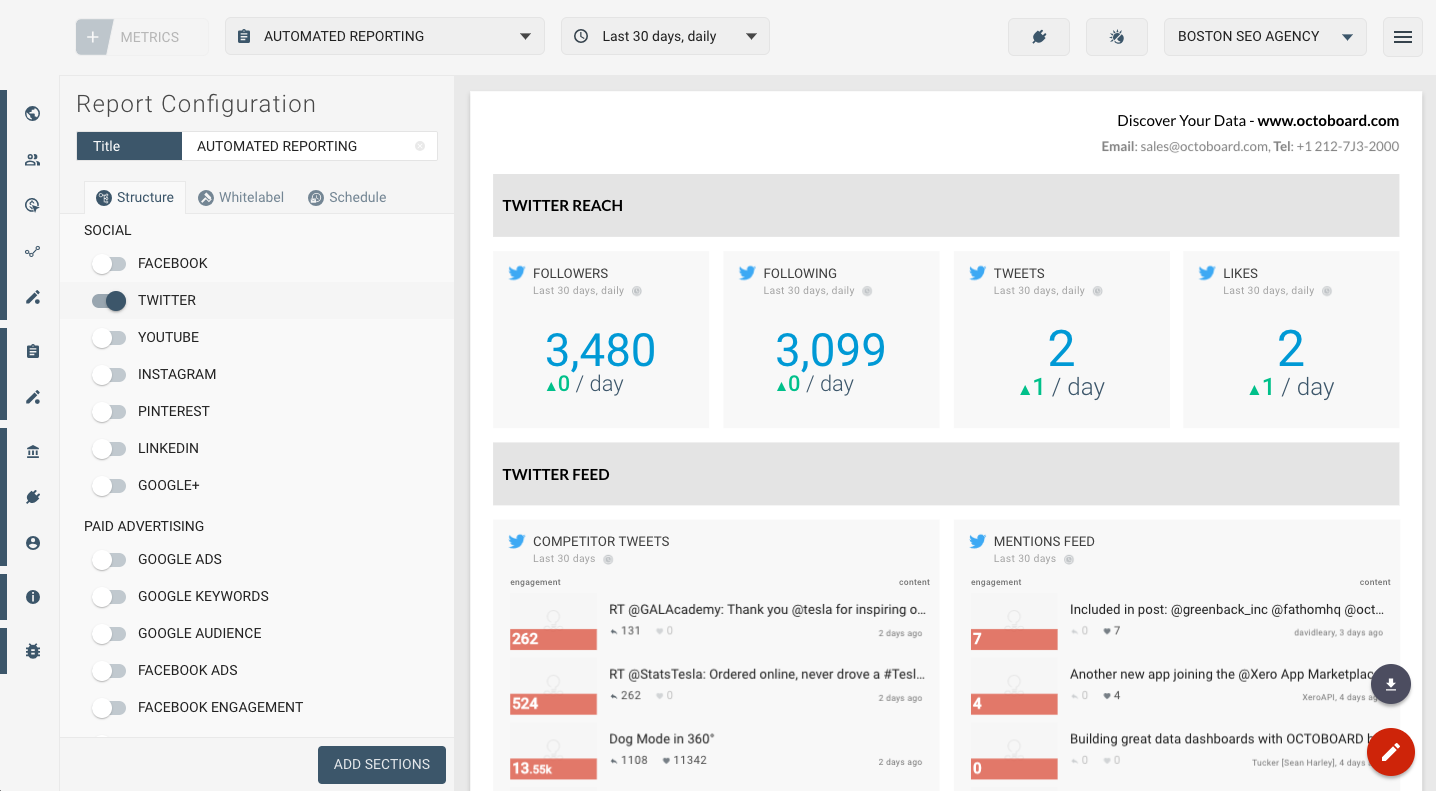
Twitter Overview (Report)
Twitter Metrics