Unlocking Growth with Twitter Overview: Building Real-time Social Media Dashboards
Unlock unprecedented growth with Octoboard's analytics platform integrated with Twitter's cloud data API.

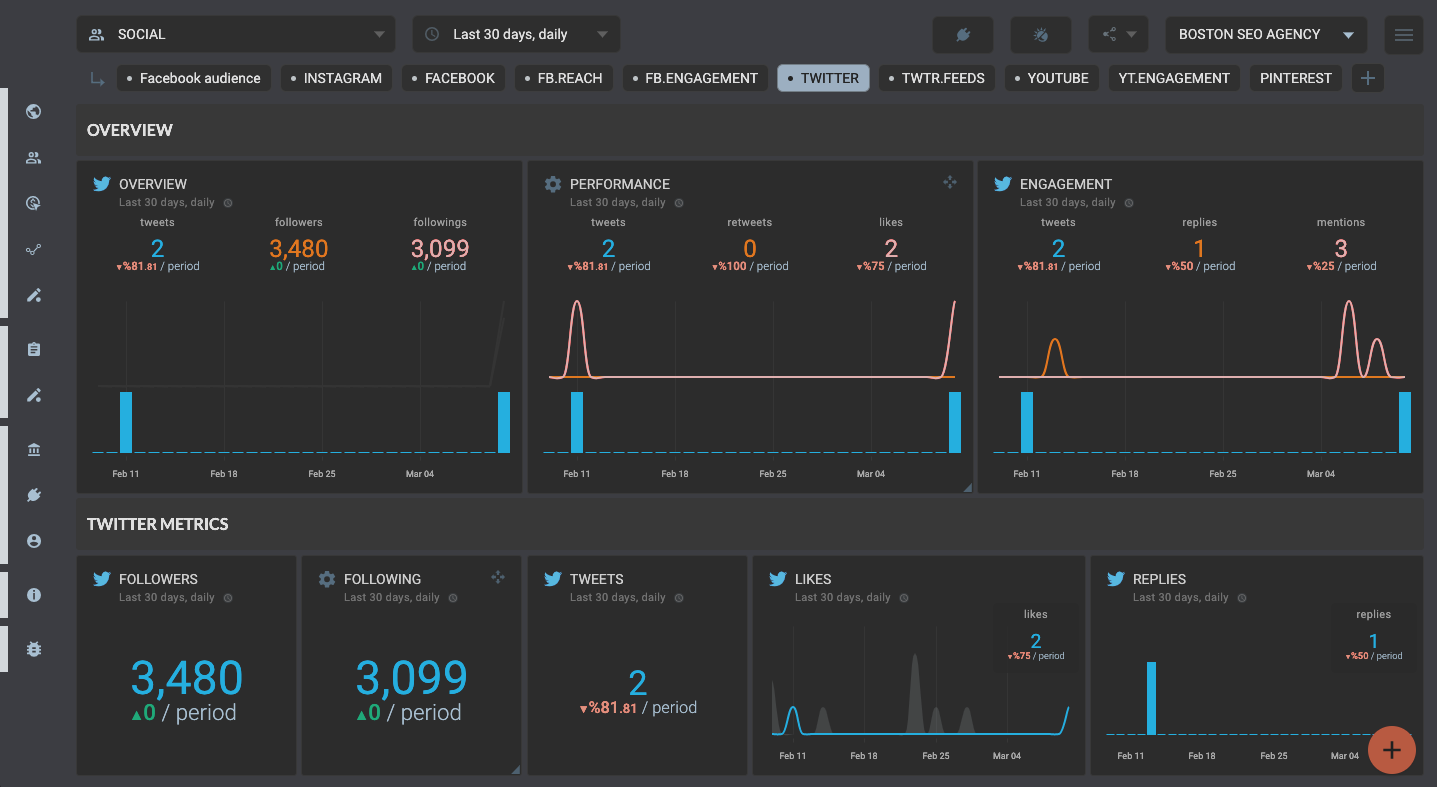
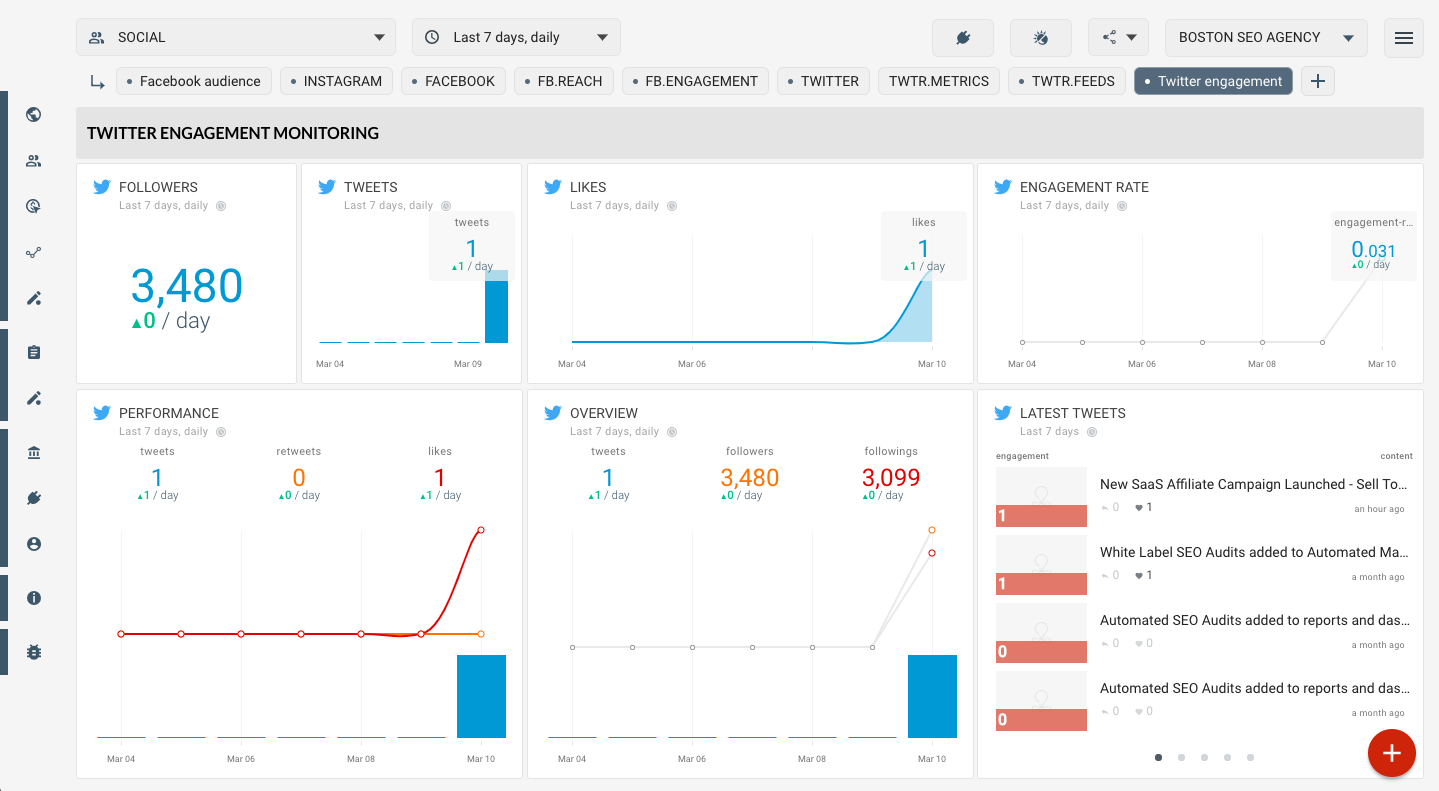
TWITTER OVERVIEW
Twitter social media dashboard: reach and engagement metrics.
Building Real-time Social Media Dashboards: Twitter Overview
In the digital age, where social media presence is pivotal for businesses, understanding and analyzing your social media performance can be the key to unlocking unprecedented growth. Twitter, being one of the leading platforms for instant communication and branding, offers a wealth of data that, if harnessed correctly, can provide valuable insights into your marketing strategy's effectiveness. This is where the integration of Octoboard's analytics platform with Twitter's cloud data API becomes a game-changer for marketing teams worldwide.
The Importance of Twitter Metrics
Twitter metrics offer a microscopic view of your social media health. Metrics such as Followers, Followings, Tweets, Performance, Engagement, and Likes serve as indicators of your brand's visibility, engagement rate, and overall social media footprint. Each metric tells a part of your brand's story on Twitter:
- Twitter Tweets signify your brand's activity level and its commitment to engaging with the audience.
- Twitter Followers and Followings give insights into your brand's popularity and its network on the platform.
- Twitter Performance and Engagement metrics help in understanding how well your content resonates with your audience.
- Twitter Likes are a direct reflection of your content's appeal to your followers.
Monitoring these metrics allows marketing teams to adjust their strategies in real-time, tailoring content to better meet their audience's needs and interests.
Automating Dashboard Creation with Octoboard
The Octoboard Marketing Analytics platform revolutionizes how marketing teams approach social media dashboard creation. By automating the process, Octoboard saves hundreds of hours that would otherwise be spent on manual data collection and analysis. This efficiency enables teams to focus more on strategy and content creation rather than getting bogged down by the minutiae of data management.
Moreover, Octoboard's white label client portals offer a professional touch to reporting, allowing agencies to present data to clients under their own brand. This not only enhances client trust but also streamlines the reporting process, making it more efficient and branded.
Visibility and Monitoring of Social Media Efforts
Displaying a real-time Twitter overview dashboard in an office setting does more than just show numbers; it provides visibility into the efforts and outcomes of your social media strategy. This constant visibility encourages teams to stay aligned with their social media goals and fosters a culture of accountability and continuous improvement. Moreover, monitoring Twitter metrics ensures that your strategy remains dynamic, adapting to the ever-changing landscape of social media.
Unified PPC Reporting with Octoboard
Beyond Twitter analytics, Octoboard's prowess extends into Pay-Per-Click (PPC) reporting. The platform's ability to consolidate PPC metrics across multiple channels into a single dashboard is invaluable for marketing teams. This unified approach offers a holistic view of advertising efforts, tracking impressions, user engagement, locations, and devices among other metrics. Such consolidation is critical for optimizing advertising spend and tailoring campaigns across different platforms to achieve the best ROI.
Learn more about Octoboard's PPC Analytics module.
Advanced PPC Analytics for Marketing Agencies
For marketing agencies, the advanced PPC Analytics module of Octoboard is a treasure trove. It allows the creation of new metrics, dimensions, and the application of advanced formulas to transform PPC data. This flexibility is crucial for agencies managing campaigns across different locations and currencies, providing them with the tools to build comprehensive and customized reports that cater to their specific needs and those of their clients.
Discover the advanced capabilities of Octoboard's PPC Analytics module.
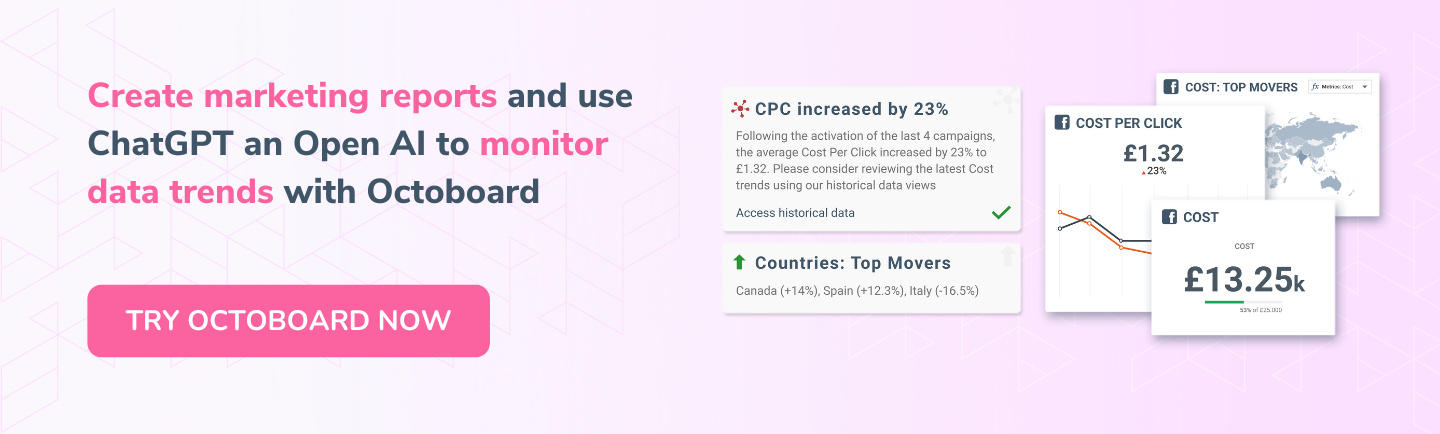
Automating Data Detection of Trends with Octoboard and ChatGPT/OpenAI
In today's fast-paced digital environment, staying ahead of marketing trends is not just beneficial; it's necessary. Octoboard's integration with ChatGPT/OpenAI for automated data insights represents a significant leap forward in this regard. By analyzing Twitter data trends based on the metrics mentioned, Octoboard can uncover insights that might otherwise go unnoticed, allowing marketing teams to pivot or double down on strategies with confidence.
Explore Octoboard's Automated Data Insights feature.
Google Sheets Data Export Feature
The integration of Octoboard with Google Sheets through its data export feature is another example of the platform's commitment to making data accessible and manageable. By allowing Twitter teams to export data directly to Google Sheets, Octoboard facilitates a seamless data analysis process. Teams can manipulate, visualize, and share Twitter analytics data more efficiently, enabling deeper insights and fostering a data-driven culture within the organization.
Learn more about Octoboard's Google Sheets data export feature.
The landscape of social media is ever-evolving, and with platforms like Twitter at the forefront of digital marketing, the need for comprehensive, real-time analytics has never been greater. Octoboard's integration with Twitter data, alongside its advanced analytics and reporting features, offers marketing teams a powerful tool to not only monitor but also enhance their social media strategies. By automating the creation of social media dashboards and providing deep insights into PPC campaigns, Octoboard ensures that marketing teams are always one step ahead, ready to capitalize on the dynamic nature of digital marketing.
Octoboard customers who created this report also used the following data templates:
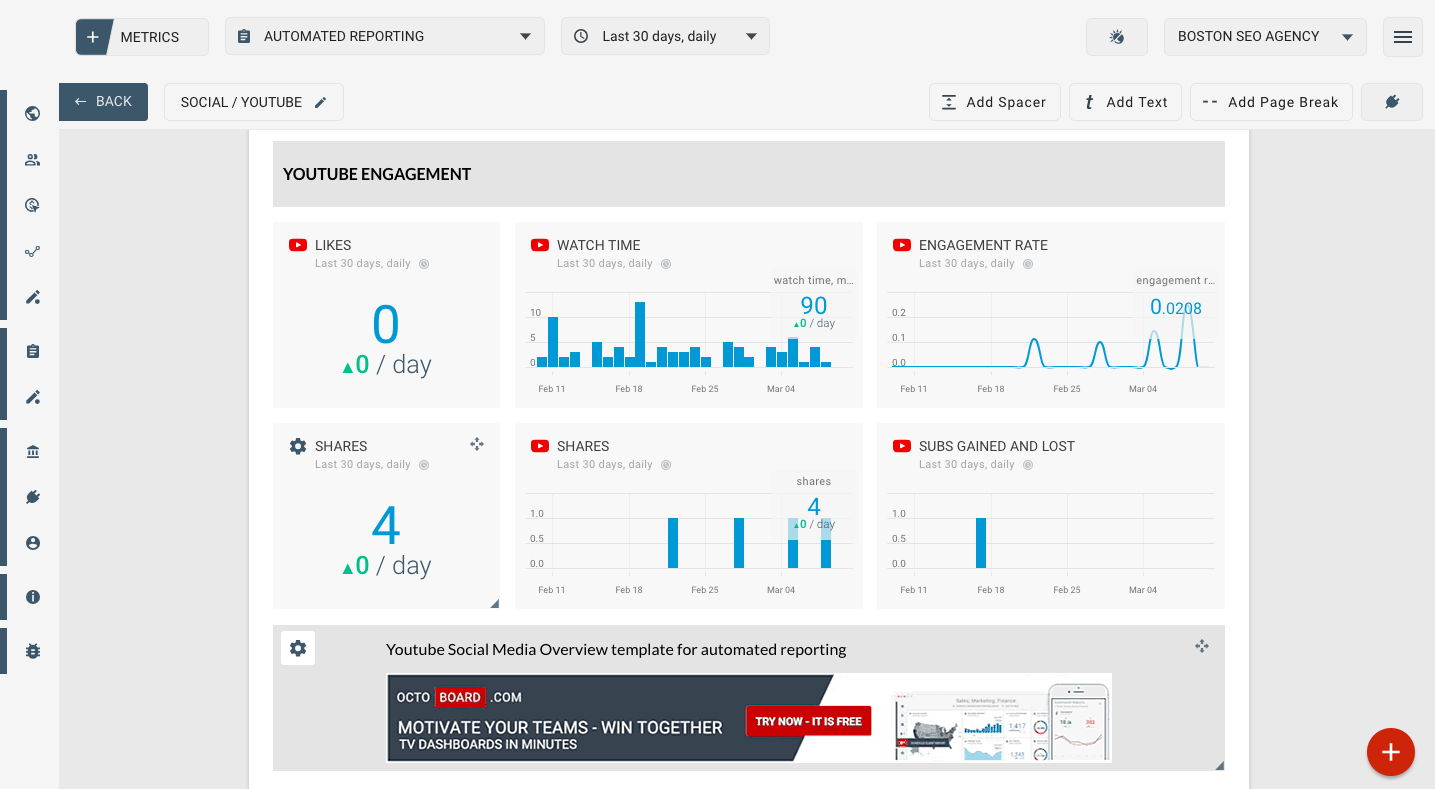
Youtube Engagement (Report)
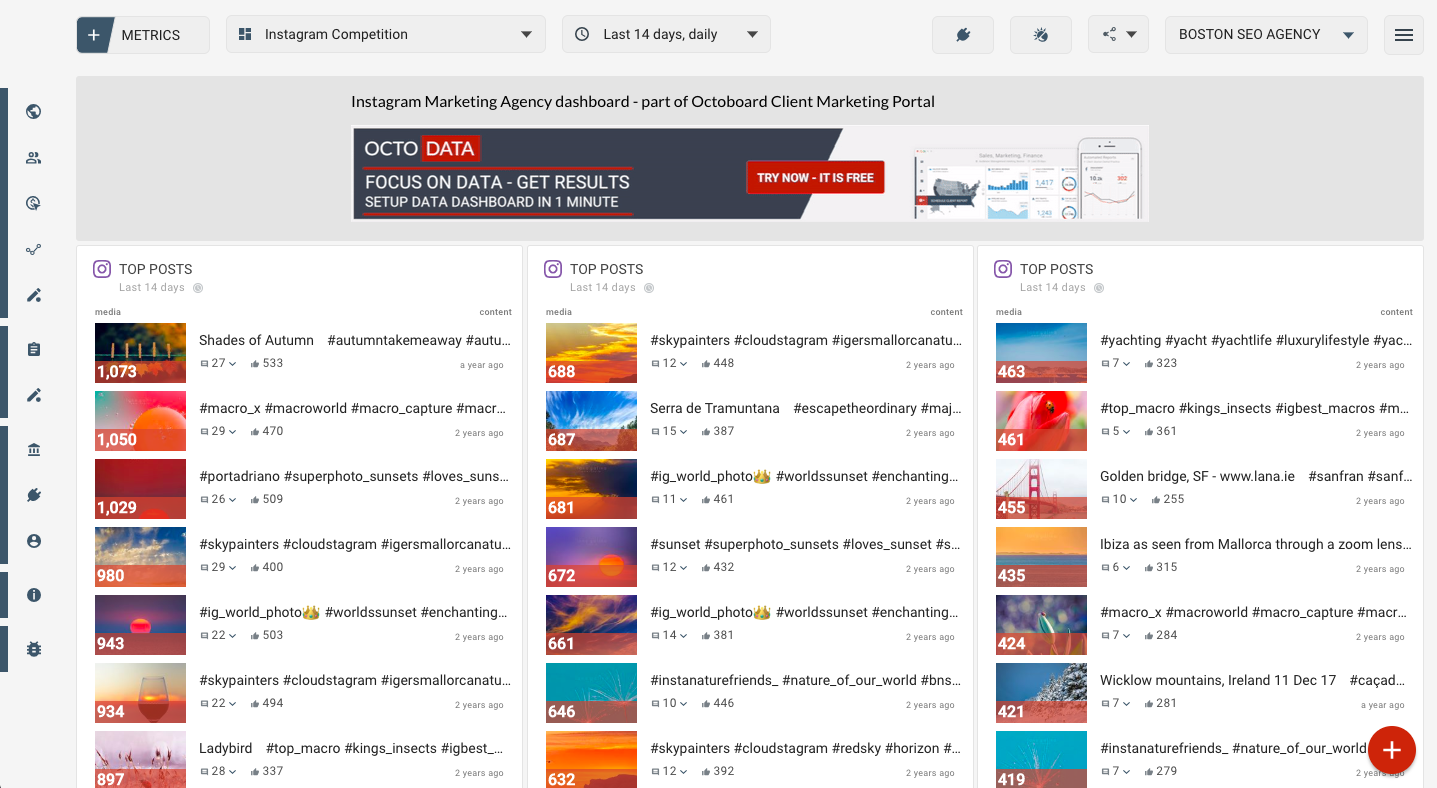
IG Competition - (Depreciated)
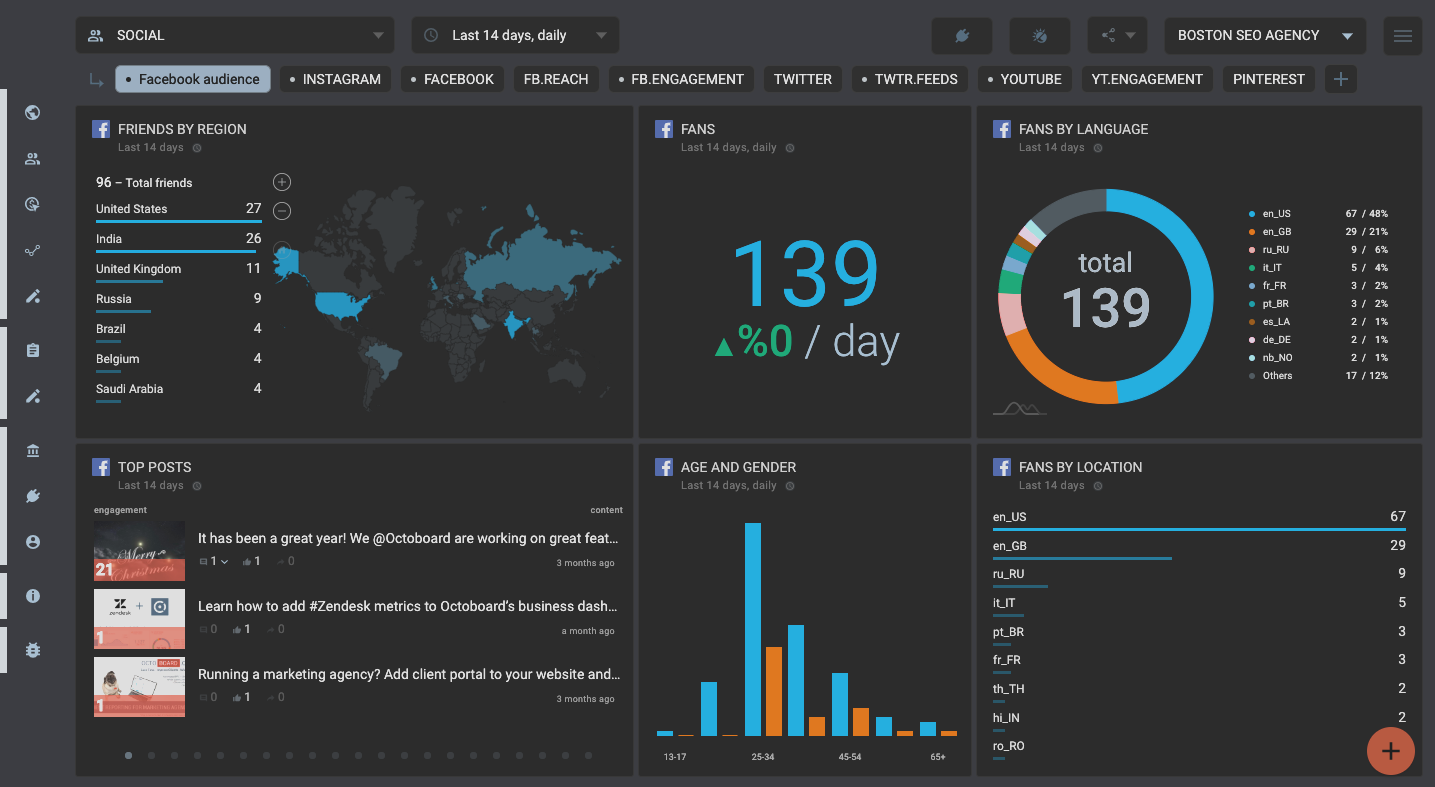
Facebook Social media template - Audience metrics
IG Overview - Report (Depreciated)
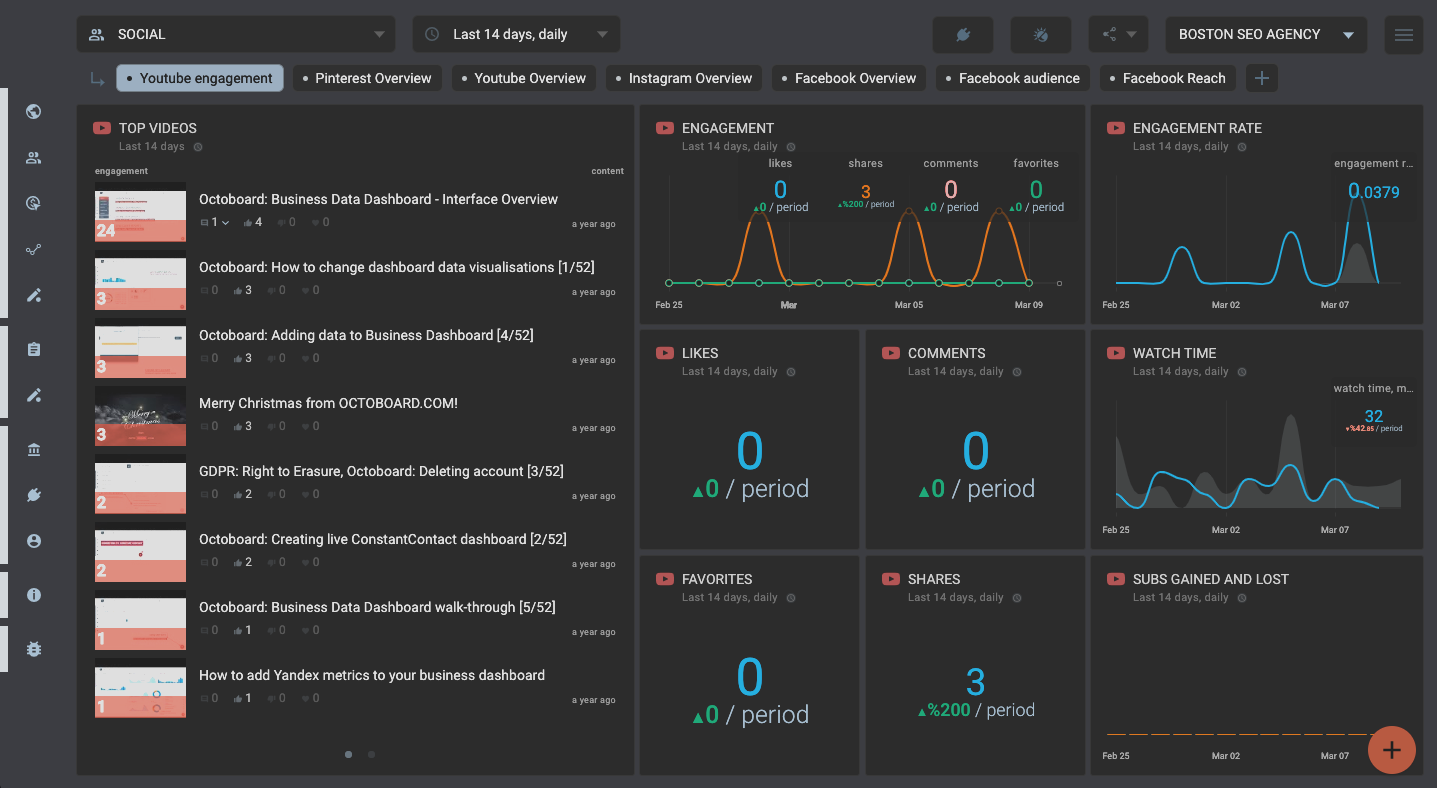
Youtube Engagement
Twitter engagement
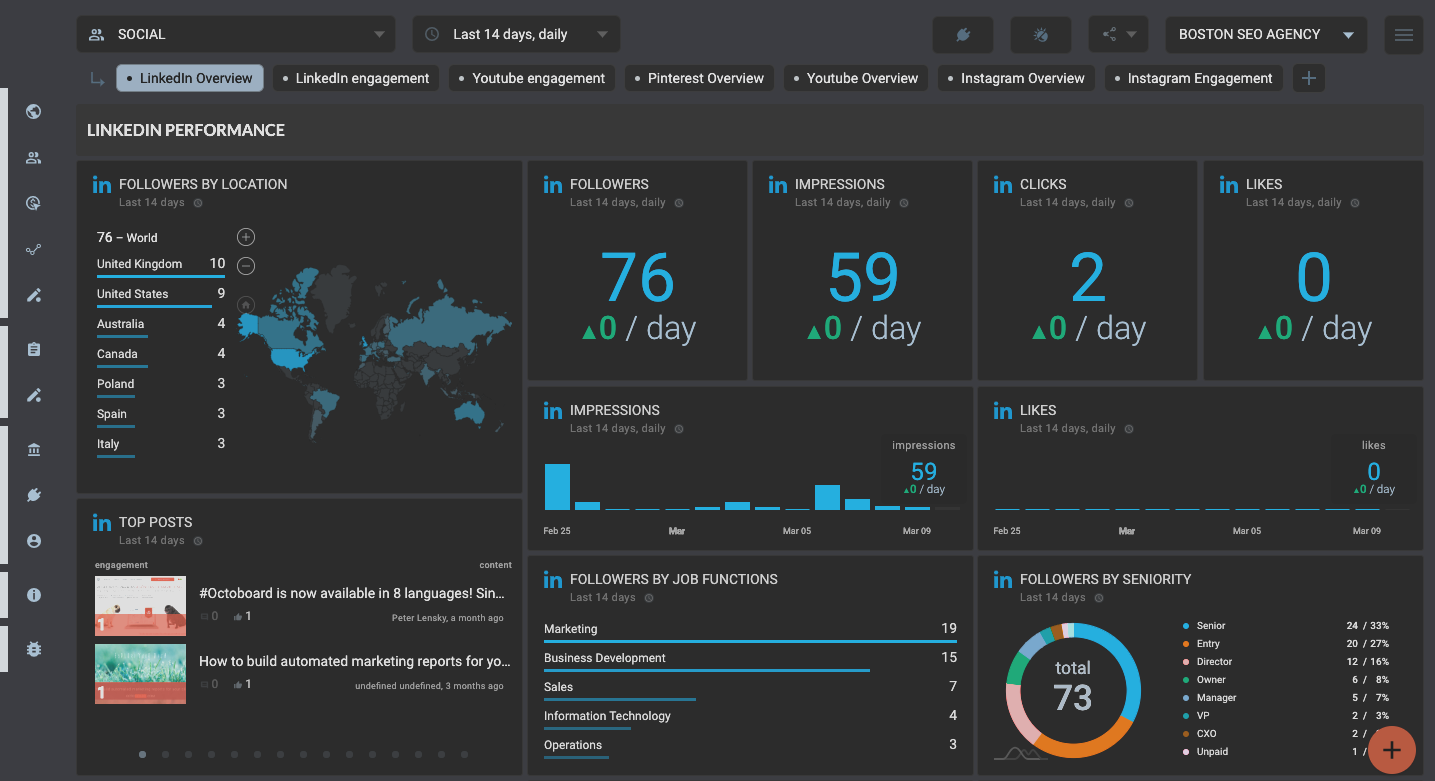
LinkedIn Social Media dashboard template
Youtube Overview
Instagram Engagement (Report)
Facebook Overview
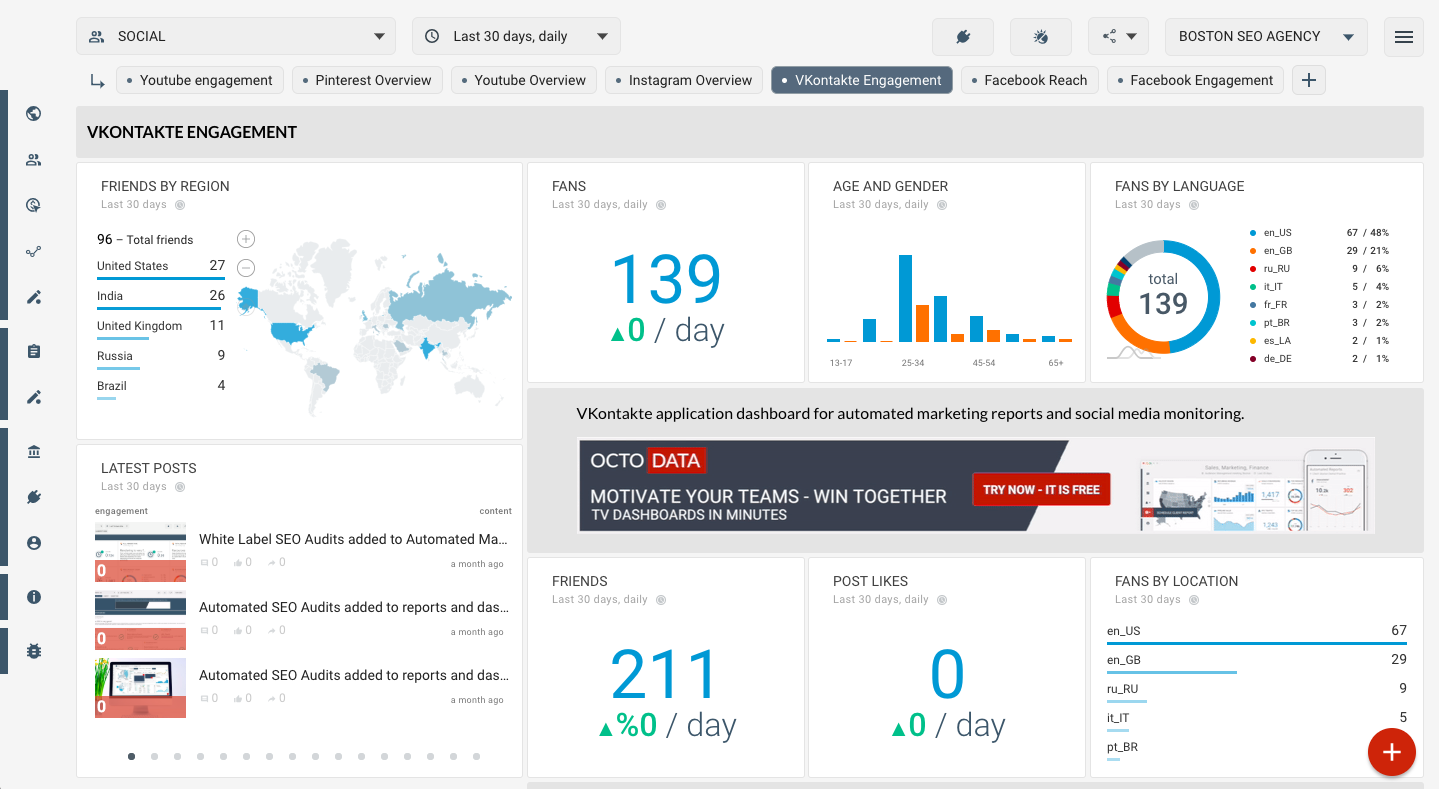
VKontakte Engagement