OCTOBOARD
English
PRICING
RESOURCES
LOGIN
TRIAL
TRIAL
English

The Importance of an Online Real-Time Dashboard for Facebook Audience Tracking | Octoboard

Discover the importance of an online real-time dashboard for Facebook audience tracking.

New marketing template — Facebook Audience
We have added a new data template "Facebook Audience" for automating Facebook data reports. Use it to build engaging client reports and send business updates by email.
All your data in one place
Business features include
 
New marketing template — Facebook Audience
Automated reporting
Keyword rank tracker
Send data to Google Sheets
B2B lead generation
White label client portal
Send data to BigQuery
ChatGPT data insights
 
All your data in one place

New marketing template — Facebook Audience

We have added a new data template "Facebook Audience" for automating Facebook data reports. Use it to build engaging client reports and send business updates by email.

All your data in one place
 
Business performance management dashboard shared

Share template "Facebook Audience" with your team

Add client portal to your website. Invite clients and team members and let them explore your collection data in dashboards and reports built using template "Facebook Audience".

Share with teams
Public links and embedding

Make your Facebook data public in a shared dashboard. Embed data views into any page of your website. The setup is very easy and does not require IT support.

Secure and private
Manage Facebook data visibility

You decide what data to share or to keep private. Access rights for individual users and clients is under your control.

Business performance management dashboard shared
 
Octoboard business cloud data dashboards for churn reduction

Showcase your Facebook Audience data

Create Facebook graphs and metrics that demonstrate positive historical changes and results. Compare historical Facebook KPI changes and prove ROI to any business with regular and automated reporting.

Octoboard business cloud data dashboards for churn reduction
 
White label client portal

Enable Facebook client portal

Create and host white label client portal on your website using Facebook data. Use our library of templates, place your logo and send automated reports in seconds.

Share data view links

Create public and private dashboards and reports using template "Facebook Audience". Embed data views into any page of your website. The setup is very easy and does not require IT support.

White label client portal
 
Automated cloud data insights

Use OpenAI and ChatGPT to indentify Facebook data trends

Octoboard will constantly monitor data changes in the "Facebook Audience" template. We use ChatGPT and OpenAI to identify Facebook trends and send regular updates.

Connect Facebook once and enable our AI engine

We employ our own machine learning algorithms to automatically discover Facebook trends that you may miss. Connect to your Facebook data and receive insights in your Email box.

Automated cloud data insights
SOCIAL MEDIA REPORTING TOOL / FACEBOOK AUDIENCE

FACEBOOK AUDIENCE

Facebook metrics for audience monitoring and analysis.

Template for generated report: Facebook audience template

The Importance of an Online Real-Time Dashboard for Facebook Audience Tracking

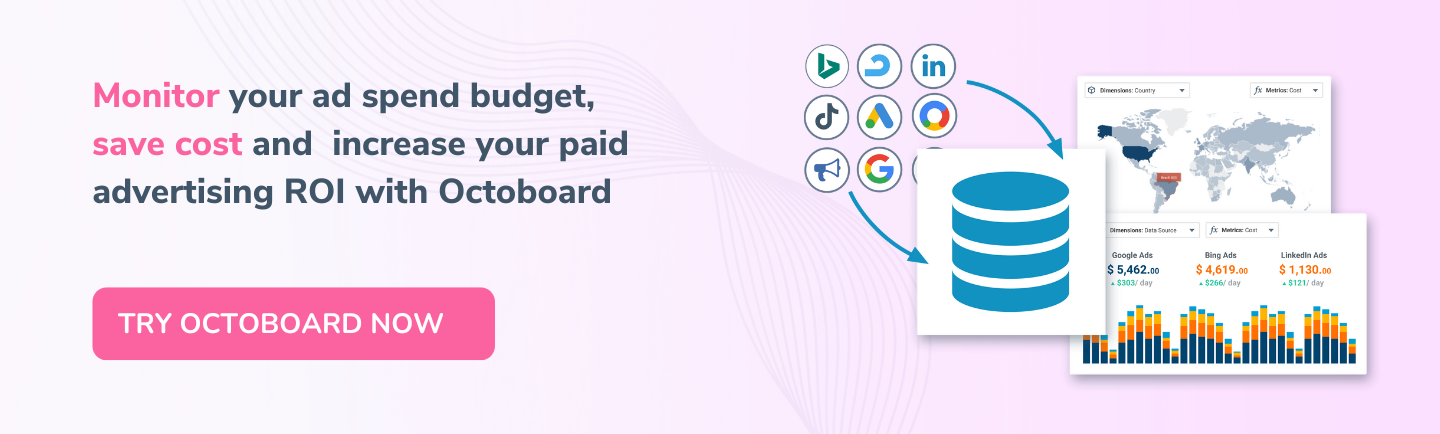
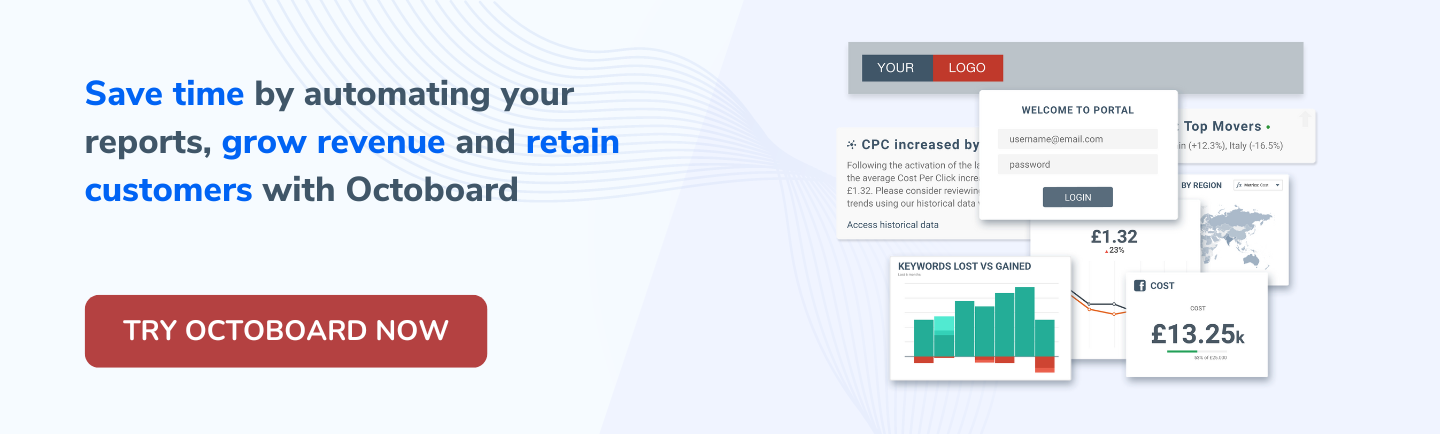
In today's digital age, marketing teams and online businesses rely heavily on data analytics to understand their audience, measure the success of their campaigns, and make informed business decisions. One such crucial tool is an online real-time dashboard, which provides a comprehensive view of key metrics related to Facebook audience tracking. By utilizing an automated data analytics platform like Octoboard, businesses can generate and automate this specific report, enabling marketing teams to have the most up-to-date information at their fingertips.

Understanding the Key Metrics

To fully comprehend the significance of this report, let's take a closer look at the key metrics included:

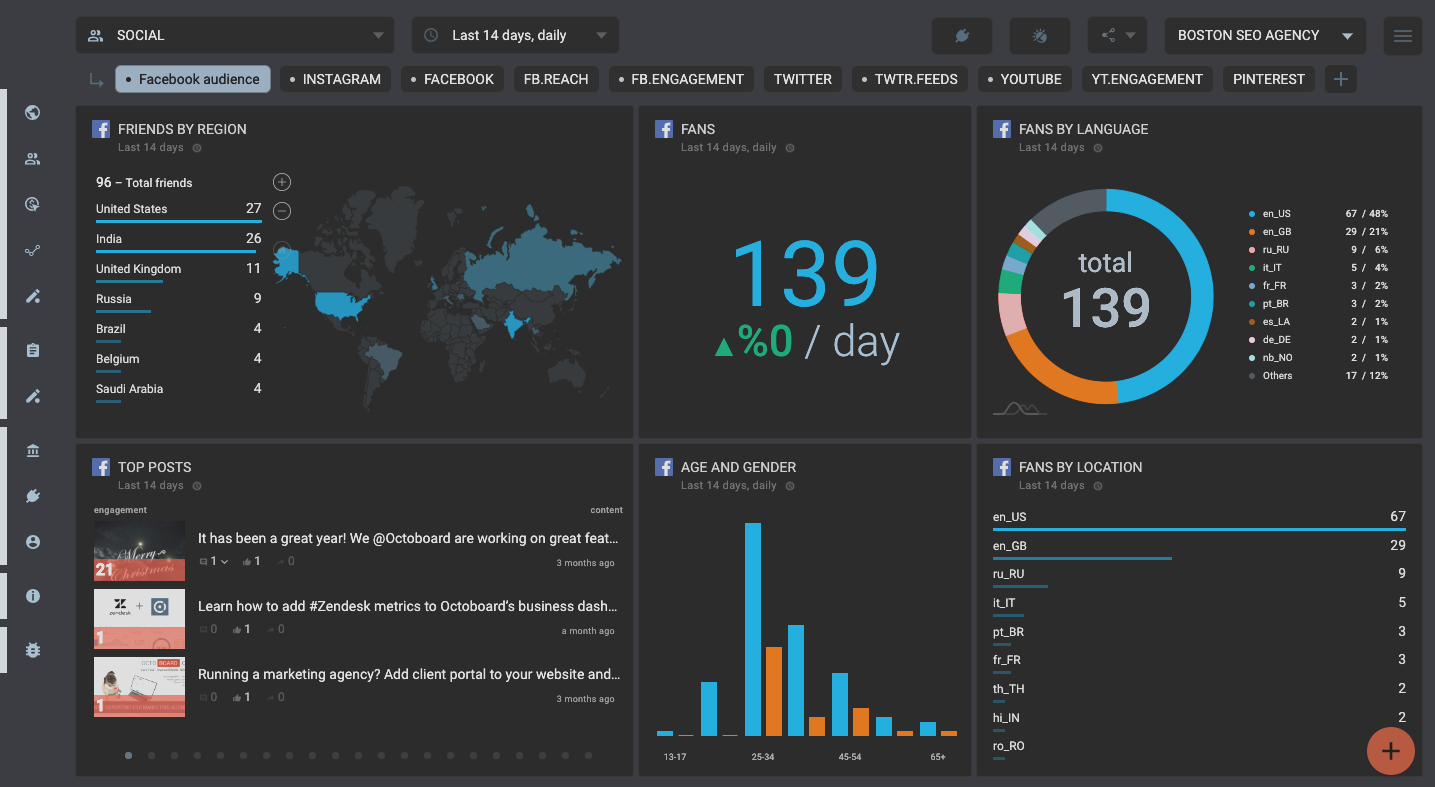
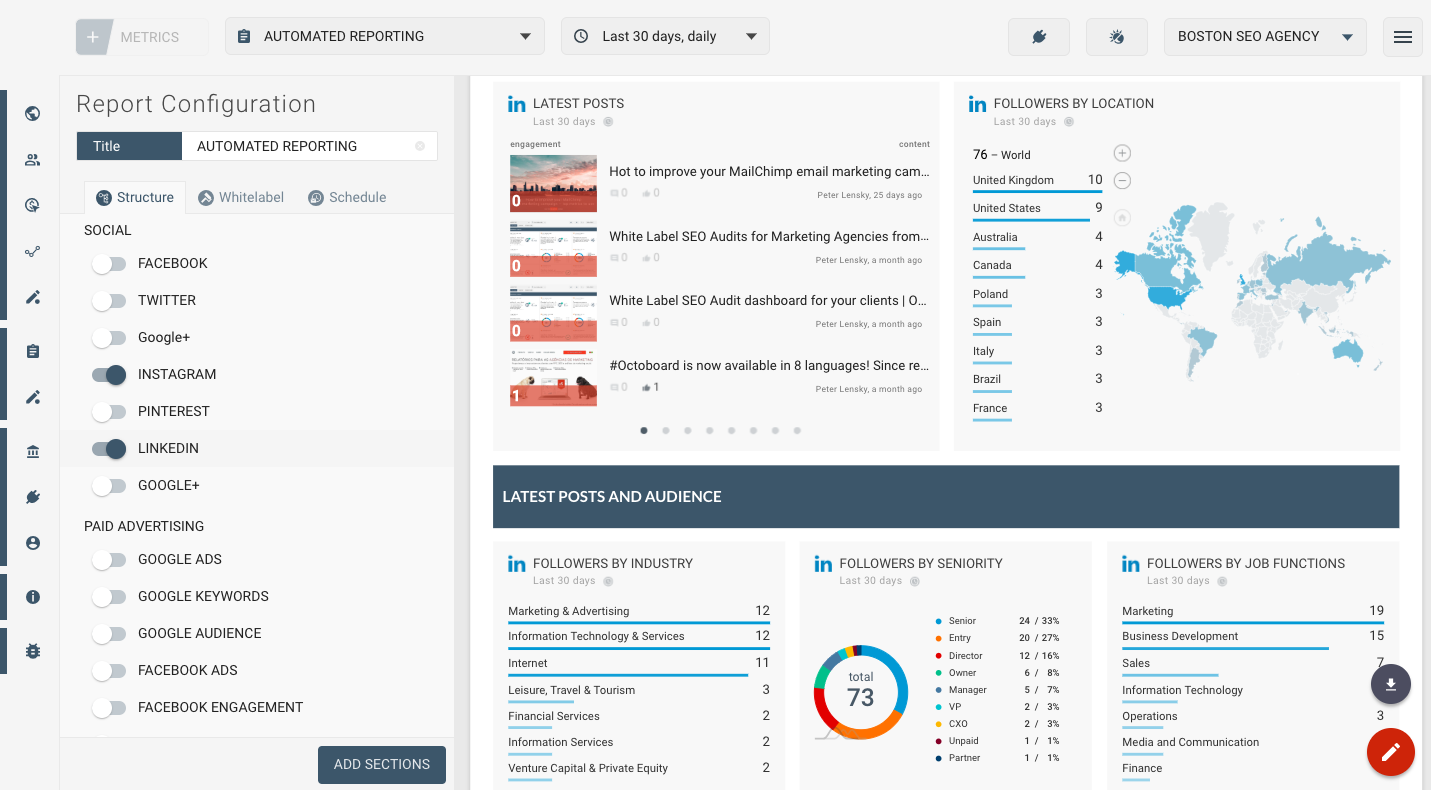
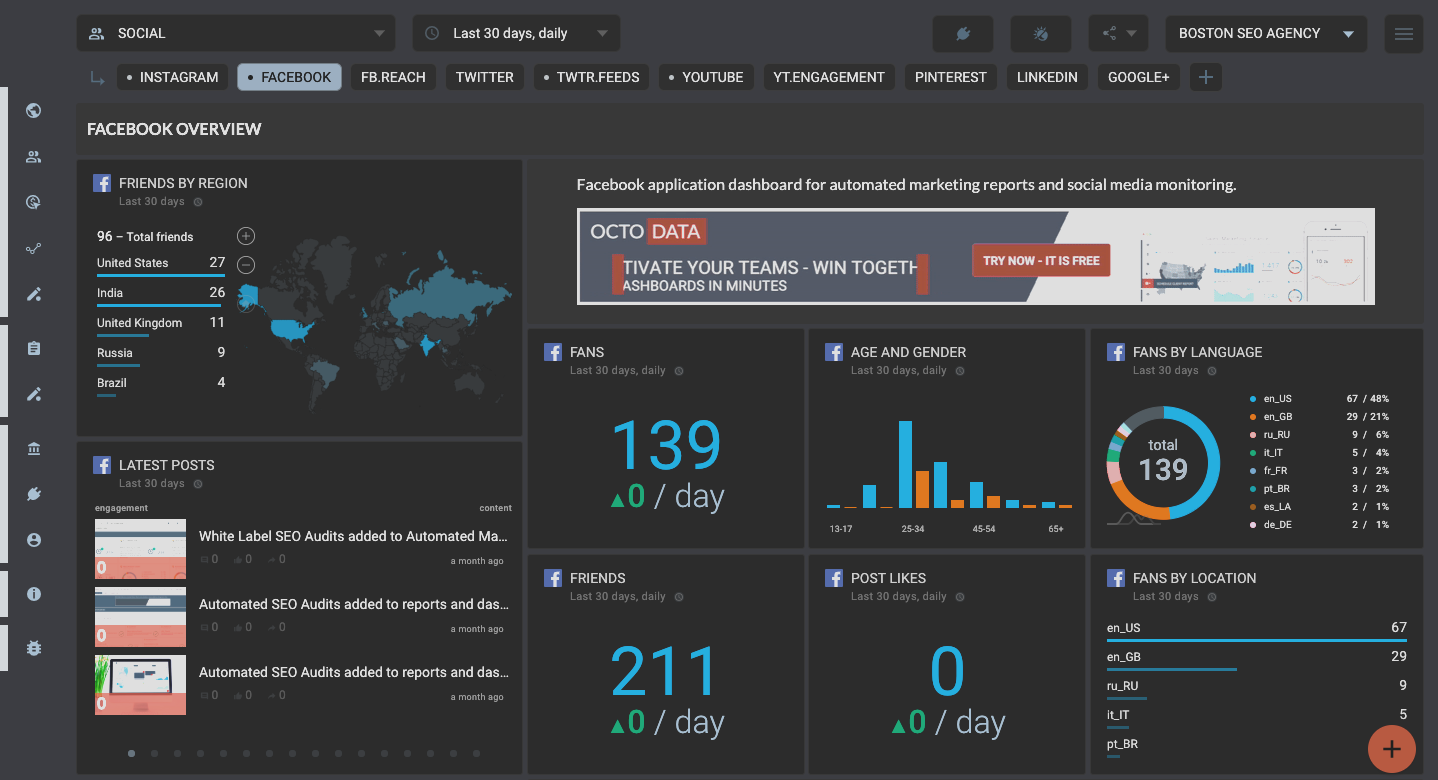
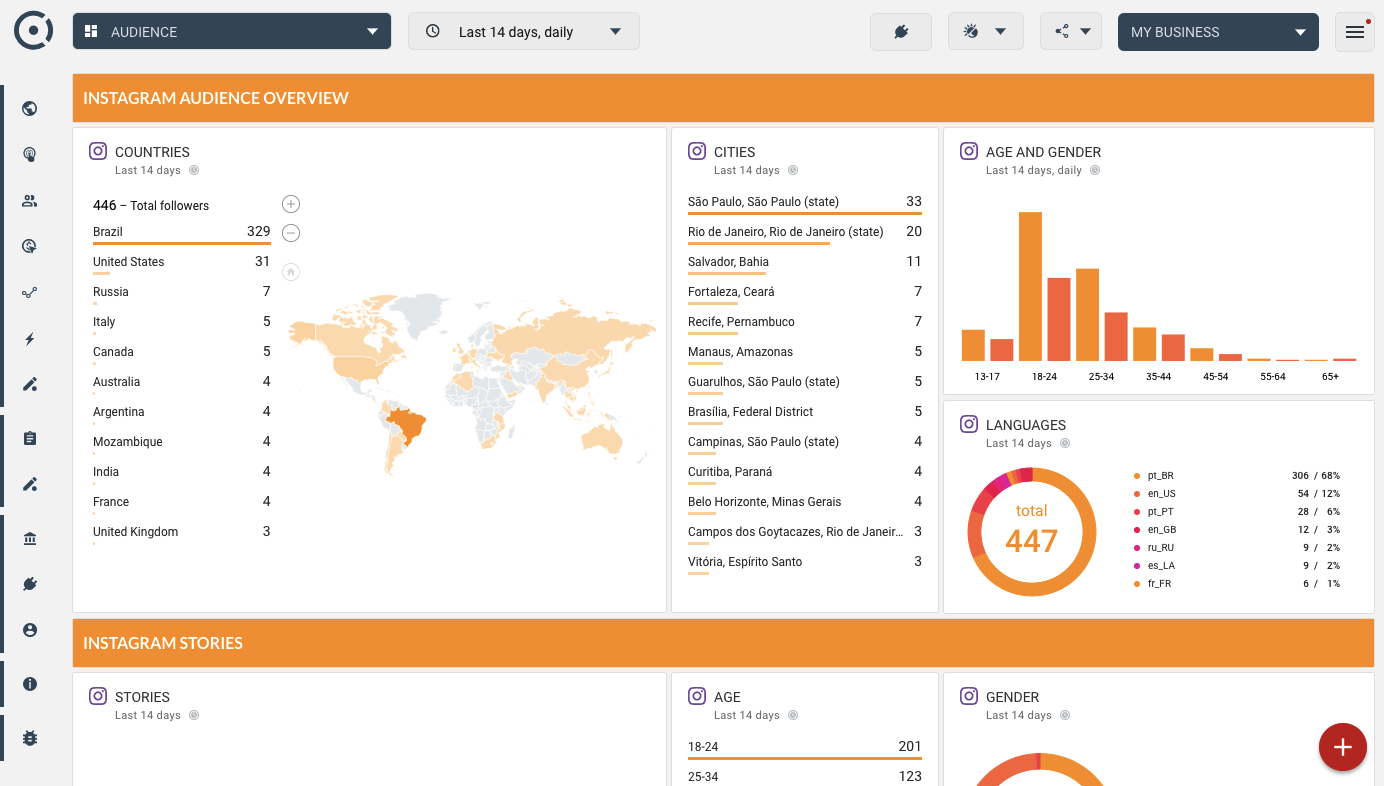
Facebook Fans by Country Map: This metric visualizes the geographical distribution of a business's Facebook fans. It helps marketing teams identify areas where their brand is most popular, allowing them to tailor their marketing efforts and campaigns to specific regions.

Automate all your marketing reports. Save time and retain clients with Octoboard.


Facebook Fans Series: This metric provides a historical overview of the growth of a business's Facebook fan base over time. By tracking this series, marketing teams can identify trends and patterns that contribute to audience engagement and brand loyalty.

Facebook Fans by City: This metric delves deeper into the geographical distribution by showcasing the top cities where a business's Facebook fans are located. It assists marketing teams in identifying potential growth opportunities in specific urban areas, enabling targeted advertising and localized campaigns.

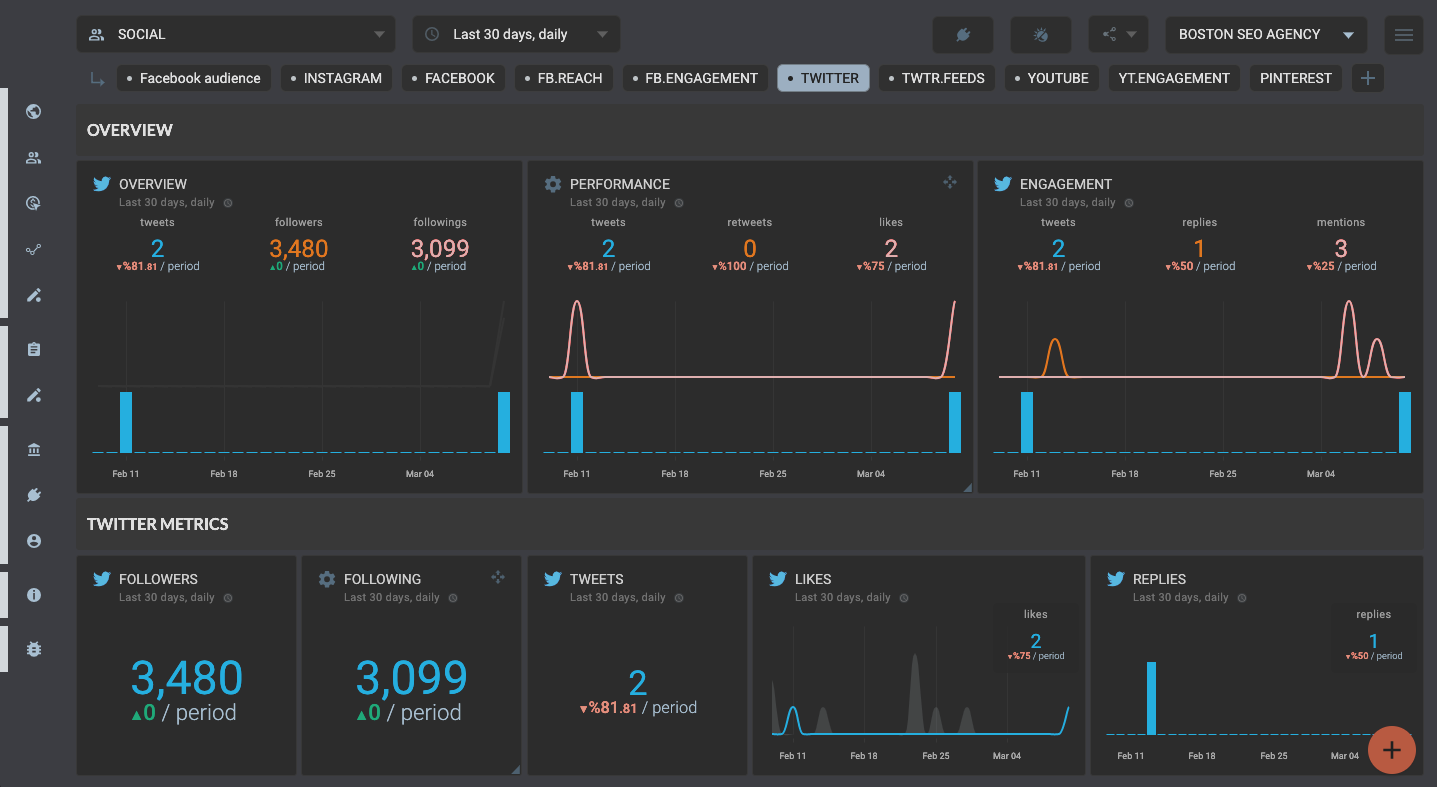
Facebook Impressions Reach Engagement: This metric measures the reach and engagement of a business's Facebook content. It includes the number of impressions (the total number of times a post has been seen), the reach (the unique number of people who have seen a post), and the engagement (the number of interactions such as likes, comments, and shares). Understanding these metrics helps marketing teams assess the effectiveness of their Facebook content strategy and optimize future campaigns accordingly.

Create cross-channel PPC reports. Monitor your ad spend across all platforms with Octoboard.


Facebook Audience Demographic: This metric provides insights into the demographic composition of a business's Facebook audience. It includes information such as age, gender, and interests, allowing marketing teams to better understand their target market and refine their messaging and targeting strategies.

Facebook Fans by Language: This metric showcases the language preferences of a business's Facebook fans. It is particularly beneficial for international businesses or those targeting specific language-speaking demographics. By identifying the dominant languages spoken by their audience, marketing teams can optimize their content to resonate more effectively.

The Importance for Marketing Teams and Online Businesses

The above report is crucial for marketing teams and online businesses for several reasons:

Real-Time Insights: Having access to real-time data allows marketing teams to stay ahead of the game. With an online real-time dashboard, they can monitor and analyze key metrics as they happen, enabling quick decision-making and agile campaign adjustments.

Save time by automating your reports, grow revenue and retain customers with Octoboard.


Improved Targeting: Understanding the geographical distribution, demographic composition, and language preferences of their audience empowers marketing teams to refine their targeting strategies. This leads to more effective campaigns, higher engagement rates, and ultimately, increased conversions.

Performance Measurement: By tracking metrics such as Facebook fans growth, impressions, reach, and engagement, marketing teams can evaluate the success of their efforts. This data helps them identify which campaigns, content types, or target markets are performing well and which ones may require adjustments.

Data-Driven Decision Making: An automated data analytics platform like Octoboard streamlines the process of generating and automating reports, saving marketing teams valuable time and resources. With easy access to accurate and up-to-date data, teams can base their decisions on solid evidence rather thanguesswork or assumptions.

Create cross-platform PPC reports, send your data to BigQuery, Looker Studio and build your own data warehouse.


Competitive Advantage: Utilizing an online real-time dashboard and automated data analytics platform gives marketing teams a competitive edge. With access to comprehensive insights and the ability to make data-driven decisions, businesses can stay ahead of their competitors, adapt to market trends, and seize opportunities as they arise.

ROI Optimization: The ability to measure the impact of marketing efforts on Facebook is vital for optimizing return on investment (ROI). By analyzing metrics like impressions, reach, and engagement, marketing teams can identify high-performing campaigns, allocate resources effectively, and maximize their marketing budget.

Create cross-platform PPC reports, send your data to BigQuery, Looker Studio and build your own data warehouse.


An online real-time dashboard for Facebook audience tracking, powered by Octoboard's automated data analytics platform, is a game-changer for marketing teams and online businesses. It provides invaluable insights into audience demographics, engagement levels, and campaign performance. By harnessing the power of real-time data and automation, businesses can make informed decisions, improve targeting, and optimize their ROI. In today's data-driven landscape, utilizing such a dashboard is essential for staying competitive, driving growth, and achieving marketing success.

1,847
GET THIS TEMPLATE
Last reviewed:
4-Apr-24
Dashboards:
Reports:
Client portals:
White label:
Data refresh:
OpenAI Data insights:
Office TV output:
Multi-client:

"FACEBOOK AUDIENCE" METRICS

PERFORMANCE

Impressions (page displays), Reach (number of people) and Engagement (sum of clicks, likes and shares) over a period of time.
Description
Impressions is the number of times a post from your Page is displayed. People may see multiple impressions of the same post. For example, if someone sees a Page update in News Feed and then sees that same update when a friend shares it that would count as 2 impressions.

Reach is the number of people who received impressions of a Page post. Reach might be less than impressions since one person can see multiple impressions. For example, if a person sees a Page update in News Feed and then sees that same update when a friend shares it that would represent a reach count of one.

Likes is the number of times people Like your posts. Likes are an indicator of how well your content resonates with people.

Comments is the number of comments people make on your posts. Comments can provide insight into how people feel about your content, products or brand overall.

Shares is the number of times people share your content. Shares measure how much your content is amplified by those who see it.

Engagement is the total number of people who engagement with your content, including clicking on page links.

USE THIS METRIC

PAGE FANS BY REGION

Countries where your friends and fans are from.
Description


Please note that a maximum of 45 countries can be displayed. Therefore Total number of fans may be larger than what is show on the map.
Tips
Understanding your audience is extremely important. You can use this information to rank your traffic sources, to uncover business opportunities, to build sales strategy and much more.

Start from understanding your viewers’ age, gender and geographical information. Combine it with Traffic Sources and Engagement Rate.
USE THIS METRIC

AGE AND GENDER

Breakdown of your Facebook audience by Age and Gender.
Description
Bar graph that show the breakdown of your audience age and gender.

It is not always possible for Facebook to identify correct age or gender. We only include data that is correctly identified by Facebook. Users with "Unknown" age and gender are not included in this report.
Tips
Keep an eye on Age and Gender breakdown and make sure your content is relevant to your visitors.

To be successful in social media you have to make sure you know your audience.


The higher the relevance, the better is the Engagement. High engagement will ultimately lead to higher popularity and lasting relationships with your visitors.
USE THIS METRIC

PAGE FANS

Number of people that like your page.
Description
In Page Insights and other places on Facebook, fans is another way to refer to the people who like your Page.
Tips
You can always change presentation of this metric converting it to a numeric representation or adding a target (number of funs you want to have in the future) or a delta (how much fans count changed in the last period).
USE THIS METRIC

FANS BY LANGUAGE

Top languages of your audience.
Tips
Use this metric to understand your audience and make your content more relevant and improve engagement.
USE THIS METRIC

PAGE FANS BY CITY

Top cities that your audience is from.
USE THIS METRIC
Get more value out of your cloud data. Start using performance metrics now.
GET OCTOBOARD FREE

Octoboard customers who created this report also used the following data templates:

Click for details...
OCTOBOARD dashboards, templates and reports gallery: Facebook reach template

FACEBOOK REACH

Group of Facebook metrics covering content and reach (paid, organic, viral).
Click for details...
OCTOBOARD dashboards, templates and reports gallery: Youtube social media template for engagement and reach

YOUTUBE OVERVIEW

Youtube social media dashboard: feed, reach and engagement metrics.
Click for details...
OCTOBOARD dashboards, templates and reports gallery: Vkontakte profile template

VKONTAKTE PROFILE

VKontakte profile metrics in one dashboard
Click for details...
OCTOBOARD dashboards, templates and reports gallery: Facebook reach and engagement automated report

FACEBOOK SOCIAL MEDIA REPORT TEMPLATE (REPORT)

Key Facebook Social metrics for Marketing Agency clients
Click for details...
OCTOBOARD dashboards, templates and reports gallery: Instagram engagement report

INSTAGRAM ENGAGEMENT (REPORT)

Instagram engagement report and user actions
Click for details...
OCTOBOARD dashboards, templates and reports gallery: Facebook overview template

FACEBOOK OVERVIEW

Key Facebook metrics for Social Media marketing dashboard.
Click for details...
OCTOBOARD dashboards, templates and reports gallery: Facebook engagement metrics in social media dashboard

FACEBOOK SOCIAL MEDIA DASHBOARD TEMPLATE - ENGAGEMENT

Facebook Engagement metrics for Marketing Agency client dashboard
Click for details...
OCTOBOARD dashboards, templates and reports gallery: Youtube engagement metrics for social media template

YOUTUBE ENGAGEMENT

Youtube social media dashboard: Engagement metrics.
Click for details...
OCTOBOARD dashboards, templates and reports gallery: Social media reporting with twitter metrics

TWITTER OVERVIEW

Twitter social media dashboard: reach and engagement metrics.
Click for details...
OCTOBOARD dashboards, templates and reports gallery: Linkedin engagement template

LINKEDIN ENGAGEMENT

LinkedIn engagement metrics and user actions.
Click for details...
OCTOBOARD dashboards, templates and reports gallery: Youtube popularity template

YOUTUBE OVERVIEW

Youtube account popularity metrics - latest videos, watch time, total subscribers and others
Click for details...
OCTOBOARD dashboards, templates and reports gallery: Facebook reach social media dashboard

FACEBOOK SOCIAL MEDIA TEMPLATE - REACH

Facebook Social metrics for Marketing Agency clients - Reach