Facebook Social Media Dashboard - Overview: Building Real-Time Social Media Dashboards with Octoboard
Discover the power of Octoboard's Facebook Social Media dashboard in this comprehensive blog post.

FACEBOOK SOCIAL MEDIA DASHBOARD - OVERVIEW
Key Facebook dashboard metrics for Marketing Agencies and Clients
Building Real-Time Social Media Dashboards: Facebook Social Media Dashboard - Overview
In the rapidly evolving digital age, the importance of social media for businesses cannot be overstated. Facebook, with its vast user base, offers a goldmine of data for marketing teams to analyze and act upon. However, the sheer volume of data can be overwhelming, and that's where the power of analytics platforms like Octoboard comes into play. By leveraging the Facebook data through cloud data APIs, Octoboard helps marketing teams automate the creation of real-time social media dashboards, providing invaluable insights into their marketing efforts. This blog post delves into how utilizing specific Facebook metrics and integrating them into a comprehensive dashboard can transform your marketing strategy.
Understanding Facebook Metrics for Comprehensive Insights
The Octoboard analytics platform focuses on a range of Facebook metrics that are pivotal for marketing teams to stay updated with their social media progress. Let's explore how these metrics can be leveraged:
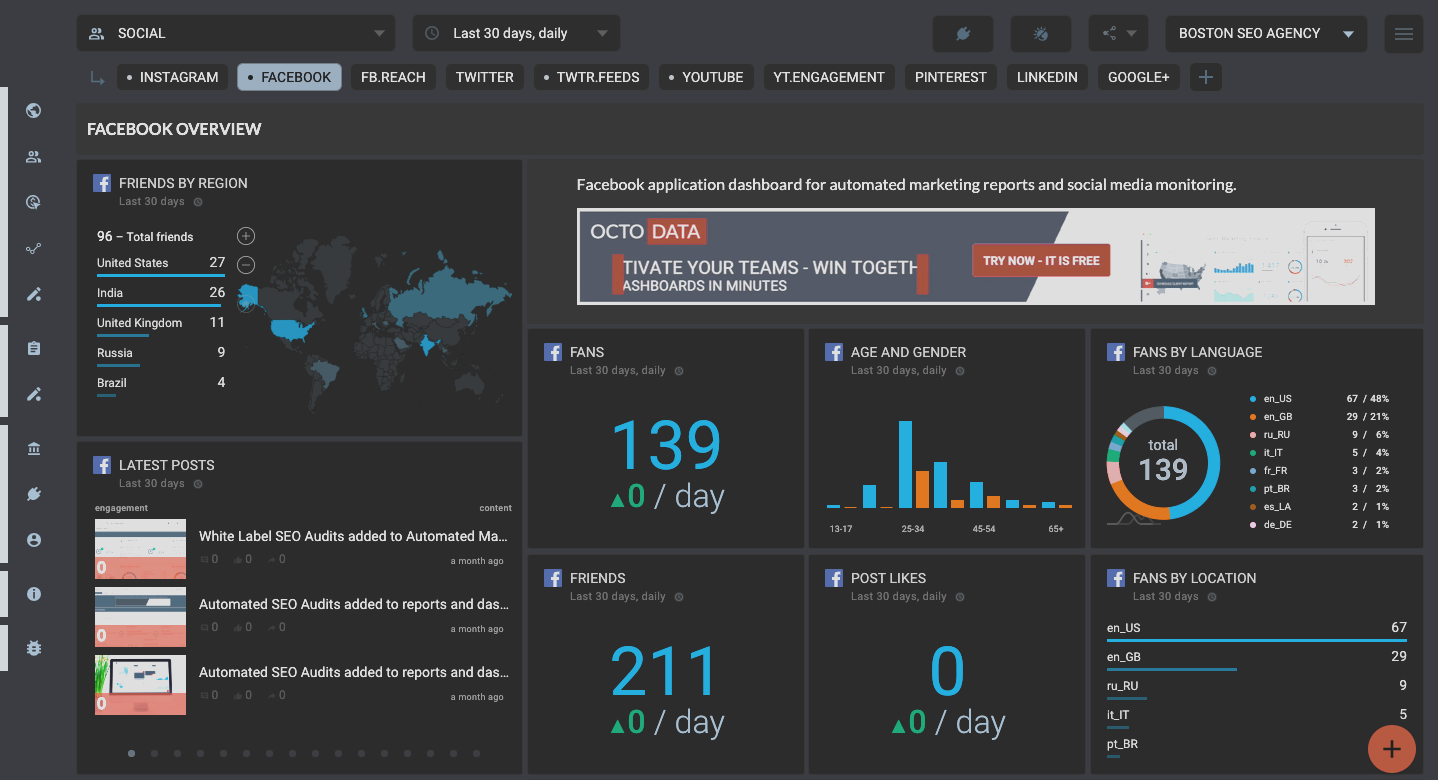
- **Facebook Overview**: A snapshot of your overall Facebook performance, including likes, shares, engagement, and reach. This metric offers a quick health check of your social media efforts.
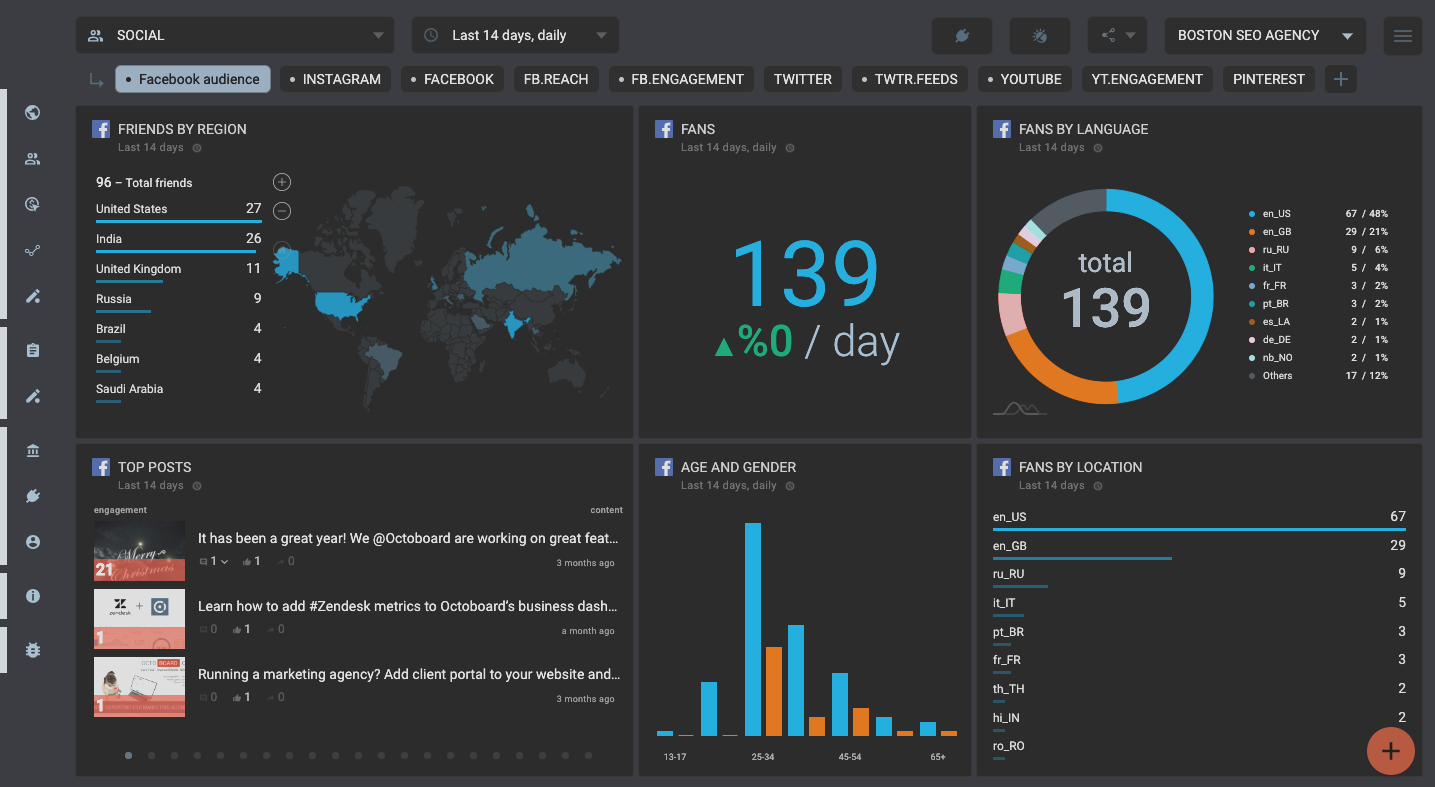
- **Facebook Fans by Country Map**: Understanding the geographic distribution of your fans can help tailor content to specific audiences, ensuring higher engagement rates.
- **Facebook Fans Series**: Tracking the growth or decline in your fan base over time helps in assessing the effectiveness of your marketing strategies.
- **Facebook Pages Likes Daily**: Monitoring daily fluctuations in page likes provides insights into what content resonates best with your audience.
- **Facebook Engagement Rate**: Engagement rate is a critical metric that measures how actively involved your audience is with your content, a key indicator of your content's success.
- **Facebook Shares**: The number of shares indicates the virality of your content. High share counts mean that your audience finds your content valuable enough to spread within their network.
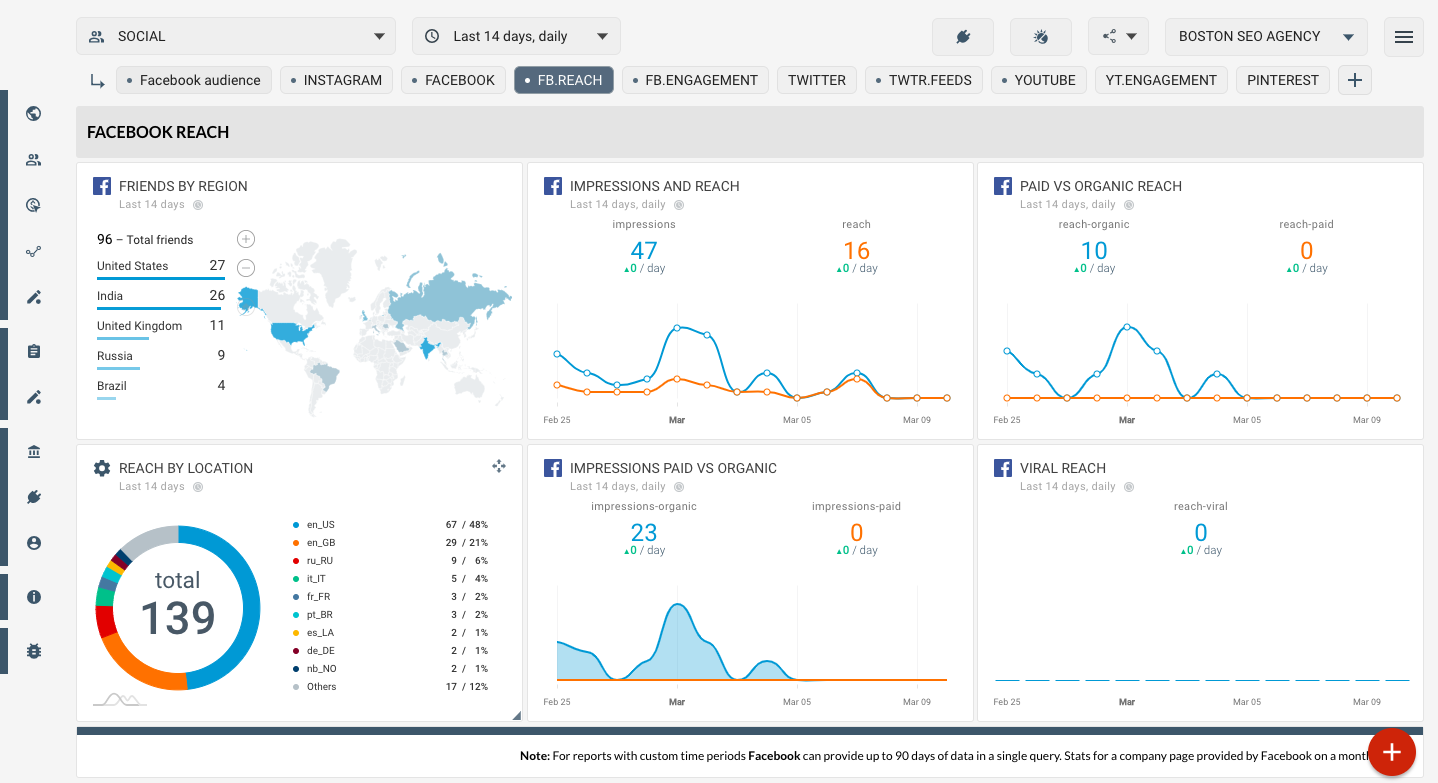
- **Facebook Organic vs Paid**: Differentiating between organic and paid reach helps in understanding the impact of your ad spend versus organic marketing efforts.
- **Facebook Impressions Likes**: Analyzing impressions and likes together can offer insights into how often your content is seen and how well it's received.
The Power of Automation in Social Media Dashboards
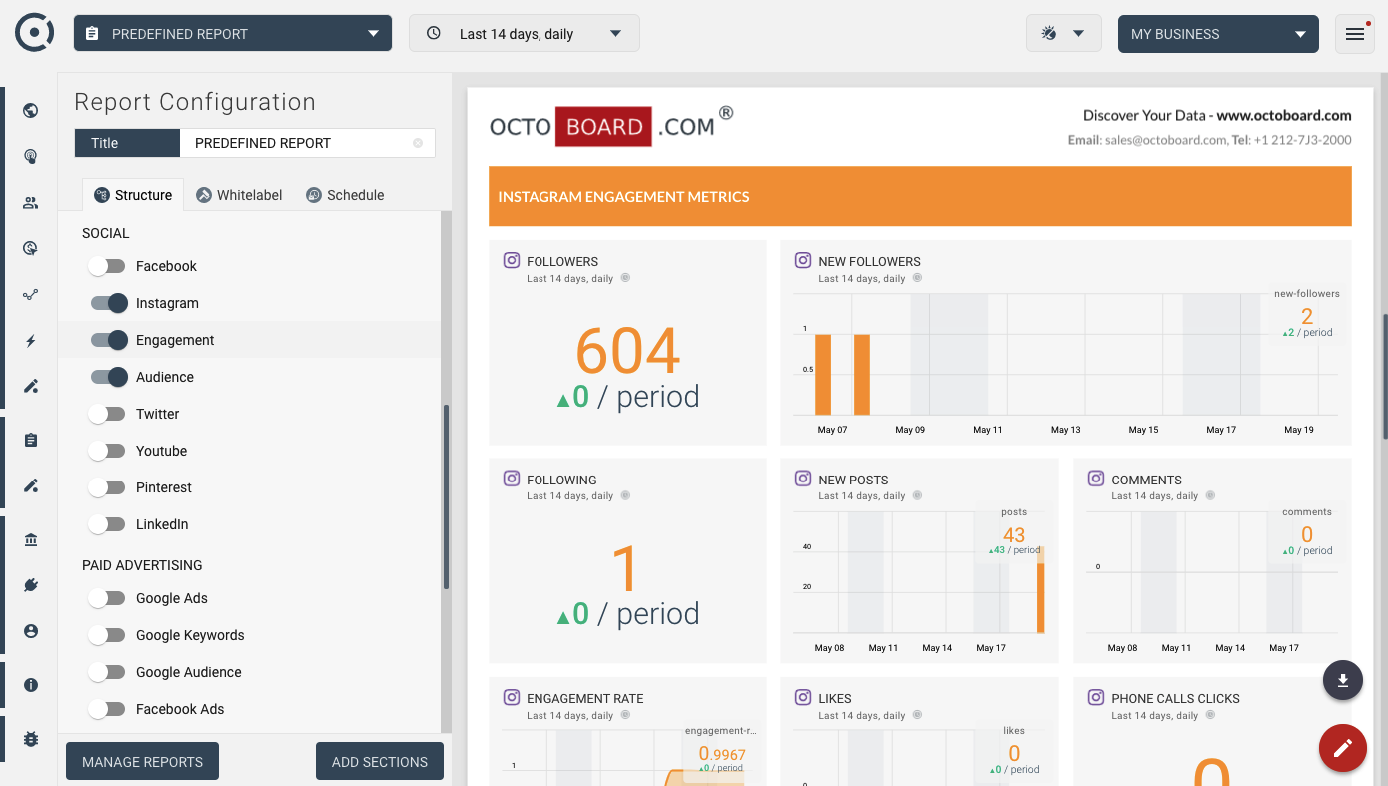
Octoboard's marketing analytics platform revolutionizes how marketing teams approach social media data analysis. By automating the creation of social media dashboards, Octoboard saves hundreds of hours that would otherwise be spent manually compiling and interpreting data. This automation enables marketing teams to focus more on strategy and less on the intricacies of data management.
Displaying a real-time Facebook dashboard in the office not only provides visibility into the effectiveness of social media efforts but also fosters a culture of data-driven decision making. It allows teams to quickly identify trends, adjust strategies on the fly, and celebrate successes together.
The Importance of Monitoring Facebook Metrics
Monitoring Facebook metrics is crucial for several reasons. It enables marketing teams to:
- Measure the ROI of their social media campaigns.
- Understand audience behavior and preferences.
- Optimize content for better engagement.
- Track competitor performance and market trends.
In essence, keeping a close eye on these metrics ensures that marketing efforts are aligned with business goals and audience needs.
Consolidating PPC Reporting with Octoboard
Beyond Facebook, marketing teams often juggle multiple PPC channels, each generating vast amounts of data. Octoboard's analytics platform simplifies this complexity by bringing all PPC reporting into one place. This consolidation is vital for several reasons:
- It provides a holistic view of advertising efforts across channels.
- It saves time and reduces the likelihood of errors in reporting.
- It enables easier comparison and analysis of performance across different platforms.
Octoboard's advanced PPC Analytics module further enhances this by allowing marketing teams to build new metrics, dimensions, and utilize advanced formulas. This capability is particularly beneficial for marketing agencies managing campaigns across different locations and currencies, enabling them to deliver tailored reports that drive decision-making.
Automating Data Detection of Trends with Octoboard
In the world of digital marketing, staying ahead means being able to quickly identify and act on emerging trends. Octoboard's automated data insights feature, powered by ChatGPT/OpenAI, offers a competitive edge by automating the detection of trends using the Facebook metrics mentioned earlier. This capability ensures that marketing agencies and teams are not just monitoring their activity but are also proactively identifying opportunities and threats in real-time, making data-driven decisions to optimize their social media strategies.
Leveraging Google Sheets for Enhanced Data Management
The Octoboard Google Sheets add-on is another feature that underscores the platform's commitment to simplifying data management for marketing teams. By enabling the export of Facebook data to Google Sheets, teams can further manipulate and analyze their data in a familiar environment. This feature is particularly useful for creating custom reports, sharing insights with stakeholders, and conducting deep-dive analyses that might not be possible within the dashboard interface alone.
Conclusion
In a landscape where social media's importance continues to grow, leveraging the right tools and metrics is paramount for success. Octoboard's comprehensive analytics platform, with its focus on automating and simplifying the creation and monitoring of social media dashboards, provides marketing teams with the insights needed to drive their Facebook strategies forward. By focusing on critical metrics, integrating PPC reporting, and utilizing advanced data analysis features, marketing teams can save time, optimize strategies, and ultimately, achieve better outcomes in their social media endeavors.
Octoboard customers who created this report also used the following data templates:
IG Overview - (Depreciated)
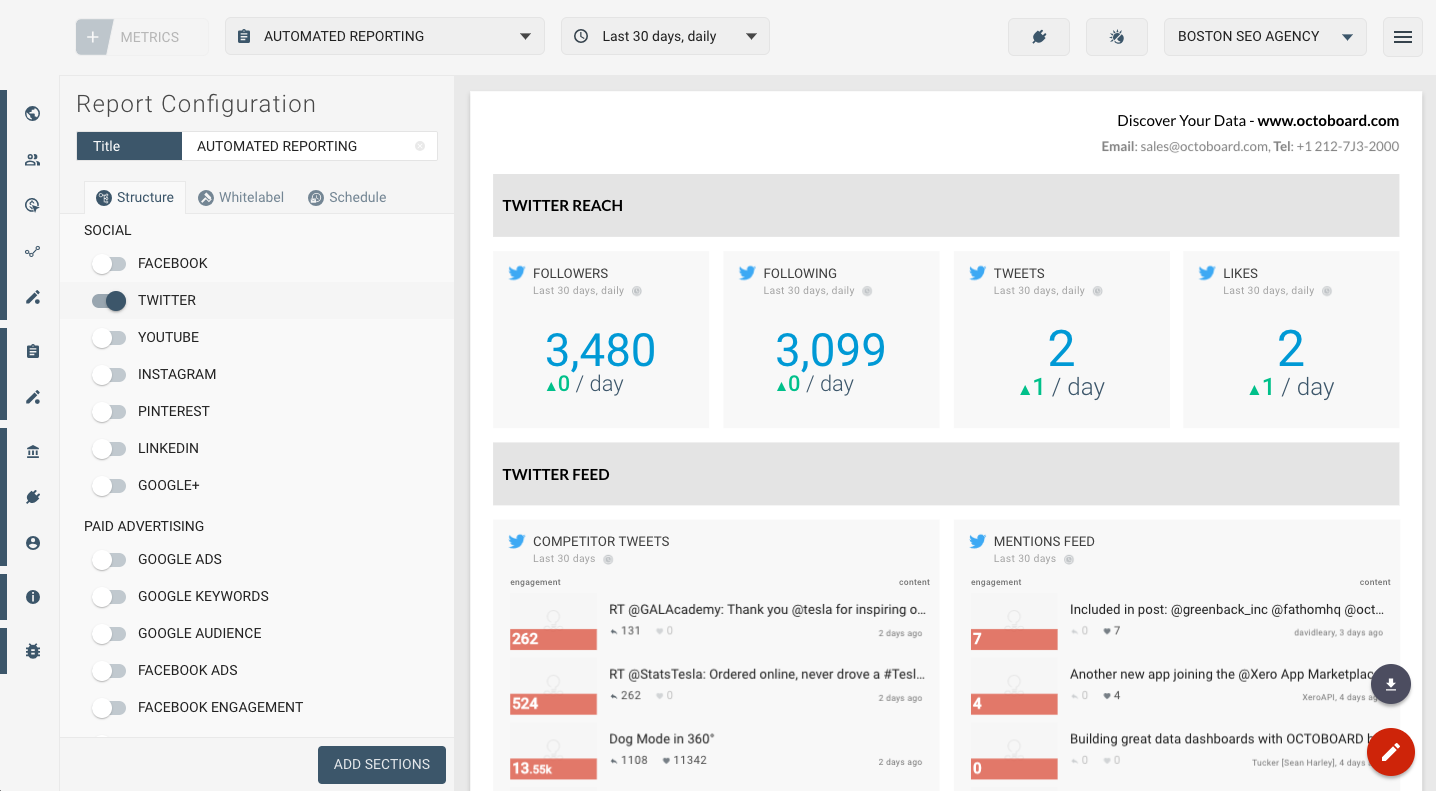
Twitter Overview (Report)
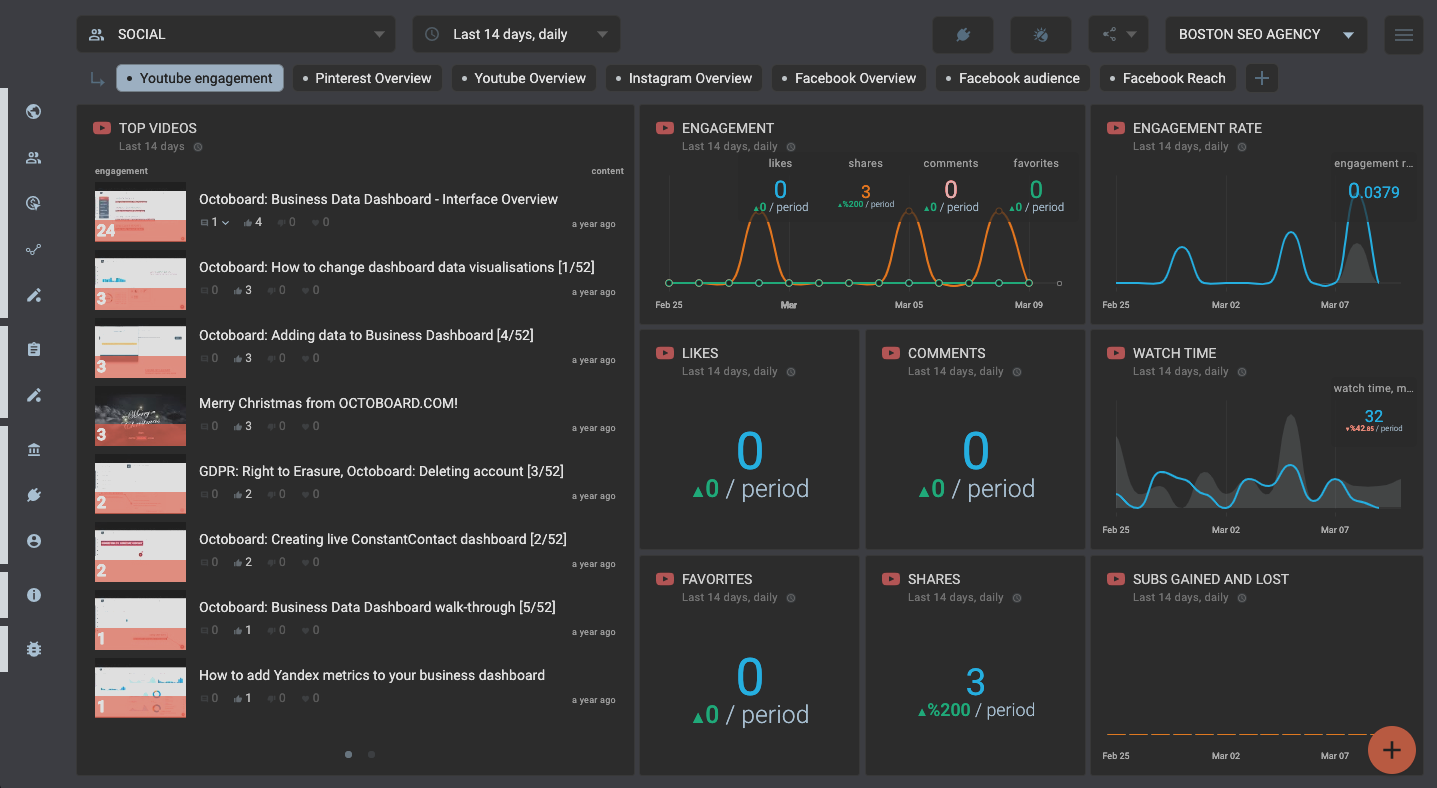
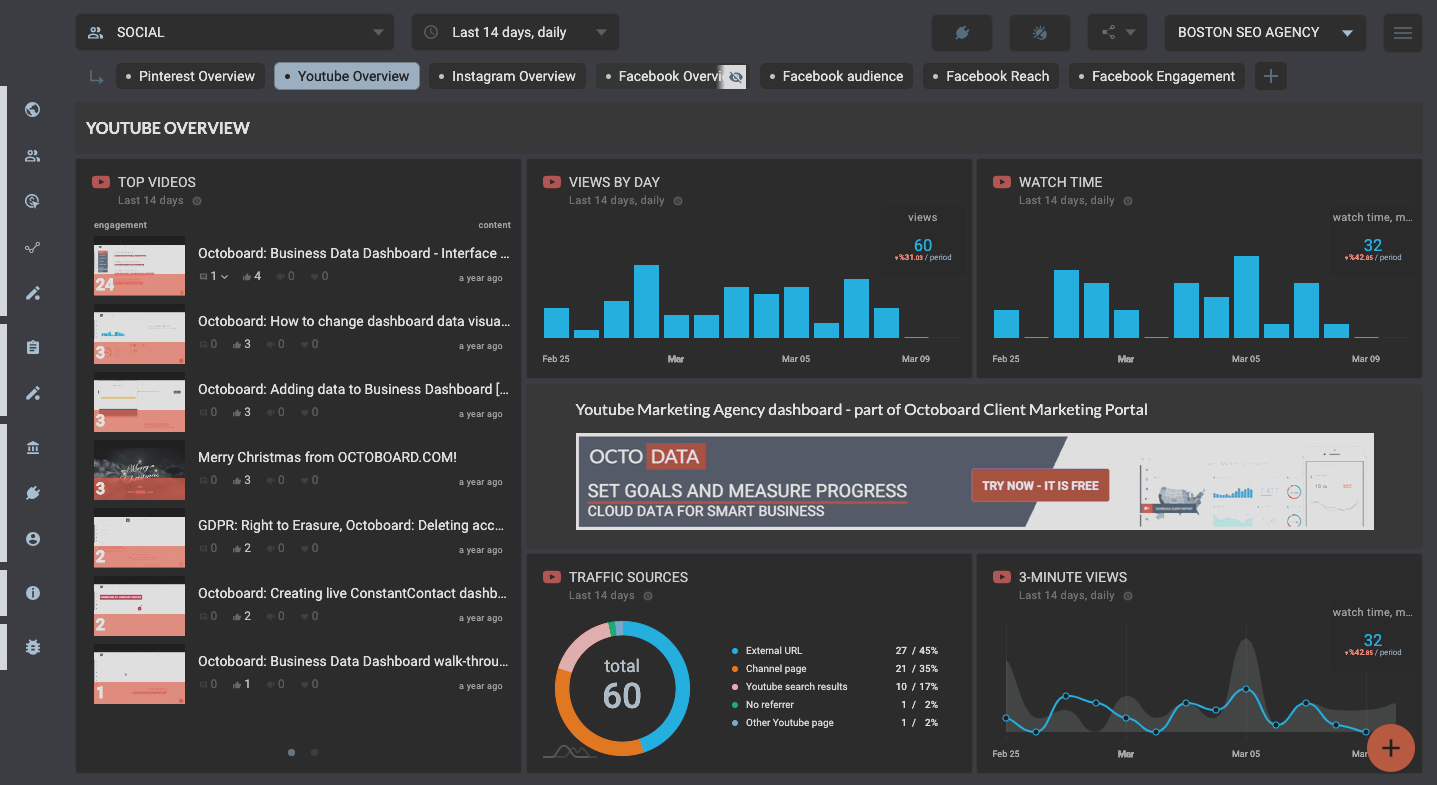
Youtube Engagement
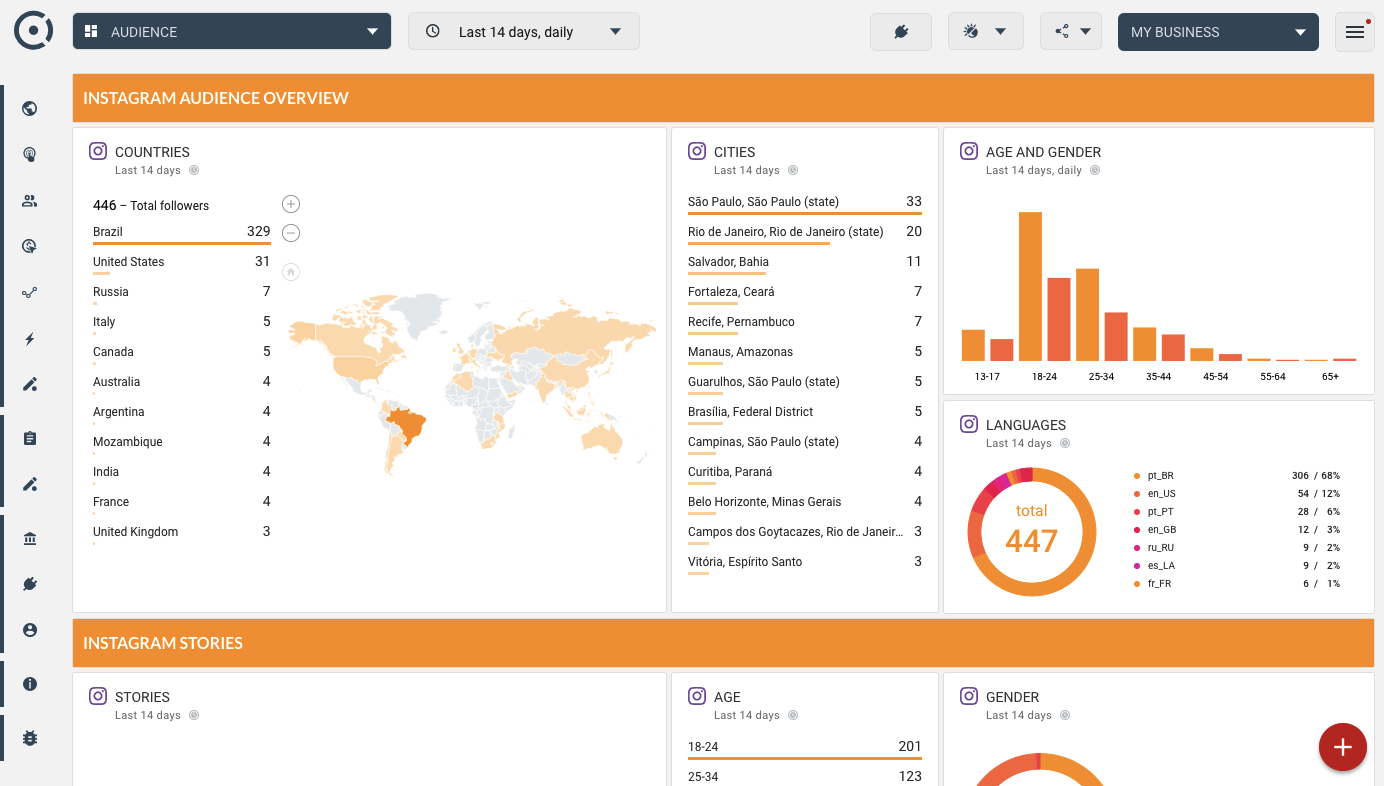
Instagram Audience
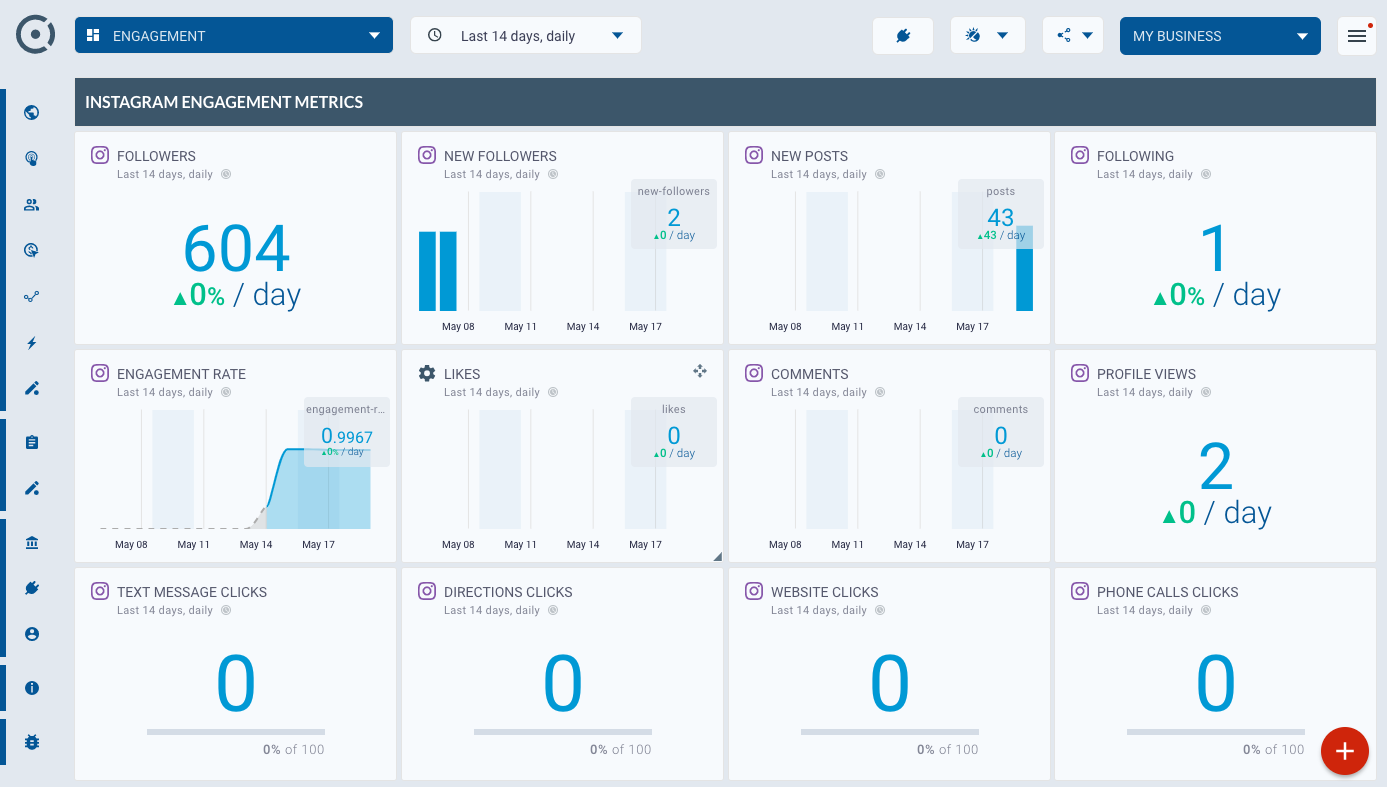
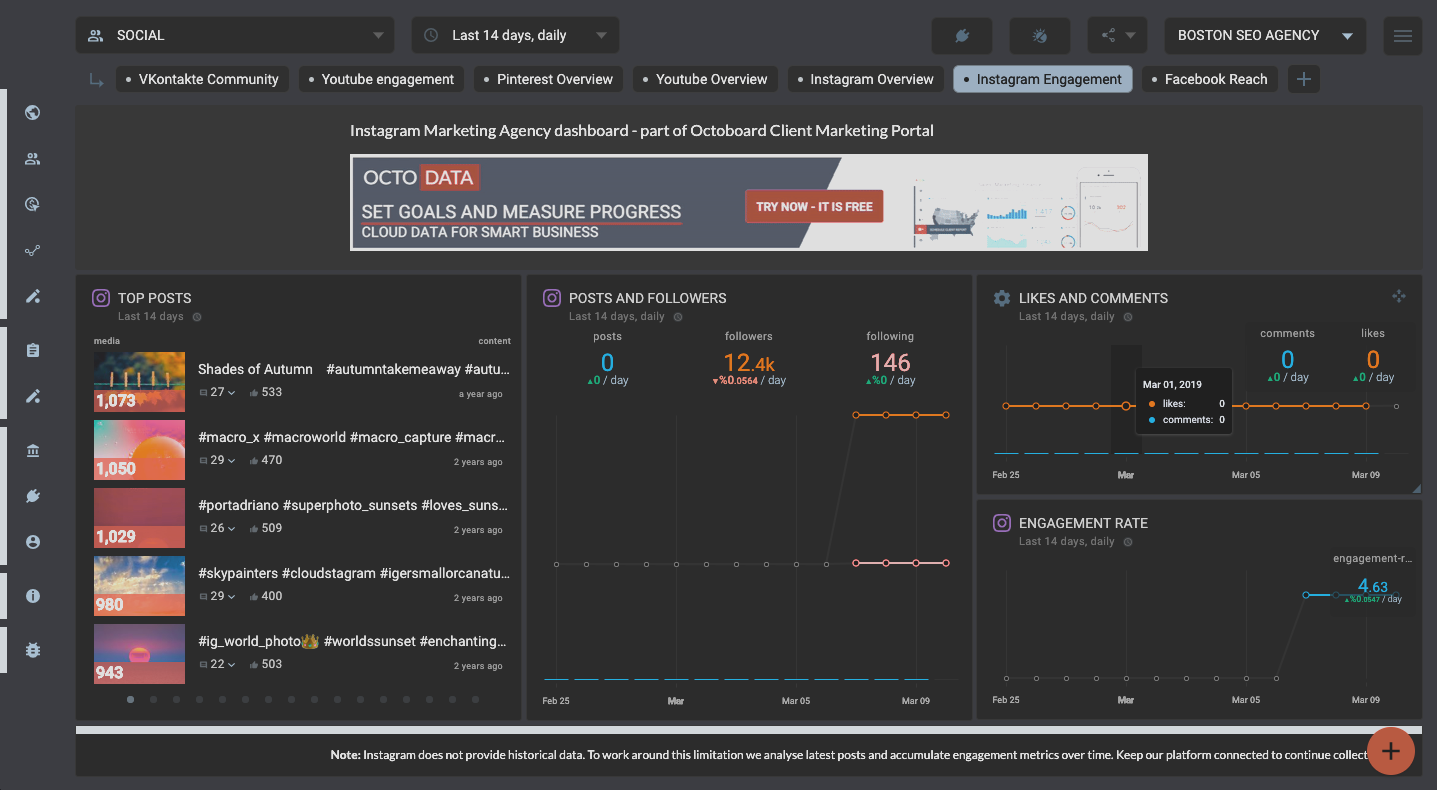
Instagram Engagement
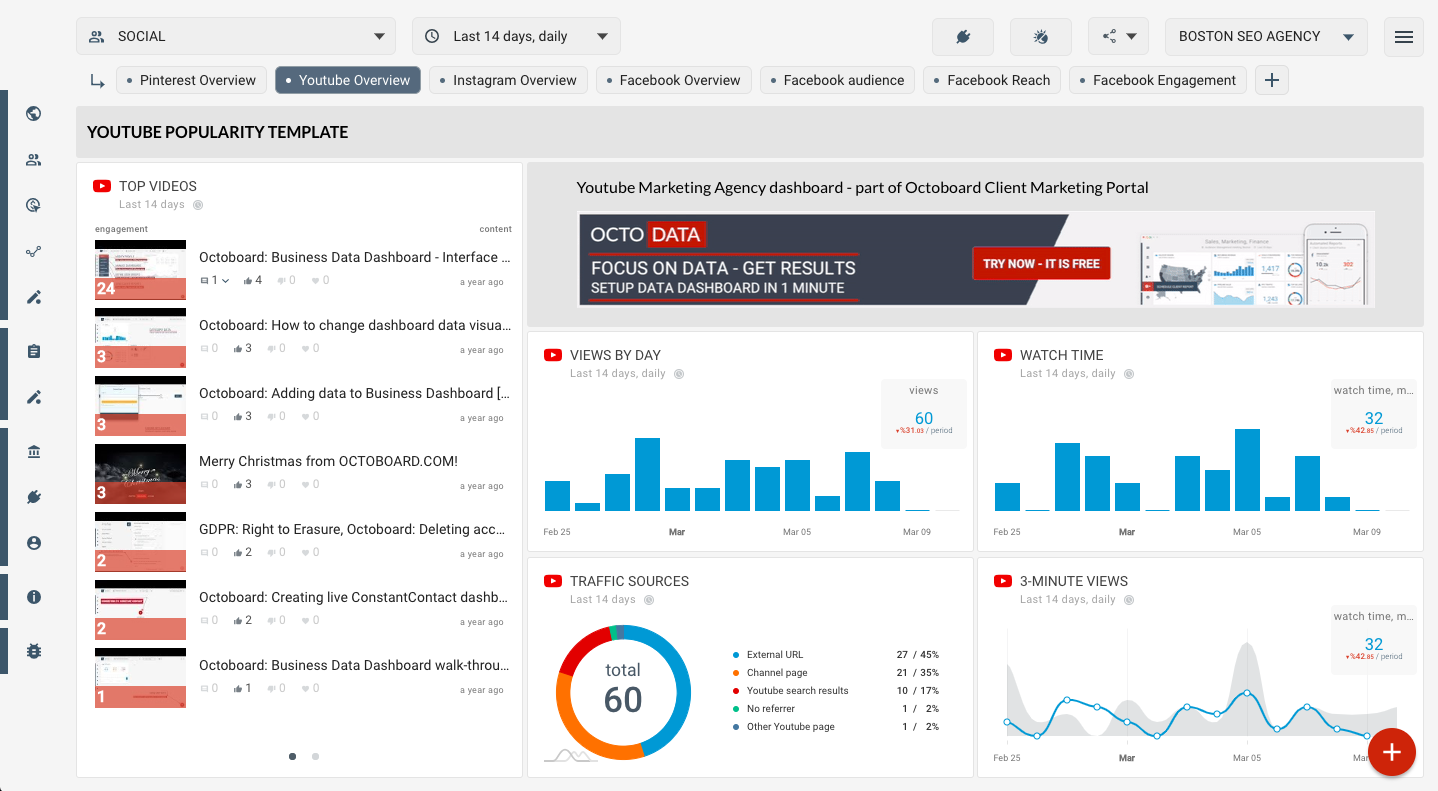
Youtube Overview
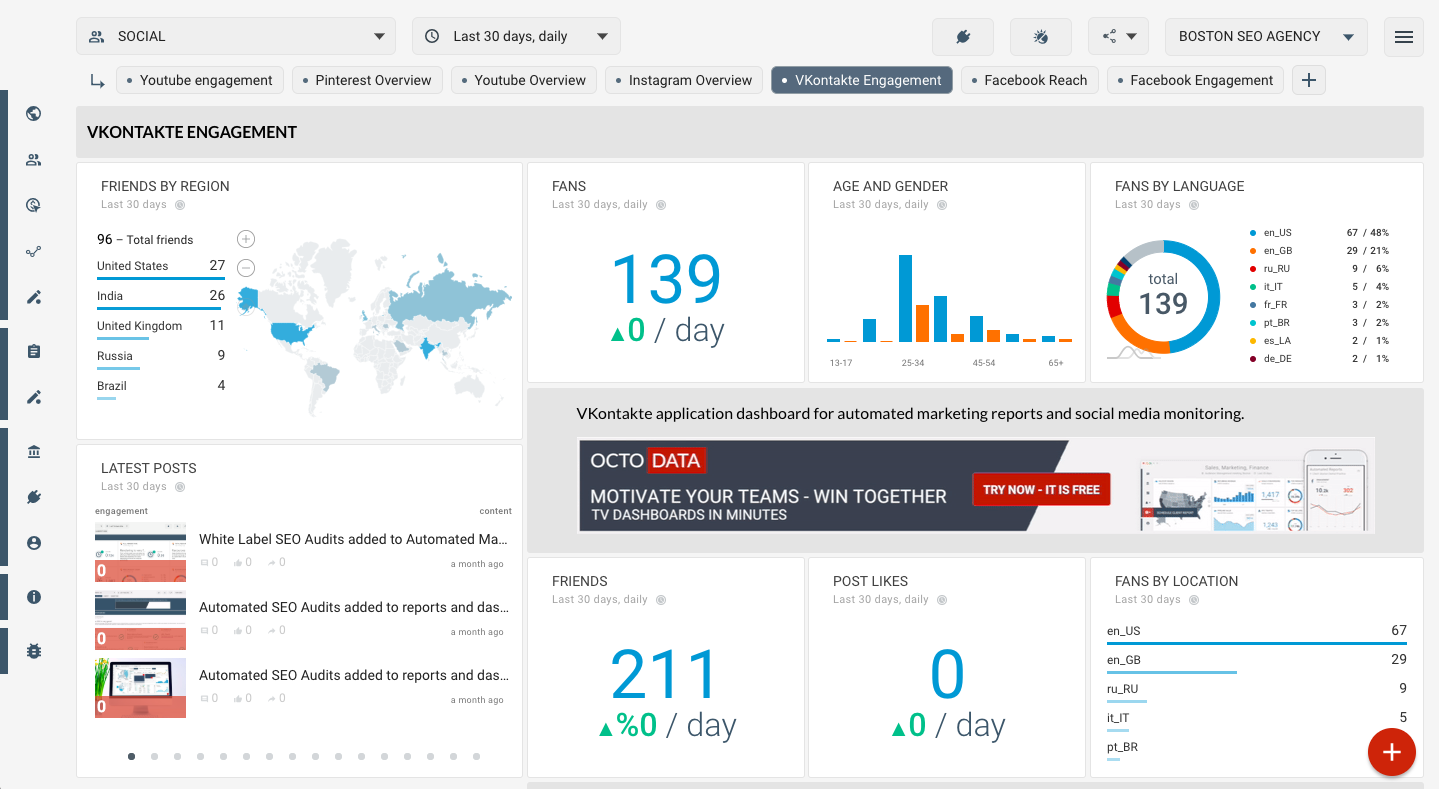
VKontakte Engagement

Facebook Reach
Instagram Engagement (Report)
Facebook Social Media template - Reach
Facebook Audience