Maximizing Facebook Reach: Key Metrics and Insights for Marketing Success
Improve your Facebook reach and engagement with Octoboard's Facebook Reach Monitoring dashboard.

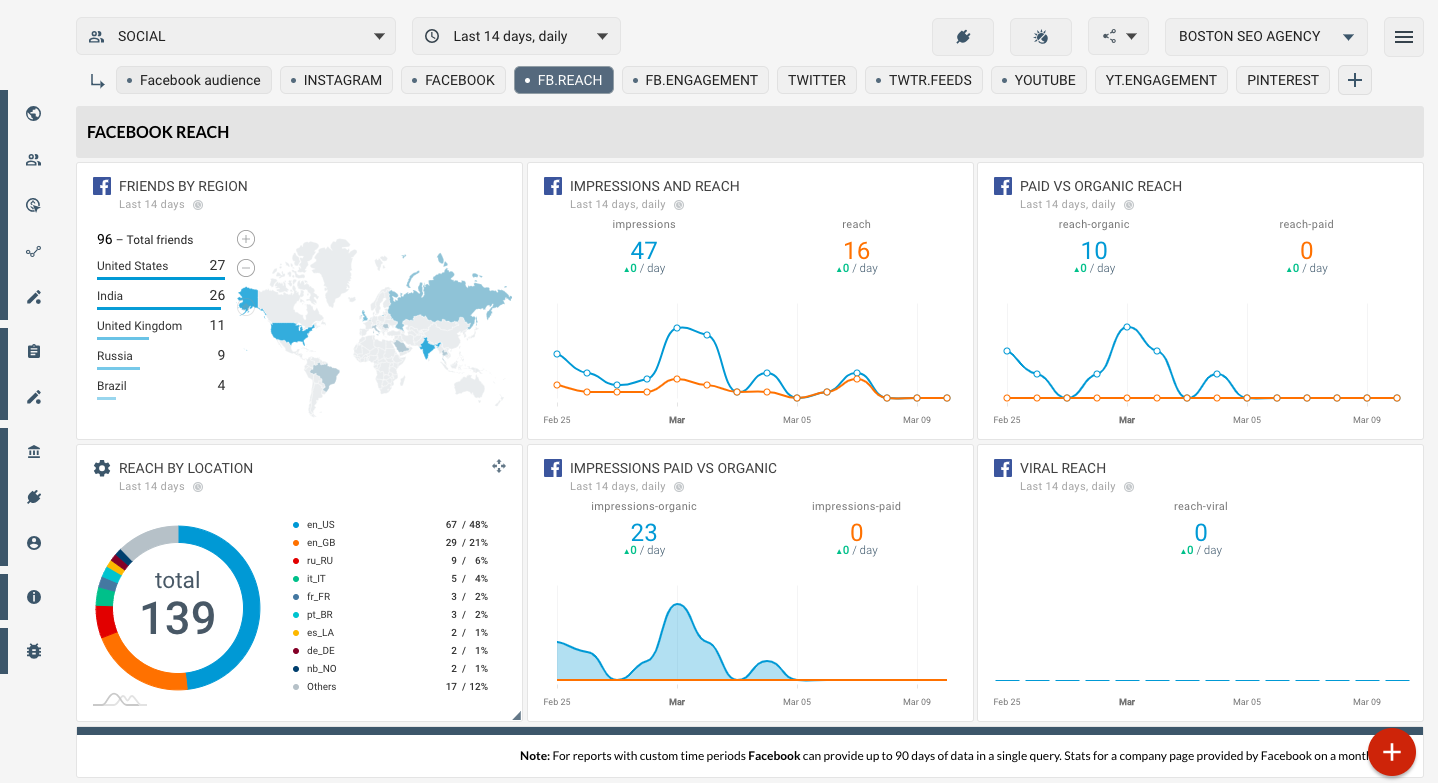
FACEBOOK REACH
Group of Facebook metrics covering content and reach (paid, organic, viral).
Social media has become an essential tool for businesses and marketers to reach and engage with their target audience. With the popularity of platforms like Facebook soaring, it is crucial for marketing teams and online businesses to have a comprehensive understanding of their social media performance. That's where an online dashboard like Octoboard comes in.
Key Metrics: Facebook Fans by Country Map
One of the key metrics provided by the Facebook Reach Monitoring dashboard is the Facebook Fans by Country Map. This metric allows marketing teams and online businesses to visualize where their Facebook fans are located geographically. Understanding the distribution of fans across different countries provides valuable insights into target audience demographics and helps tailor marketing strategies accordingly. For example, if a majority of fans are based in a specific country, it may be beneficial to localize content or run targeted ad campaigns in that region.
Key Metrics: Facebook Impressions Reach
Another important metric on the dashboard is Facebook Impressions Reach. This metric measures the total number of times a post from a Facebook page has been seen by users. It helps marketers gauge the overall visibility and reach of their content. By monitoring impressions reach, marketing teams can identify which posts are performing well and resonating with the audience. This information can then be used to optimize content and drive engagement.
Key Metrics: Facebook Reach Demographic
Understanding the demographic breakdown of Facebook reach is crucial for effective targeting. The Facebook Reach Demographic metric on the dashboard provides insights into the age, gender, and other demographic attributes of the audience reached by a Facebook page. This information allows marketers to analyze whether their content is reaching the intended target audience and make adjustments if necessary. By tailoring content to specific demographic groups, marketing teams can optimize their messaging and improve overall engagement.
Key Metrics: Facebook Reach Paid vs Organic
In today's competitive digital landscape, businesses often leverage paid advertising to increase their reach on social media platforms. The Facebook Reach Paid vs Organic metric provides a clear distinction between the reach generated through paid promotions and organic means. This metric enables marketing teams to evaluate the effectiveness and ROI of their paid advertising campaigns compared to organic reach. By monitoring this metric, businesses can make informed decisions on allocating their marketing budgets and optimizing their strategies for maximum impact.
Key Metrics: Facebook Referrers
The Facebook Referrers metric provides valuable insights into how users are finding a Facebook page. It tracks the sources from which users are being referred to the page, such as direct traffic, external websites, or search engines. This information allows marketing teams to identify the most effective channels for driving traffic to their Facebook page. By understanding the referrers, businesses can optimize their marketing efforts and allocate resources to channels that yield the highest engagement and conversions.
Key Metrics: Facebook Impressions Reach Engagement
While reach is crucial, engagement is equally important for the success of a social media strategy. The Facebook Impressions Reach Engagement metric helps marketing teams measure the level of interaction and involvement from their audience. It provides insights into metrics such as likes, comments, and shares generated by a post's reach. By tracking engagement, businesses can evaluate the effectiveness of their content and identify what resonates best with their audience. This knowledge can then be utilized to craft more engaging and shareable content, ultimately increasing brand awareness and driving conversions.
Key Metrics: Facebook Viral Reach and Facebook Organic vs Paid
The Facebook Viral Reach metric measures the number of people who saw a post from a page through a story published by a friend. This metric indicates the extent to which a post is being shared and circulated organically within the Facebook community. Monitoring viral reach helps marketing teams identify the success of their content in generating word-of-mouth promotion and organicgrowth.
Additionally, the Facebook Organic vs Paid metric provides a breakdown of the reach generated through organic means versus paid promotions. This metric allows marketing teams to compare the effectiveness of their organic content and paid advertising campaigns. By monitoring this metric, businesses can determine the value of investing in paid promotions and assess the impact of organic reach on their overall social media performance.
The Need for Automated Data Analytics
While the importance of these metrics is clear, manually collecting and analyzing data from various sources can be time-consuming and prone to errors. This is where an automated data analytics platform like Octoboard becomes invaluable. Octoboard enables marketing teams and online businesses to streamline their data collection process, automatically generate reports, and visualize key metrics in an easily digestible format.
By using Octoboard, marketing teams can save valuable time and resources, allowing them to focus on interpreting data and making data-driven decisions. The automated nature of the platform ensures that reports are always up-to-date and accurate, providing real-time insights into social media performance. This level of efficiency and accuracy is crucial for marketing teams and online businesses to stay ahead of the competition and maximize their ROI.
The Facebook Reach Monitoring dashboard, provided by Octoboard, is a powerful tool for marketing teams and online businesses. It offers a comprehensive view of social media performance on Facebook, with key metrics such as Facebook Fans by Country Map, Facebook Impressions Reach, Facebook Reach Demographic, Facebook Reach Paid vs Organic, Facebook Referrers, Facebook Impressions Reach Engagement, Facebook Viral Reach, and Facebook Organic vs Paid. By leveraging the insights provided by these metrics, marketing teams can optimize their strategies, enhance engagement, and drive business success. The automated nature of Octoboard ensures efficiency and accuracy in data analytics, allowing marketing teams to focus on making informed decisions and achieving their goals in the dynamic world of social media marketing.
Octoboard customers who created this report also used the following data templates:
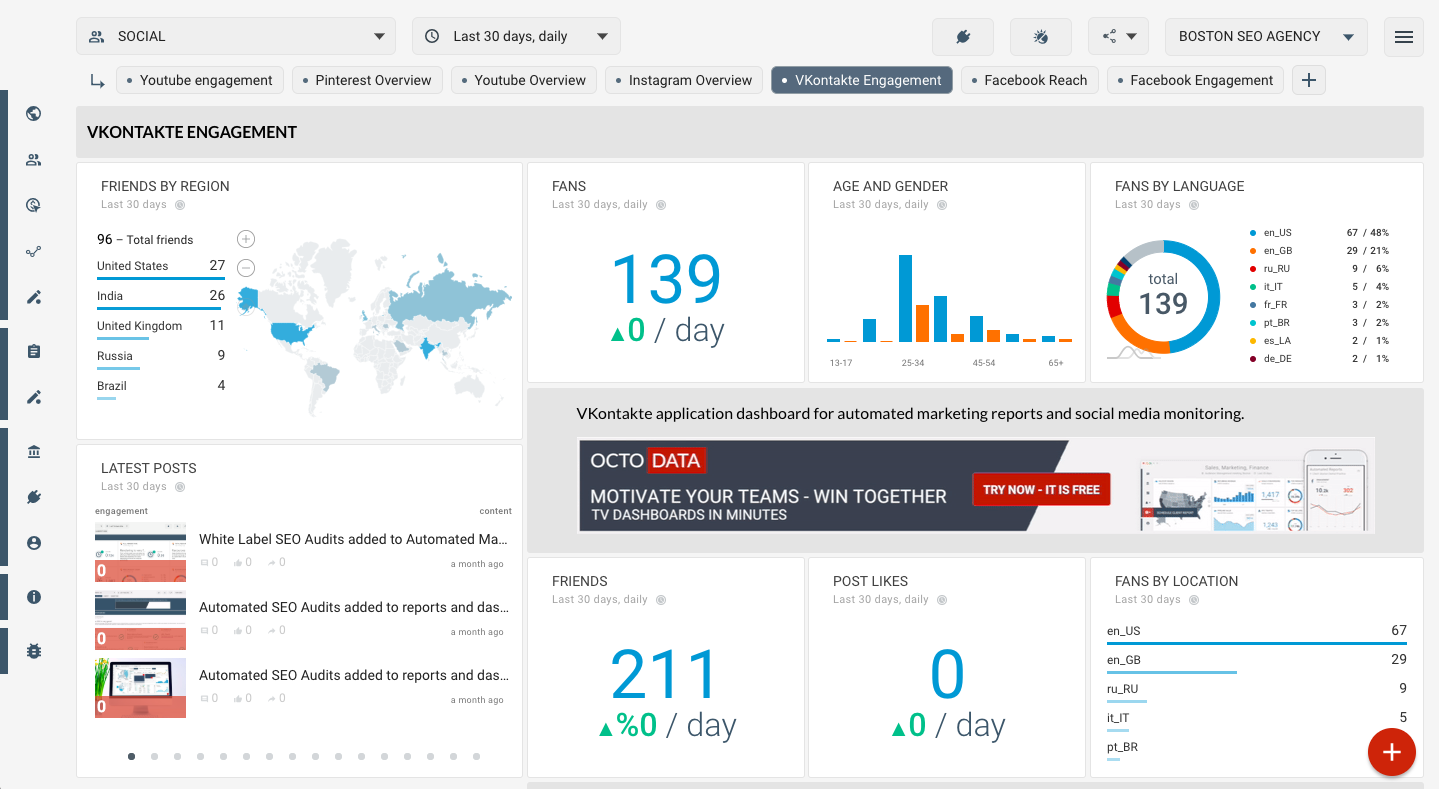
VKontakte Engagement
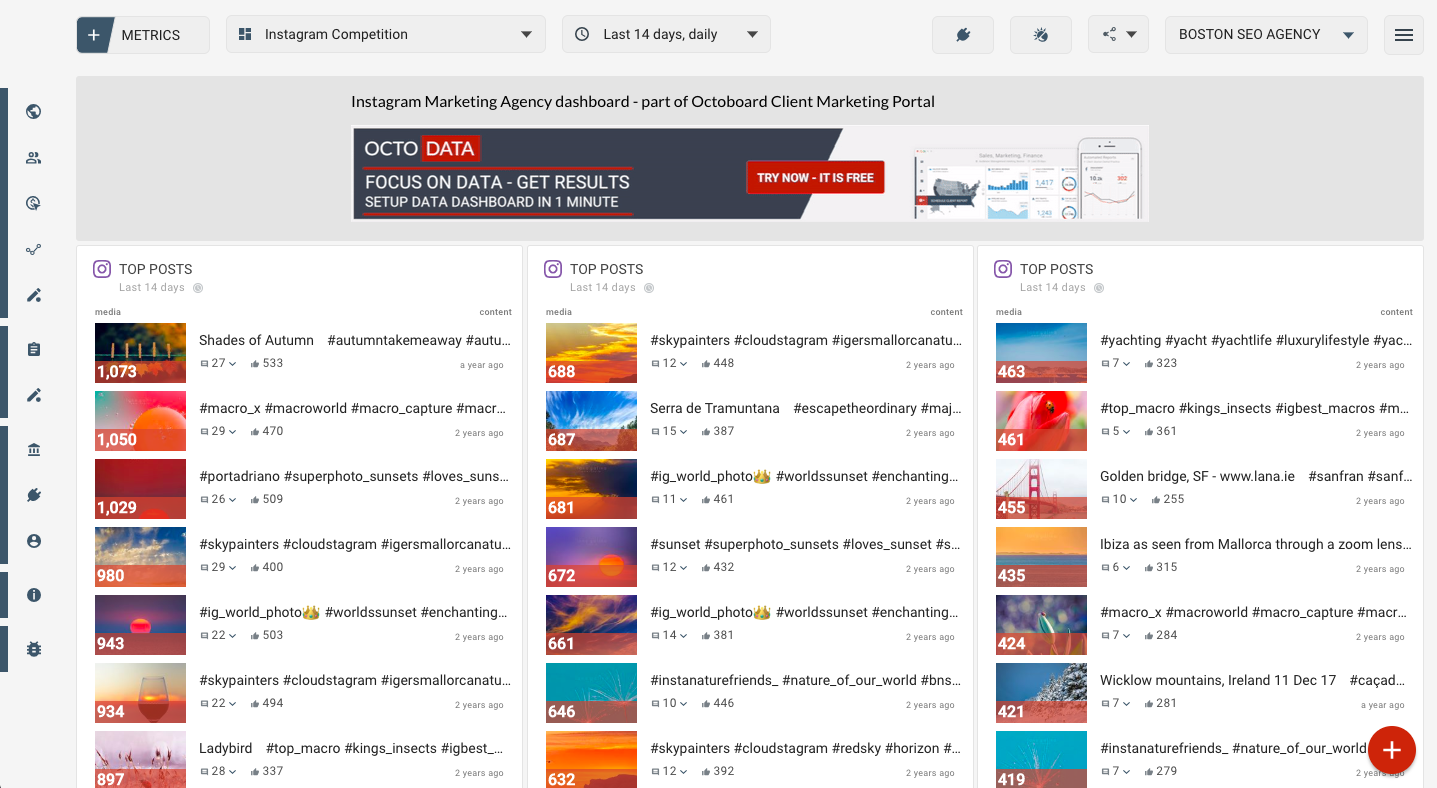
IG Competition - (Depreciated)
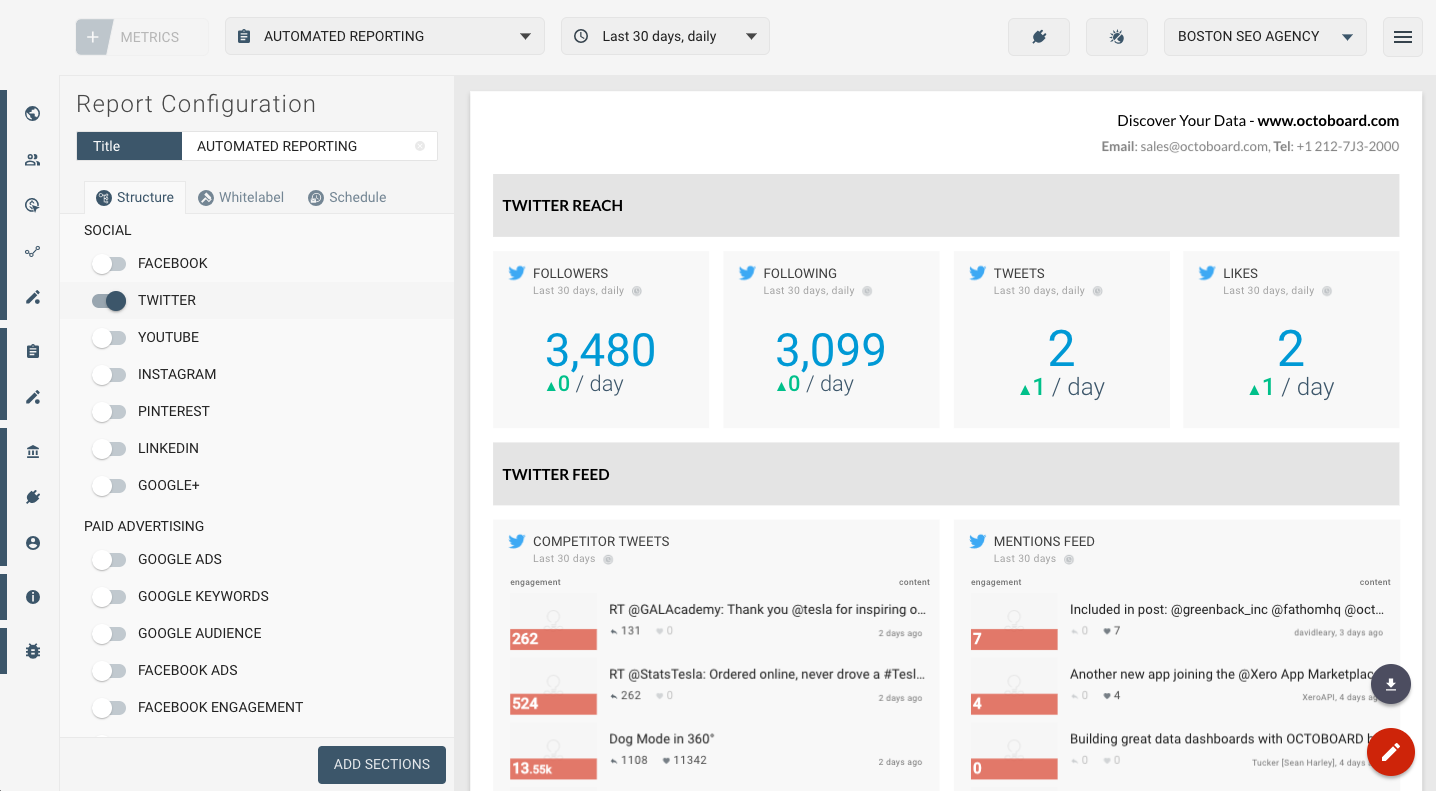
Twitter Overview (Report)
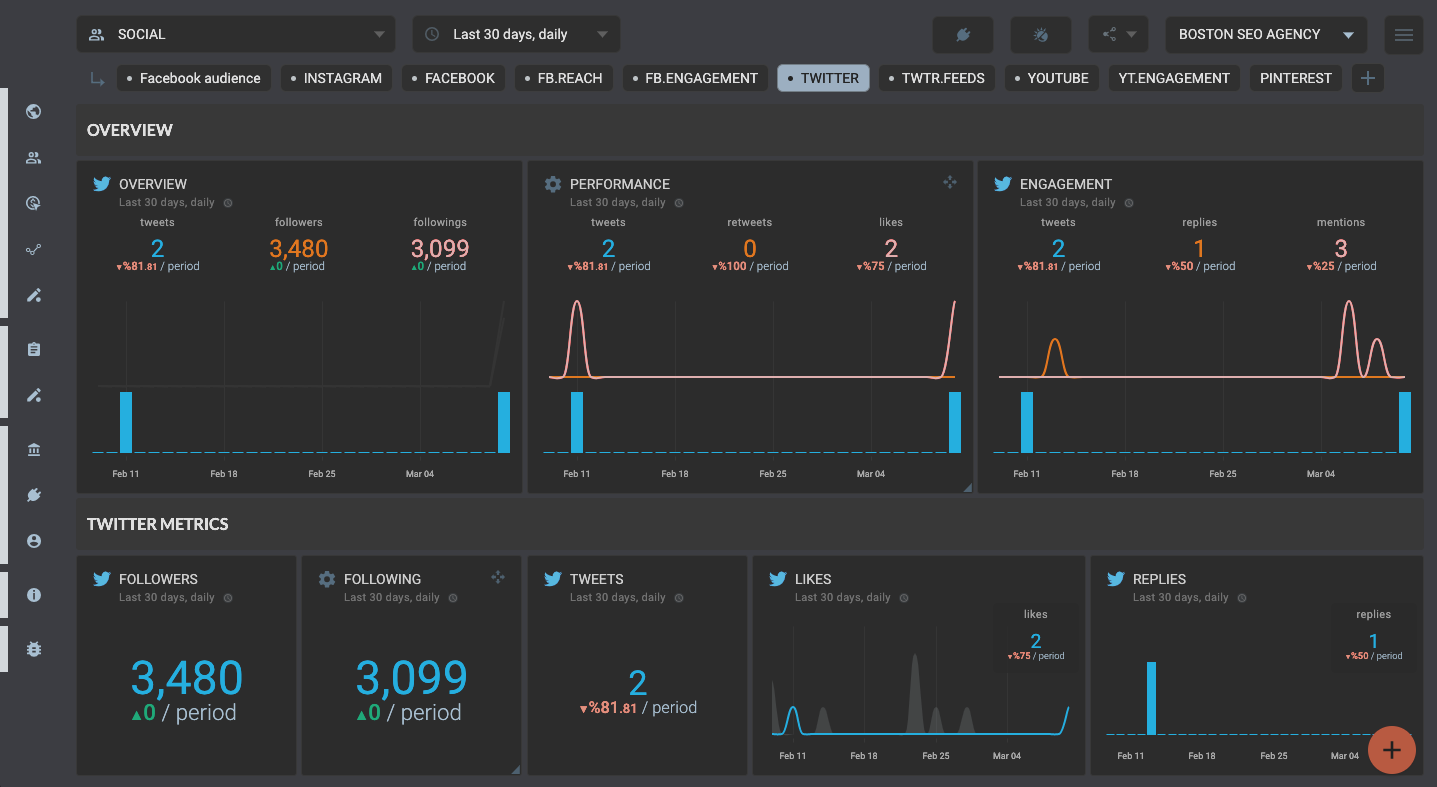
Twitter Metrics
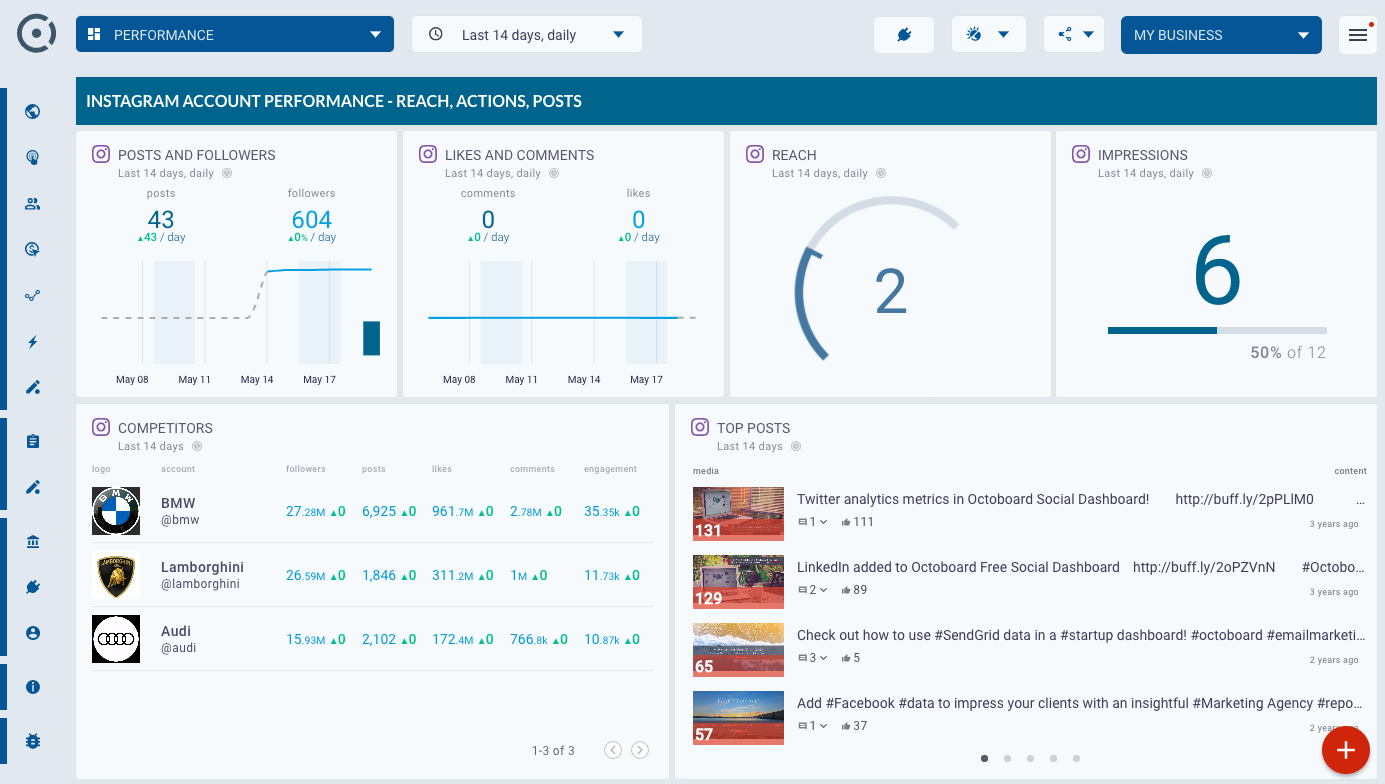
Instagram Performance
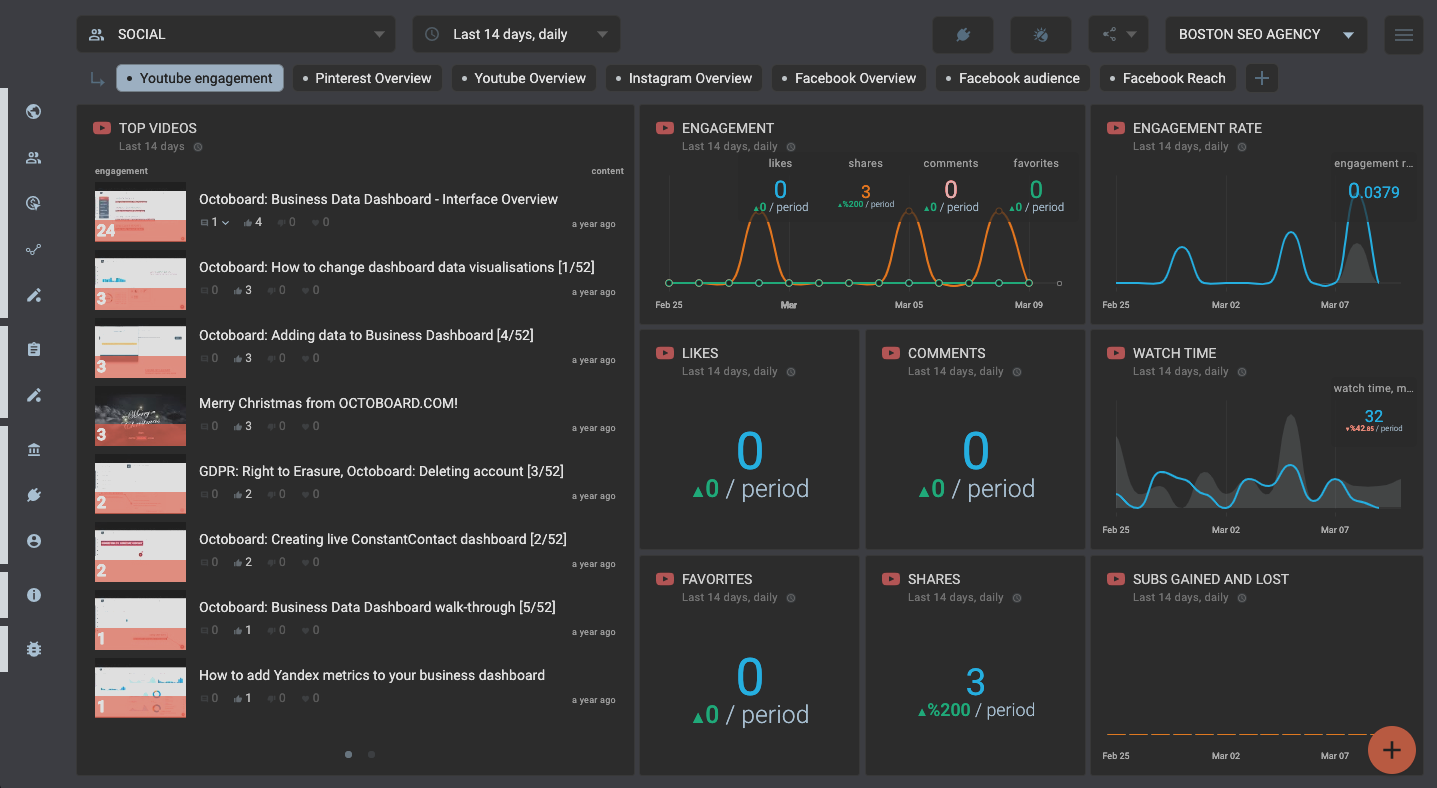
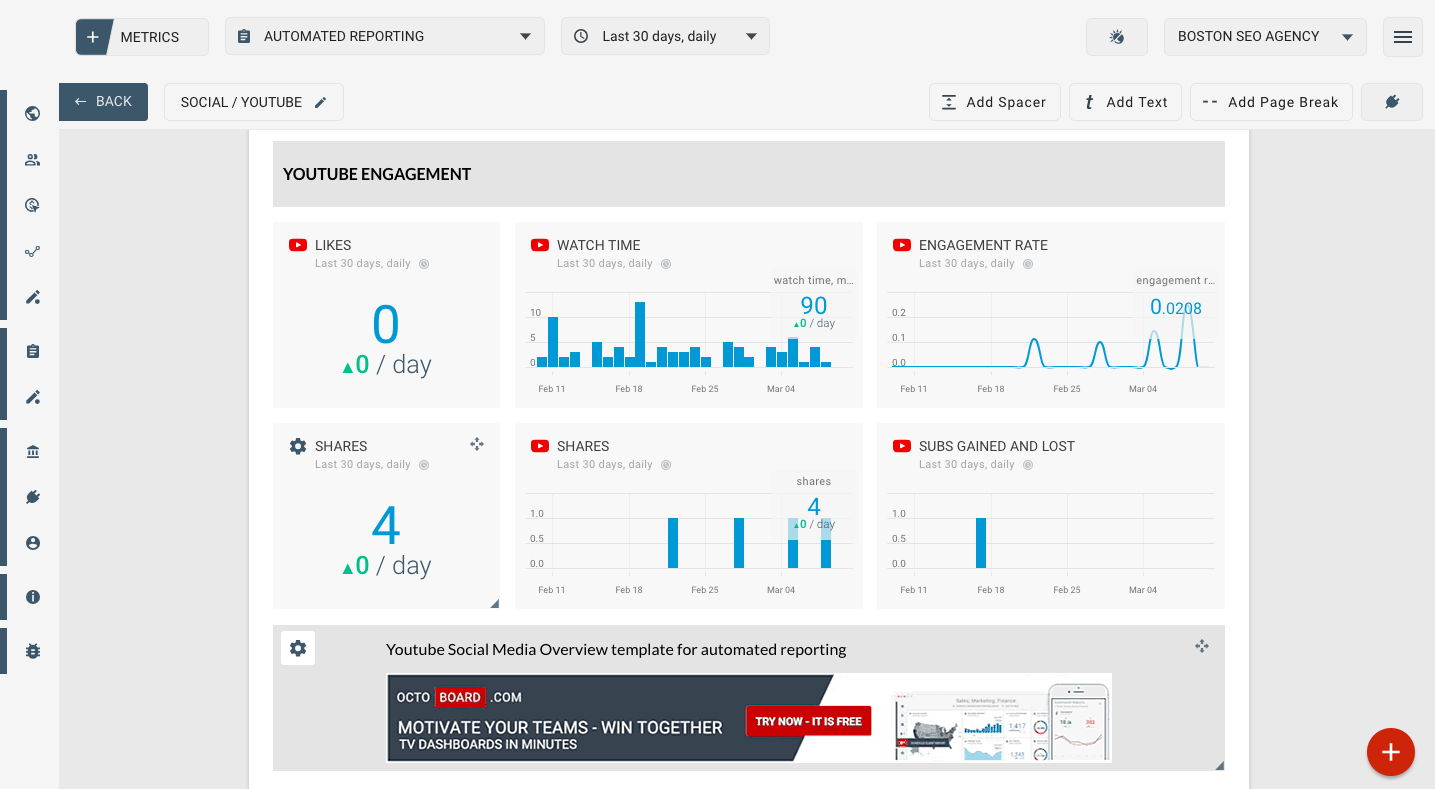
Youtube Engagement
Facebook Reach
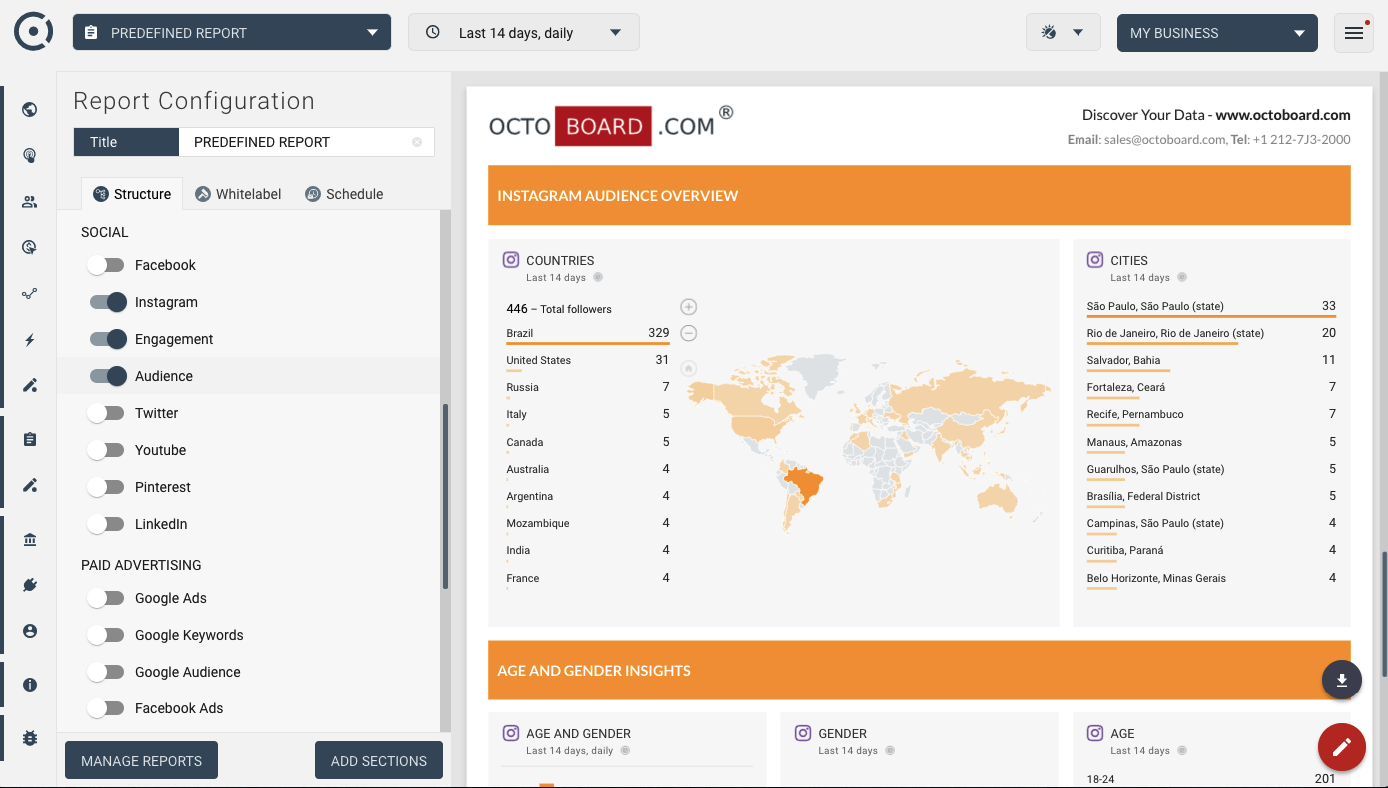
Instagram Audience (Report)
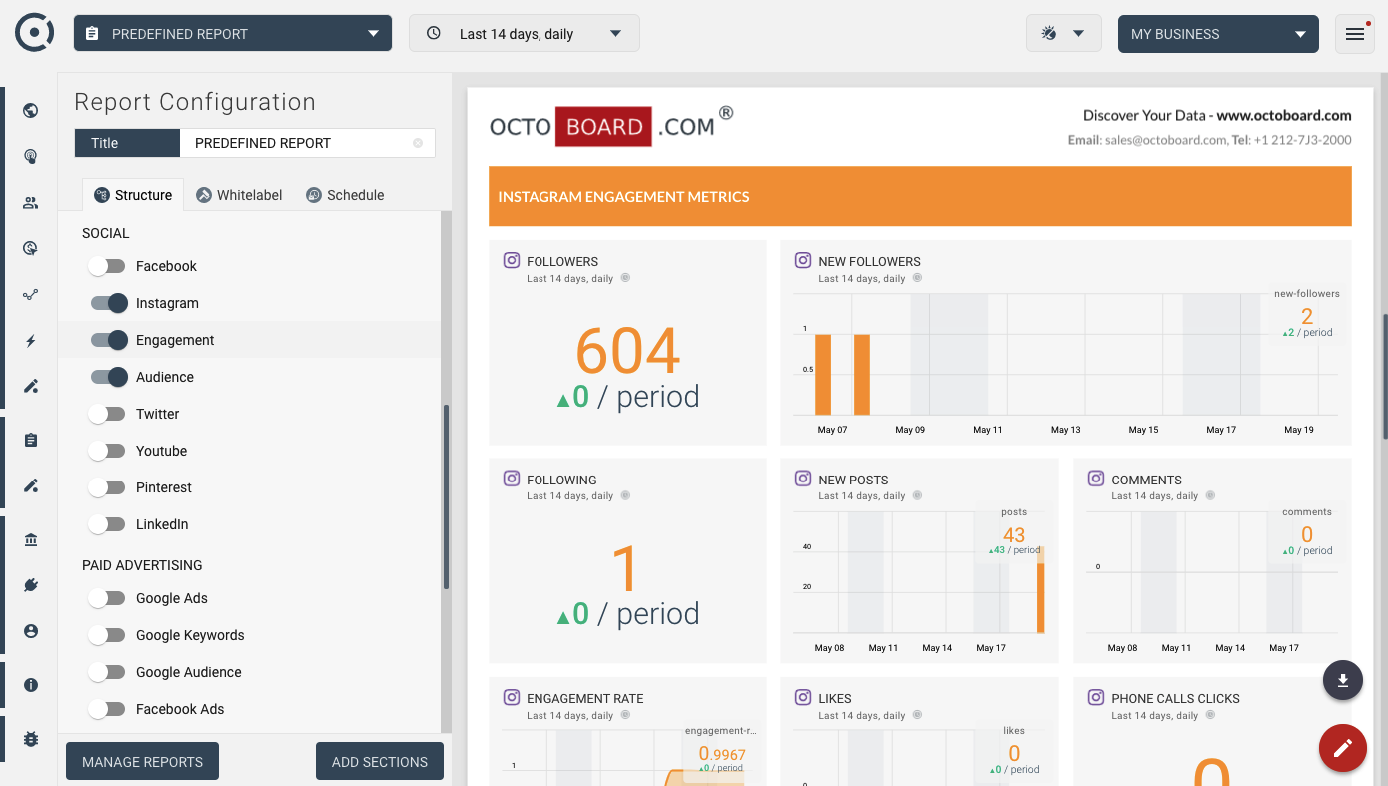
Instagram Engagement (Report)
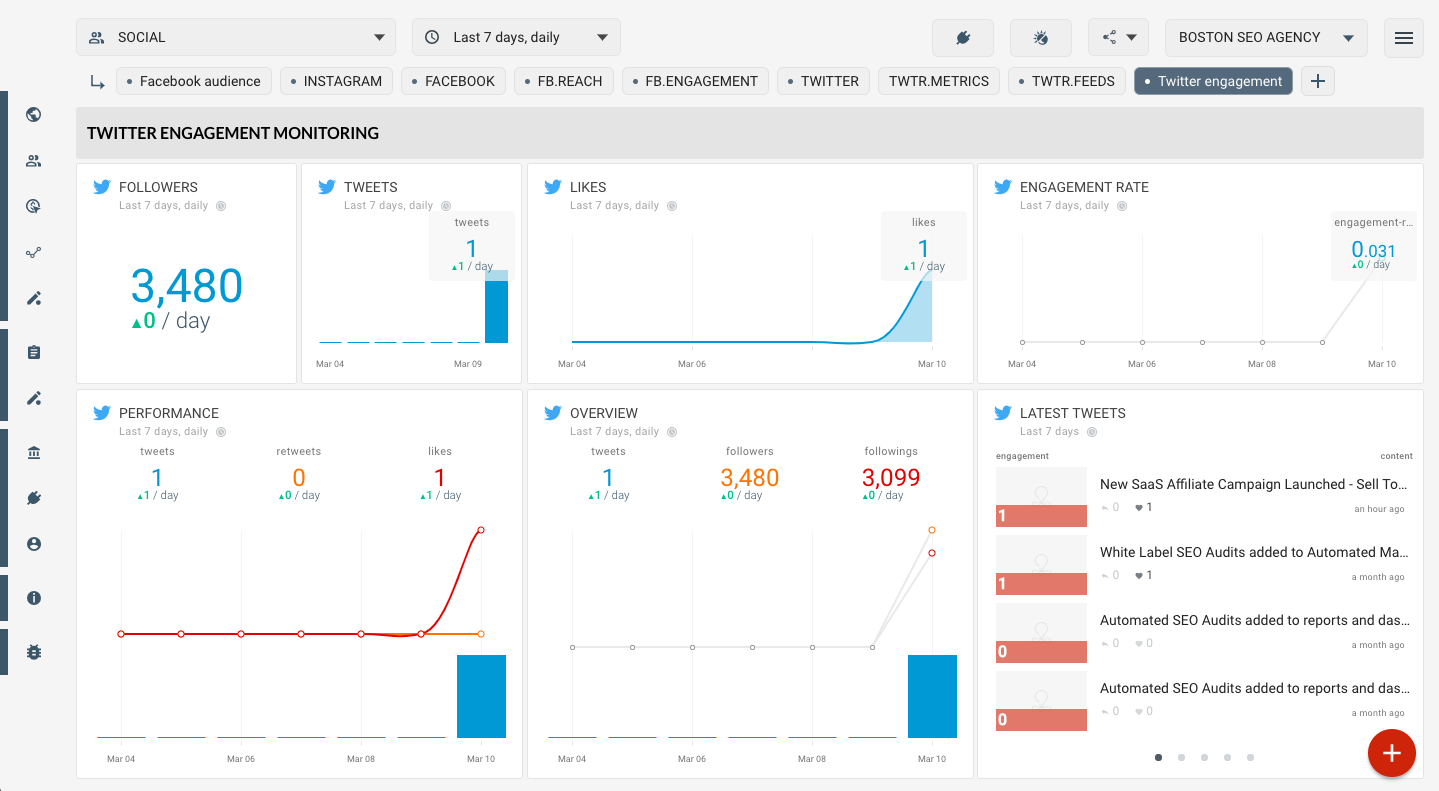
Twitter engagement
Twitter Feeds