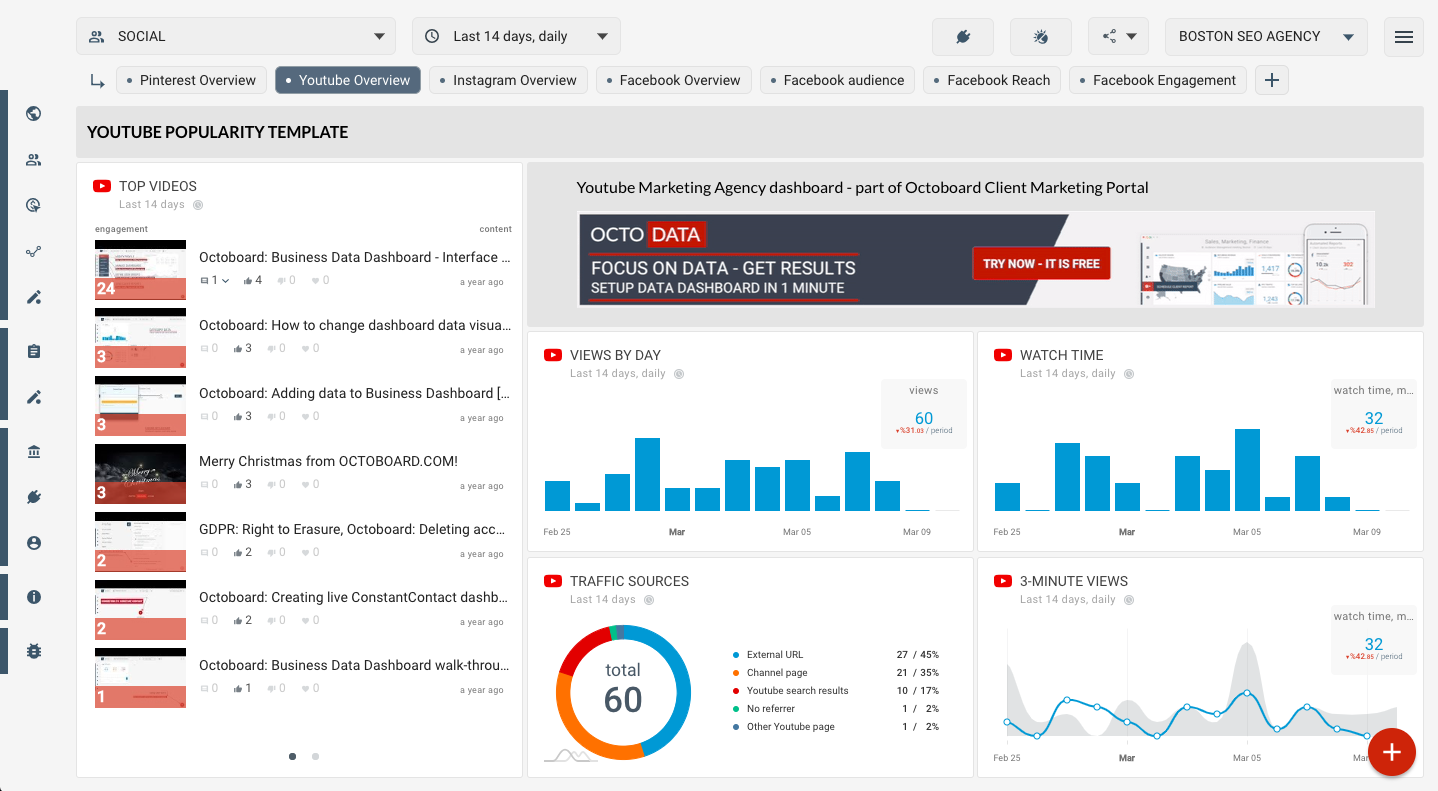
Building your social media analytics: adding Youtube Overview metrics to dashboards and reports.
Stay up-to-date with key metrics and analytics for YouTube with Octoboard's comprehensive and automated YouTube Overview dashboard.

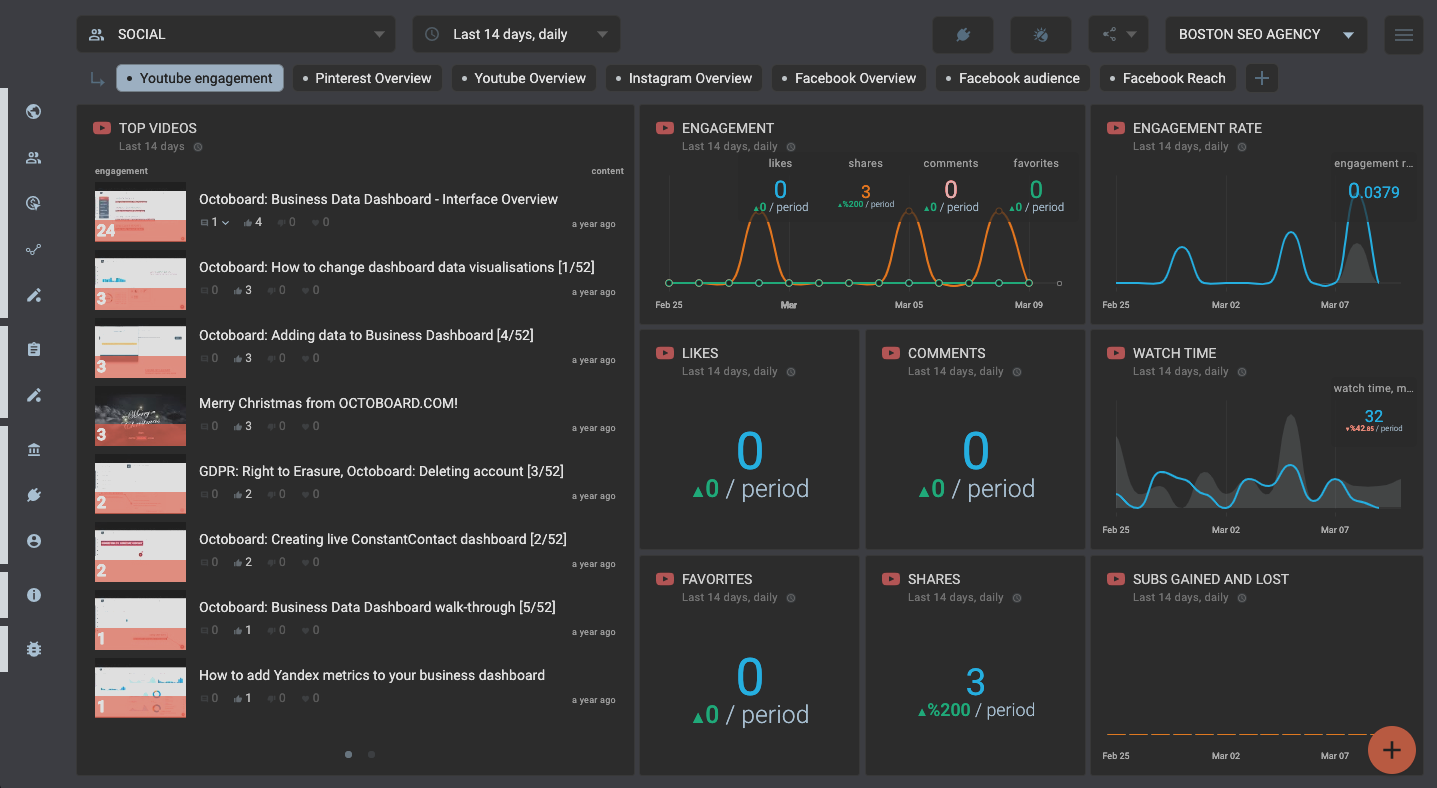
YOUTUBE OVERVIEW
Youtube account popularity metrics - latest videos, watch time, total subscribers and others
Staying up-to-date with key metrics and analytics is essential for success. As marketing teams and online businesses strive to attract and retain customers, understanding the performance of their online platforms is crucial. One such platform that has become increasingly popular is YouTube, with its vast user base and ability to reach a global audience. To effectively harness the power of YouTube, marketing teams and online businesses need an advanced data analytics and report automation software like Octoboard, which provides a comprehensive and automated YouTube Overview dashboard.
Key Metrics and Their Definitions:
Youtube Feed: This metric measures the engagement and interaction on a YouTube channel's feed, which includes comments, likes, and shares. It provides insights into the content's resonance with the audience and helps marketing teams understand what type of content drives engagement.
Youtube Watch Time: Watch time is the total amount of time viewers spend watching a YouTube video or a channel. This metric is crucial because it indicates the level of audience engagement and how compelling the content is. A high watch time suggests that the videos are holding viewers' attention, potentially leading to increased brand exposure and conversions.

Youtube Subscribers: Subscribers are users who have opted to receive updates whenever new content is uploaded to a YouTube channel. This metric is a measure of a channel's loyal and dedicated audience. A growing subscriber count indicates the popularity and reach of the channel, as well as the potential for organic growth.
Youtube Subscribers Gained/Lost: This metric tracks the net change in the number of subscribers gained or lost over a specific period. It helps marketing teams identify trends in subscriber growth and understand which strategies or content types resonate with the audience.
Youtube Views: Views refer to the number of times a video has been watched. This metric is an indicator of content popularity and reach. Increasing views can help businesses gain brand exposure, generate leads, and drive conversions.

Youtube Views by Country: This metric provides a breakdown of video views by country, enabling marketing teams to identify geographic areas where their content is performing well. This information is valuable for targeting specific markets and tailoring content to suit the preferences of different regions.
Youtube Traffic Sources: Traffic sources refer to the channels or platforms through which viewers discovered a YouTube video. This metric helps marketing teams understand which sources are driving traffic to their videos, such as YouTube search, suggested videos, external websites, or social media platforms. It allows businesses to optimize their marketing efforts and allocate resources effectively.
Youtube Favorites: Favorites are videos that users have added to their "Liked videos" playlist. This metric indicates the level of appreciation and engagement with a channel's content. It provides insights into the types of videos that resonate with the audience and can help guide content creation strategies.

The Importance for Marketing Teams and Online Businesses:
Marketing teams and online businesses rely on accurate and up-to-date data to make informed decisions. The YouTube Overview dashboard provided by Octoboard enables marketing teams to track key metrics in a centralized location, eliminating the need for manual data collection and analysis. This automation saves time and resources, allowing marketing teams to focus on strategy and execution.
By utilizing the dashboard, marketing teams can easily identify trends, track performance, and make data-driven decisions. For example, tracking Youtube Feed engagement metrics helps teams understand the type of content that resonates with their audience, leading to more effective content creation and higher engagement levels.
The Youtube Watch Time metric provides insight into video effectiveness and audience engagement. By analyzing this metric, marketing teams can identify which videos are holding viewers' attention and adjust their content strategy accordingly. This can lead to higher watch times, increased brand exposure, and potentially higher conversions.
Monitoring Youtube Subscribers and Subscribers Gained/Lost allows marketing teams to measure the growth and loyalty of their audience. By analyzing trends in subscriber numbers, teams can identify successful strategies and content that resonates with the audience, helping them refine their marketing approach and foster long-term relationships with subscribers.
Analyzing Youtube Views and Views by Country provides valuable information about content popularity and geographic reach. Marketing teams can identify which videos perform well in different regions and tailor their content to specific markets. This targeted approach can help increase views and engagement, leading to a broader brand reach and potentially higher conversions.
Understanding Youtube Traffic Sources allows marketing teams to optimize their marketing efforts and allocate resources effectively. By analyzing which sources are driving traffic, teams can focus on the most effective channels, such as YouTube search or social media platforms. This can lead to increased traffic, better-targeted campaigns, and higher conversion rates.
Finally, tracking Youtube Favorites enables marketing teams to gain insights into the content that resonates most with viewers. By understanding which videos are added to users' favorite playlists, teams can create more of the content that drives engagement and builds brand loyalty.
In the ever-evolving world of online marketing and business, it is essential for marketing teams and online businesses to have access to accurate and real-time data. The YouTube Overview dashboard provided by Octoboard offers an invaluable solution for tracking key metrics, analyzing performance, and making data-driven decisions. By leveraging the power of automation and advanced data analytics, marketing teams can optimize their YouTube presence, increase audience engagement, and drive business success.The Power of Automation with Octoboard
Octoboard customers who created this report also used the following data templates:

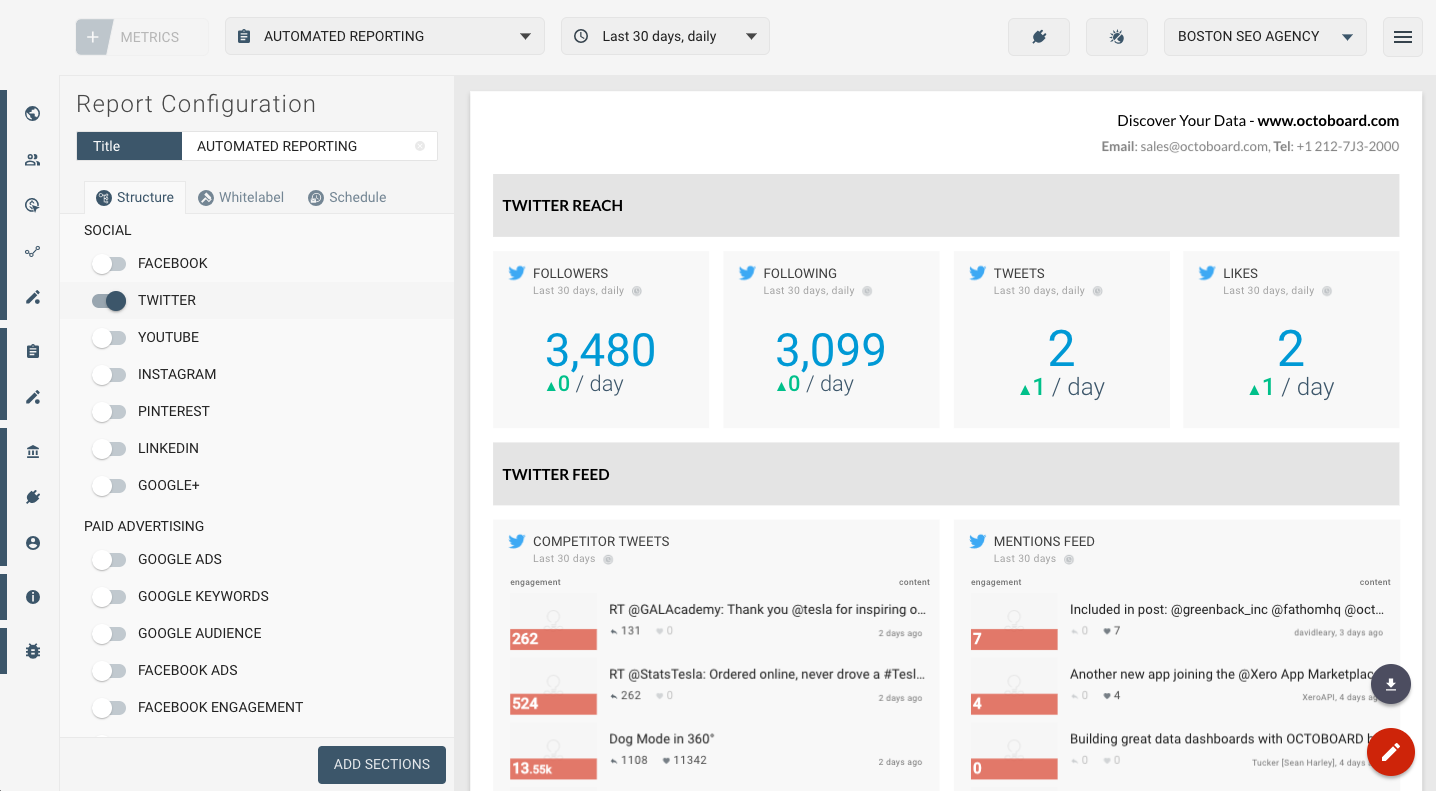
Twitter Overview
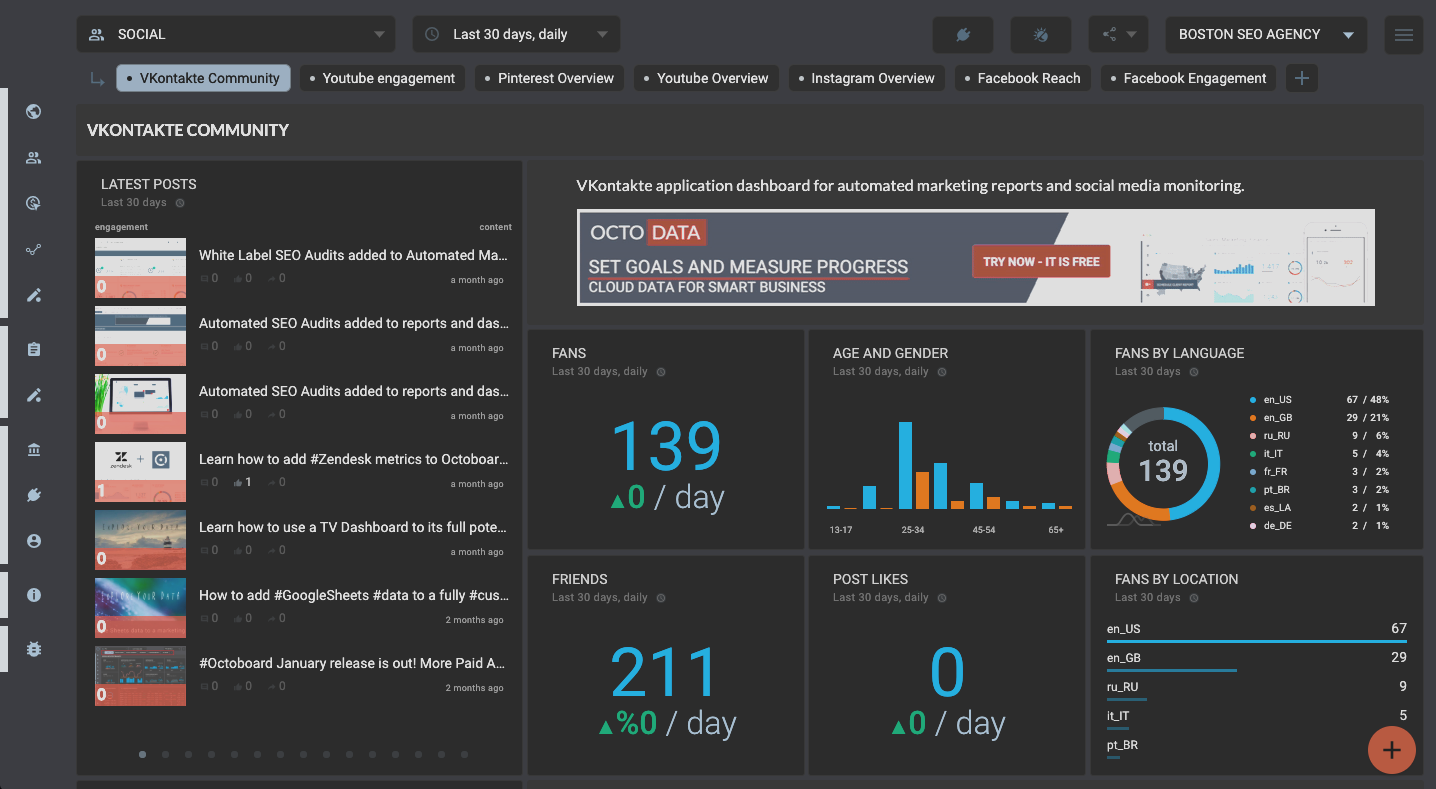
VKontakte Community
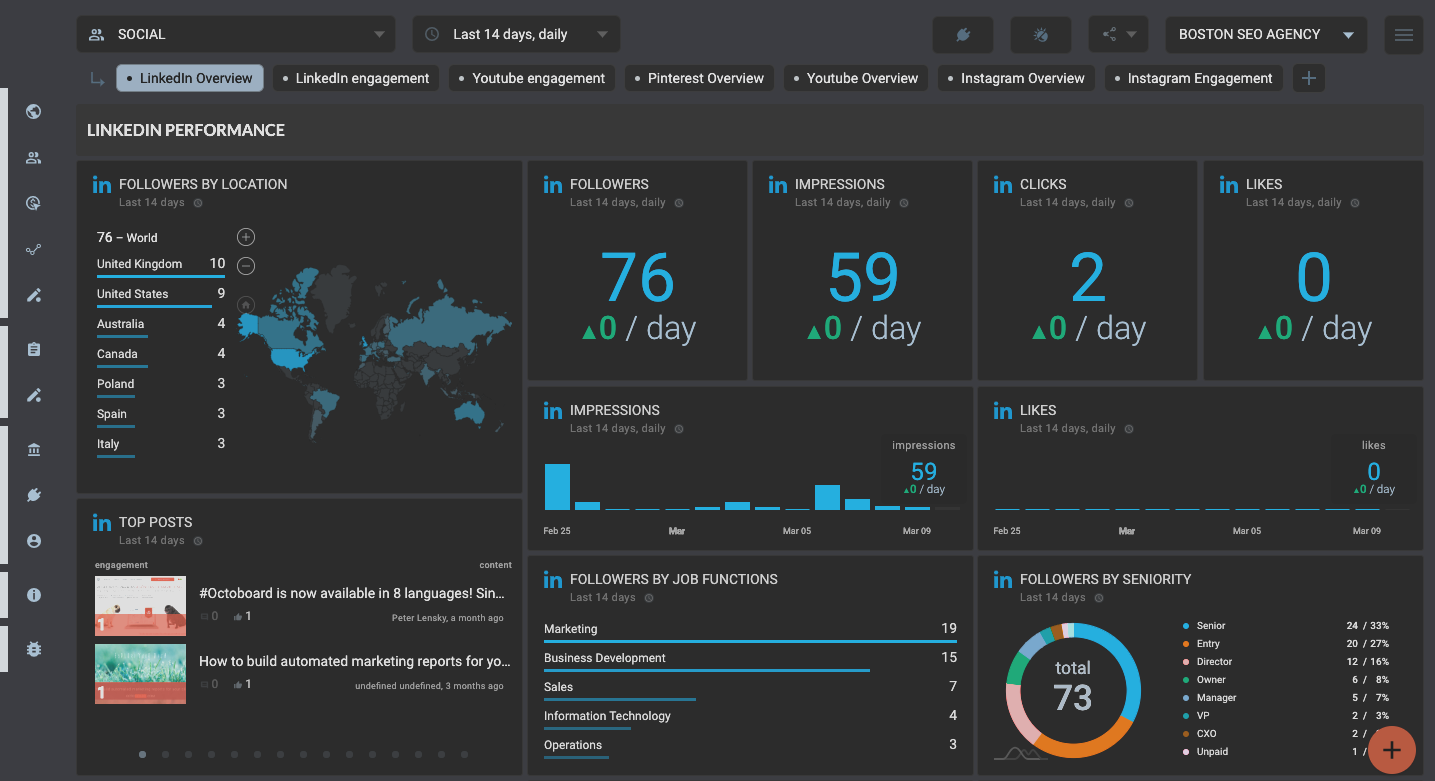
LinkedIn Social Media dashboard template
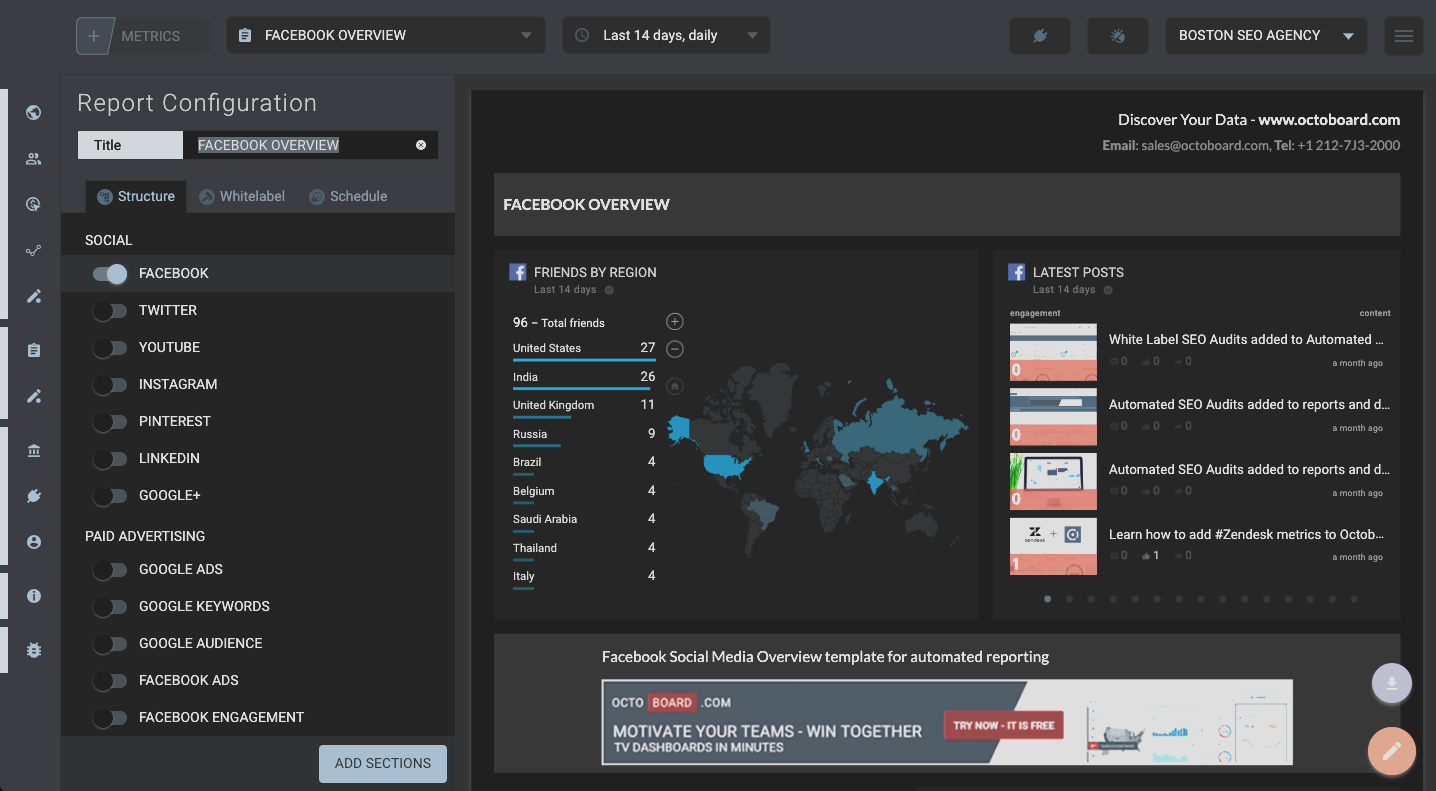
Facebook Social Media Report template (Report)
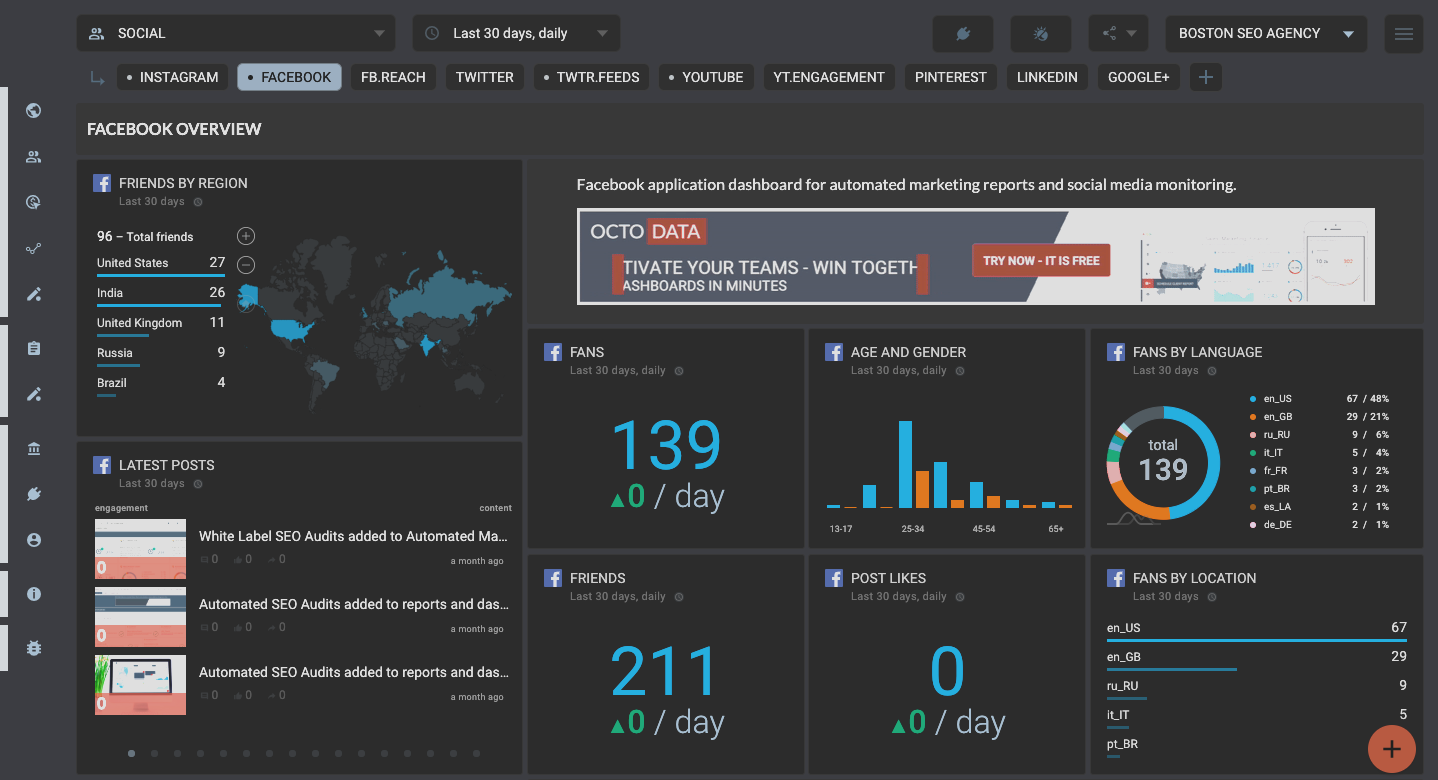
Facebook Overview
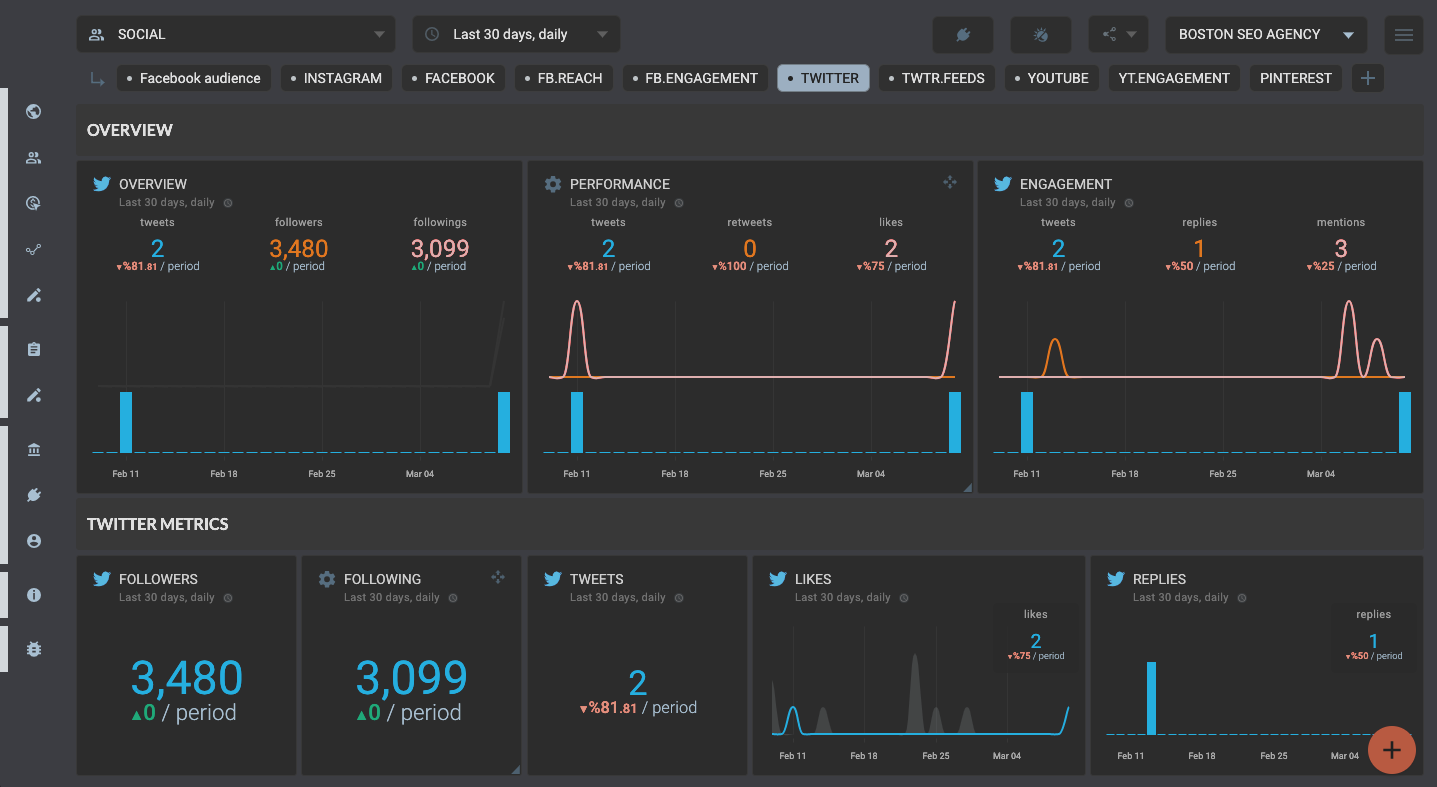
Twitter Metrics
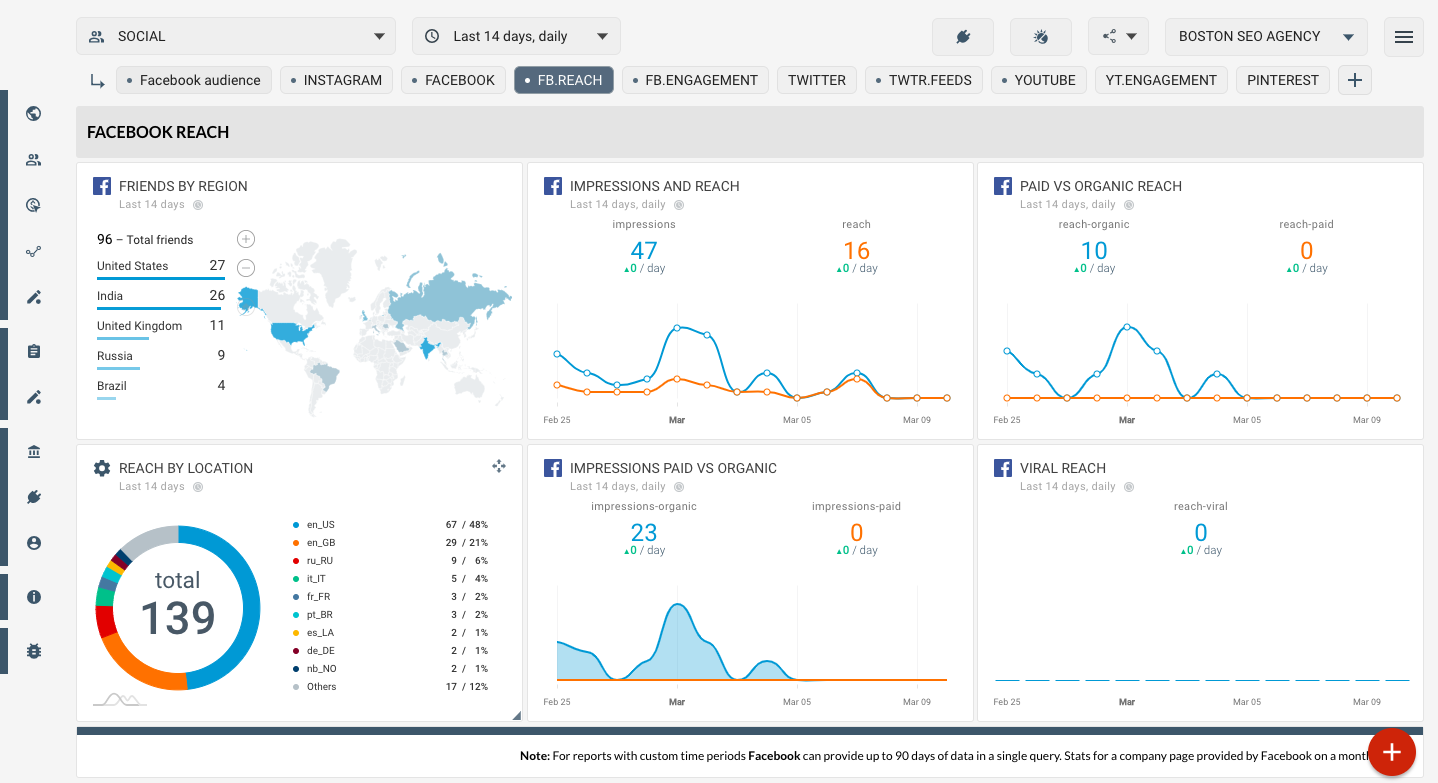
Facebook Social Media template - Reach
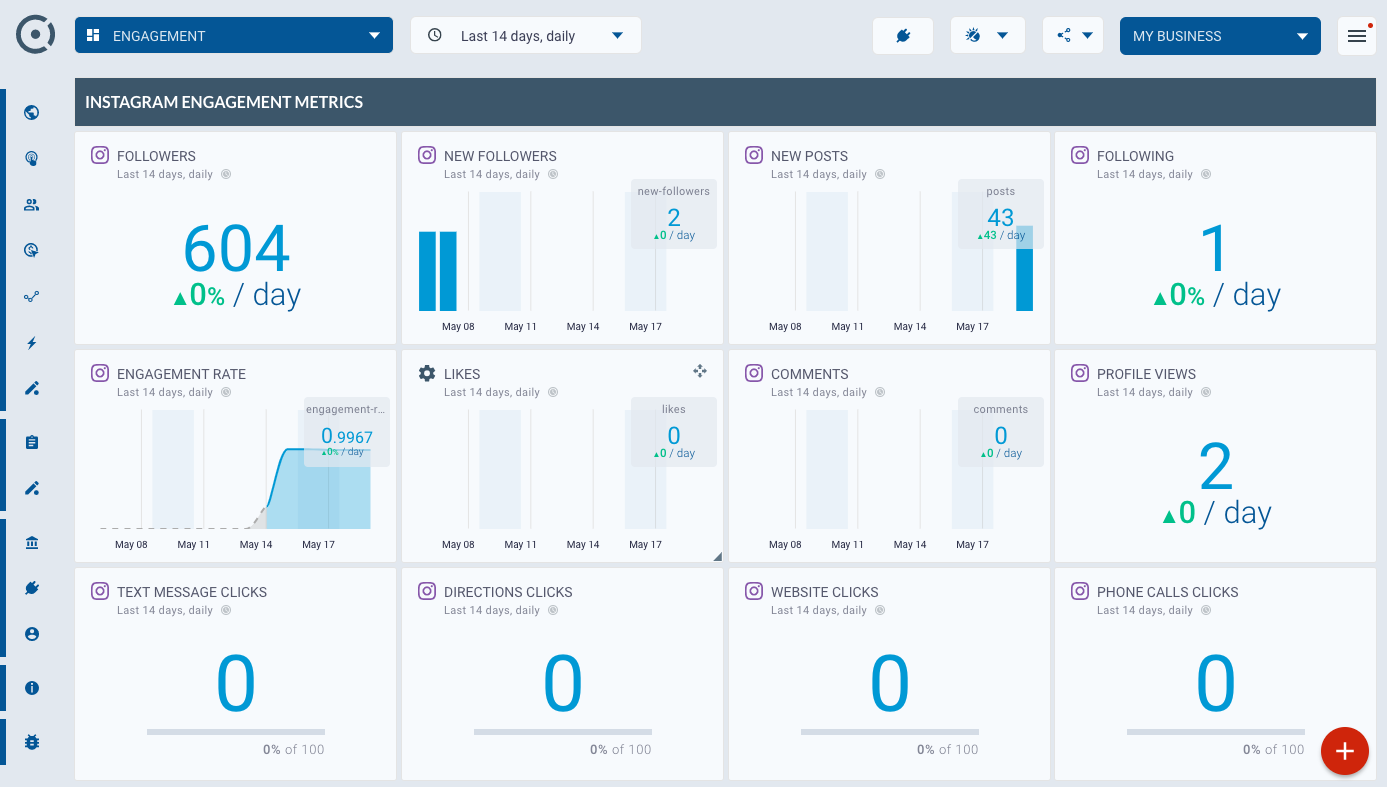
Instagram Engagement
Youtube Engagement
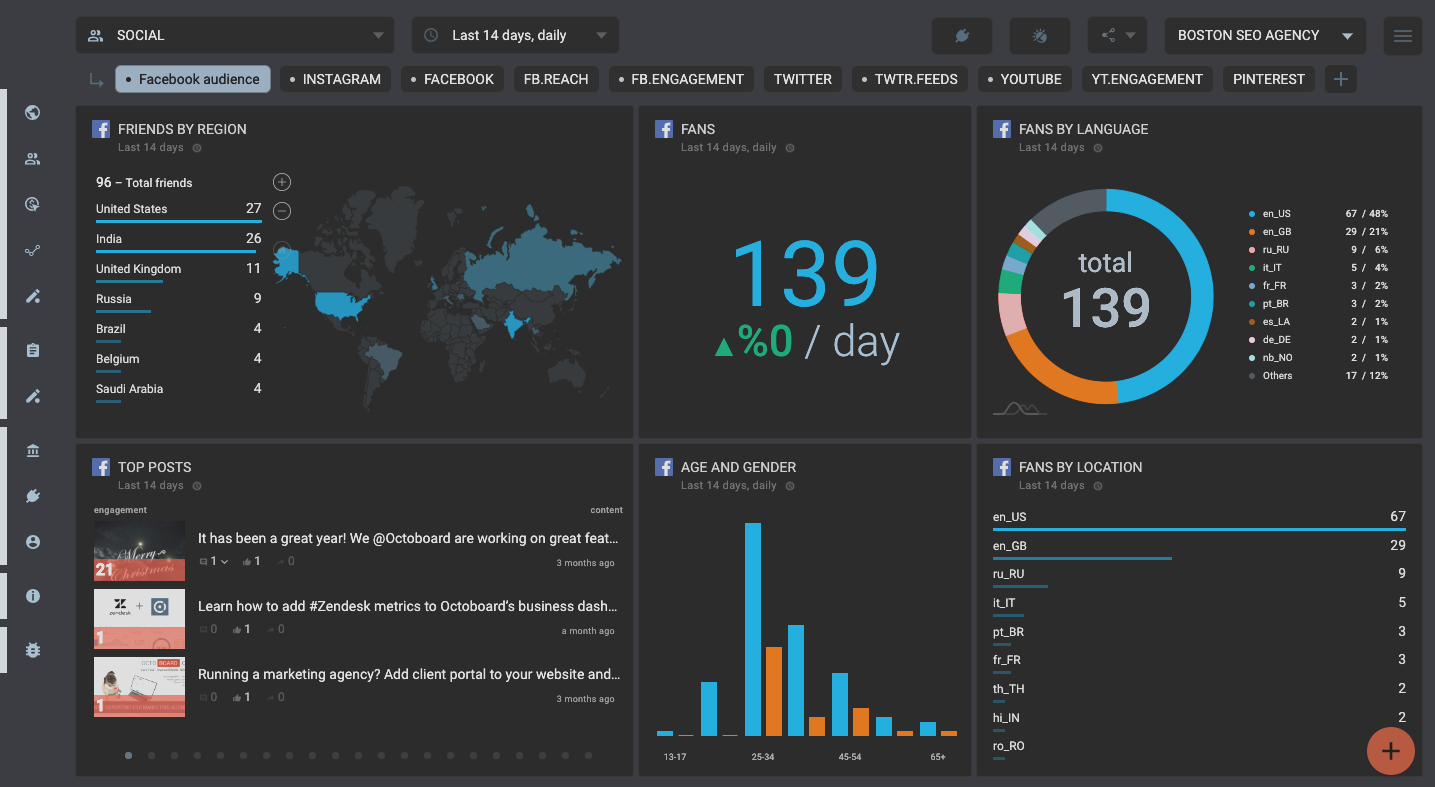
Facebook Audience
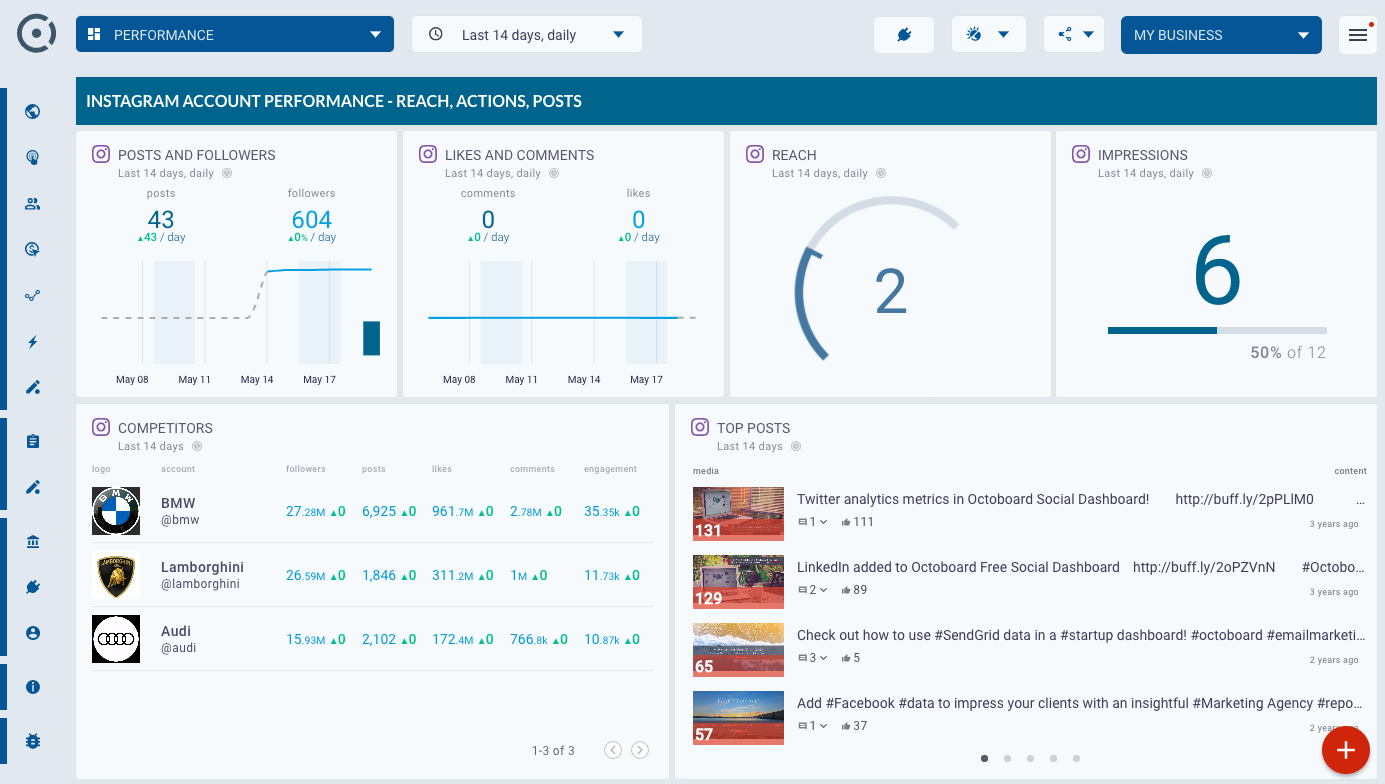
Instagram Performance