Best automated Facebook Ads reports for marketing teams
Build automated paid advertising (PPC) reports for your marketing teams and clients using Facebook Ads data.

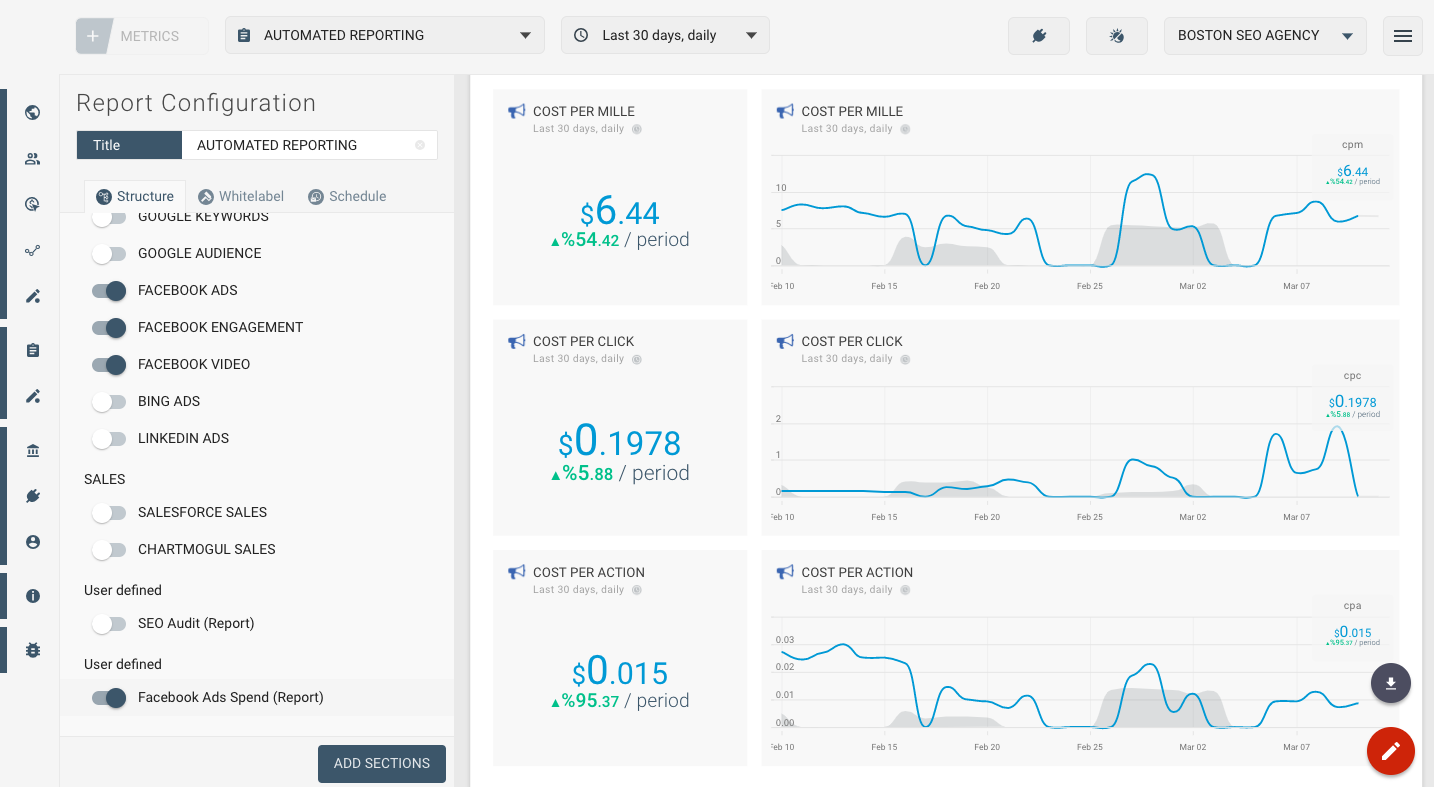
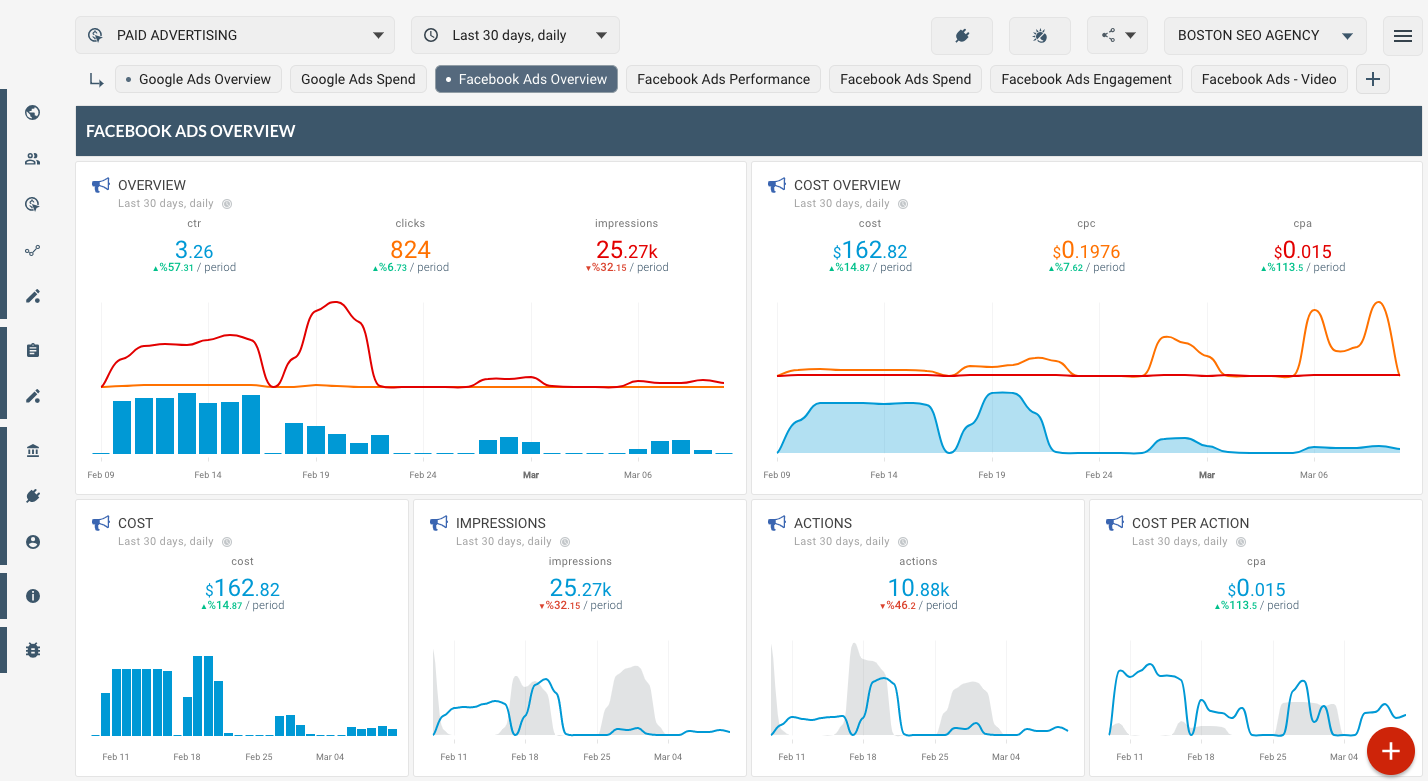
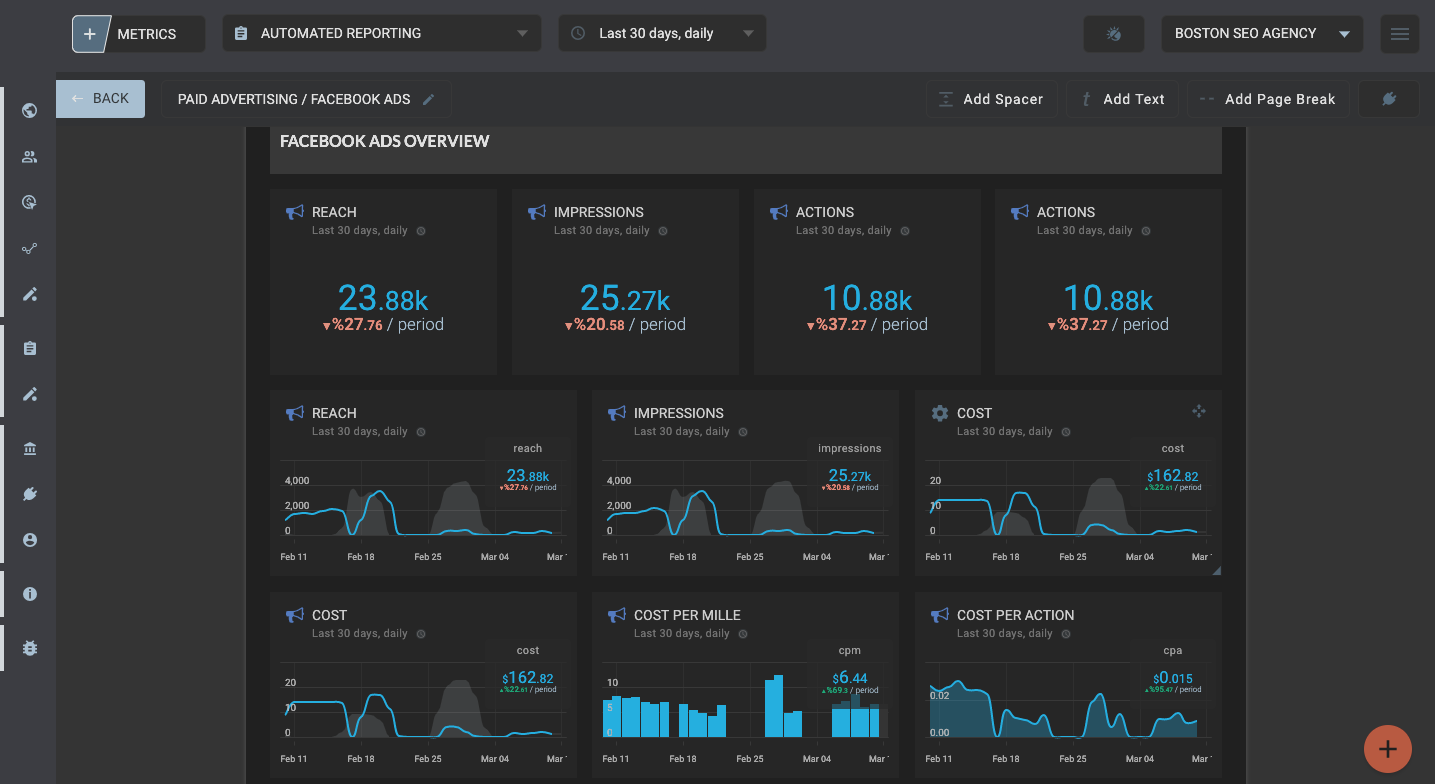
FACEBOOK ADS REPORTING
Facebook Ads cost, performance, reach and ad campaign ranking.
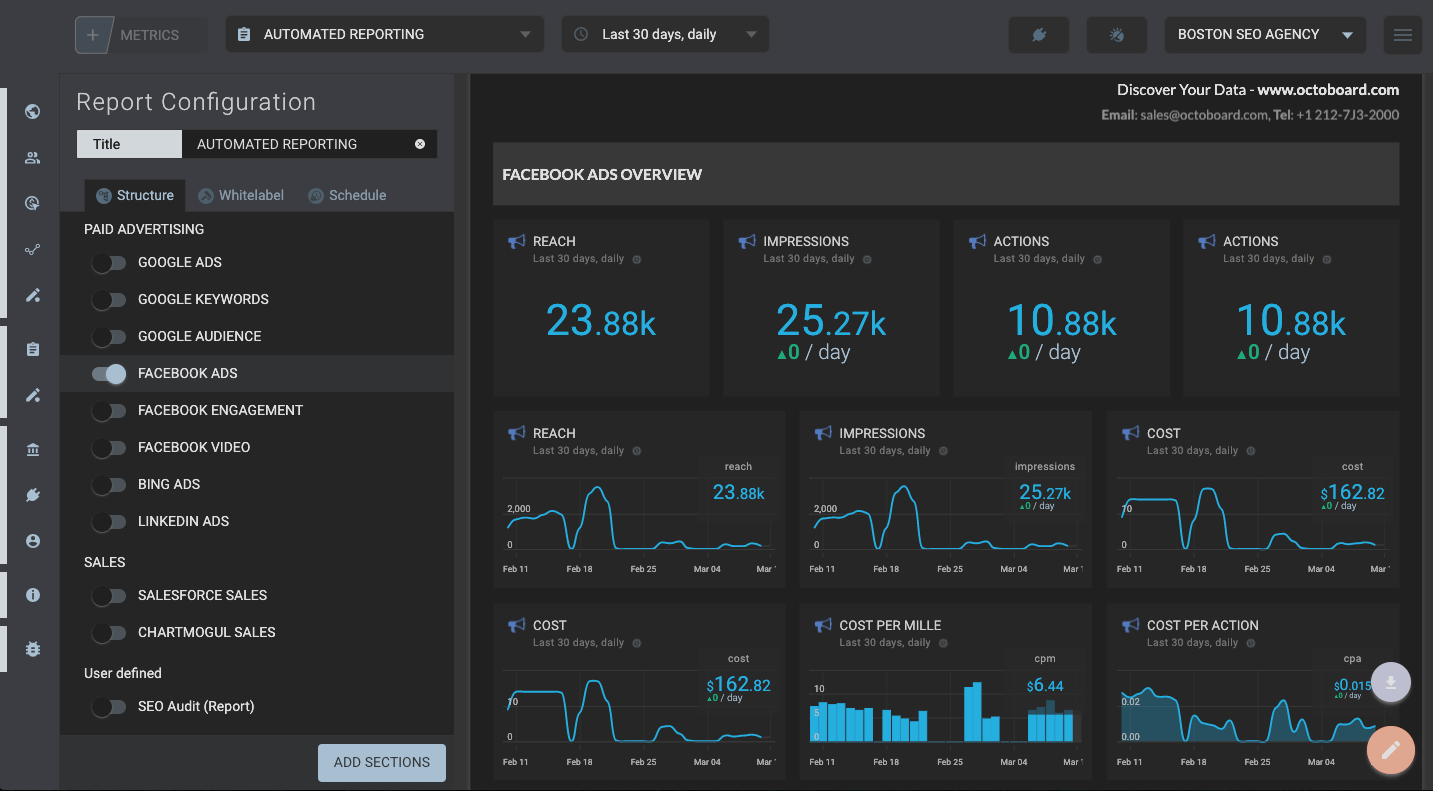
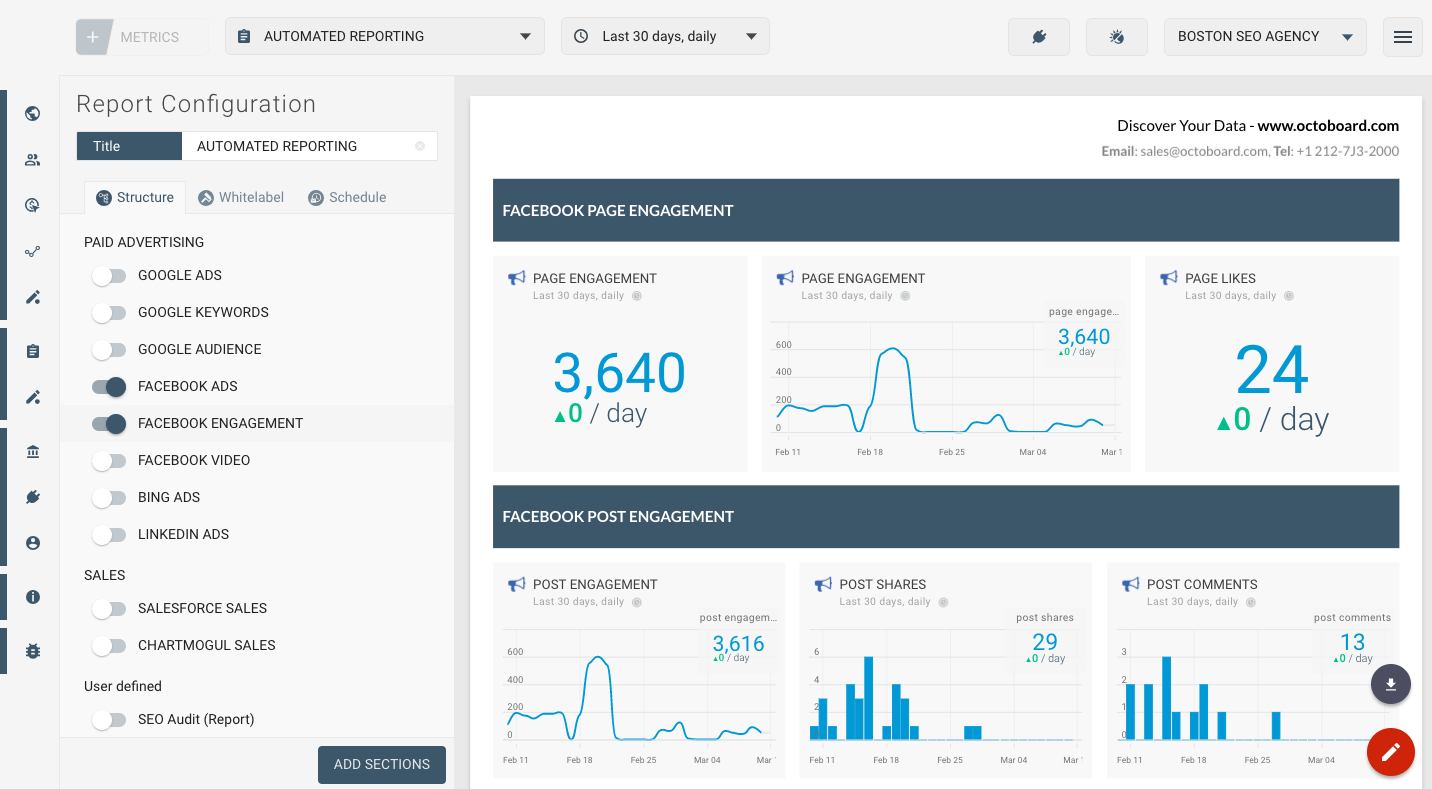
Automating Facebook Ads Reporting with Octoboard
For any marketing agency or team looking to optimize their Facebook Ads, the collection, understanding, and communication of key PPC metrics is crucial. As the digital marketing landscape becomes more sophisticated, so does the necessity for comprehensive tools to help decipher these metrics. Enter Octoboard, a powerful analytics platform that makes automating and analyzing Facebook Ads reporting a breeze. Let's delve into the primary Facebook Ads PPC metrics and understand the potency of integrating Octoboard into your reporting workflow.
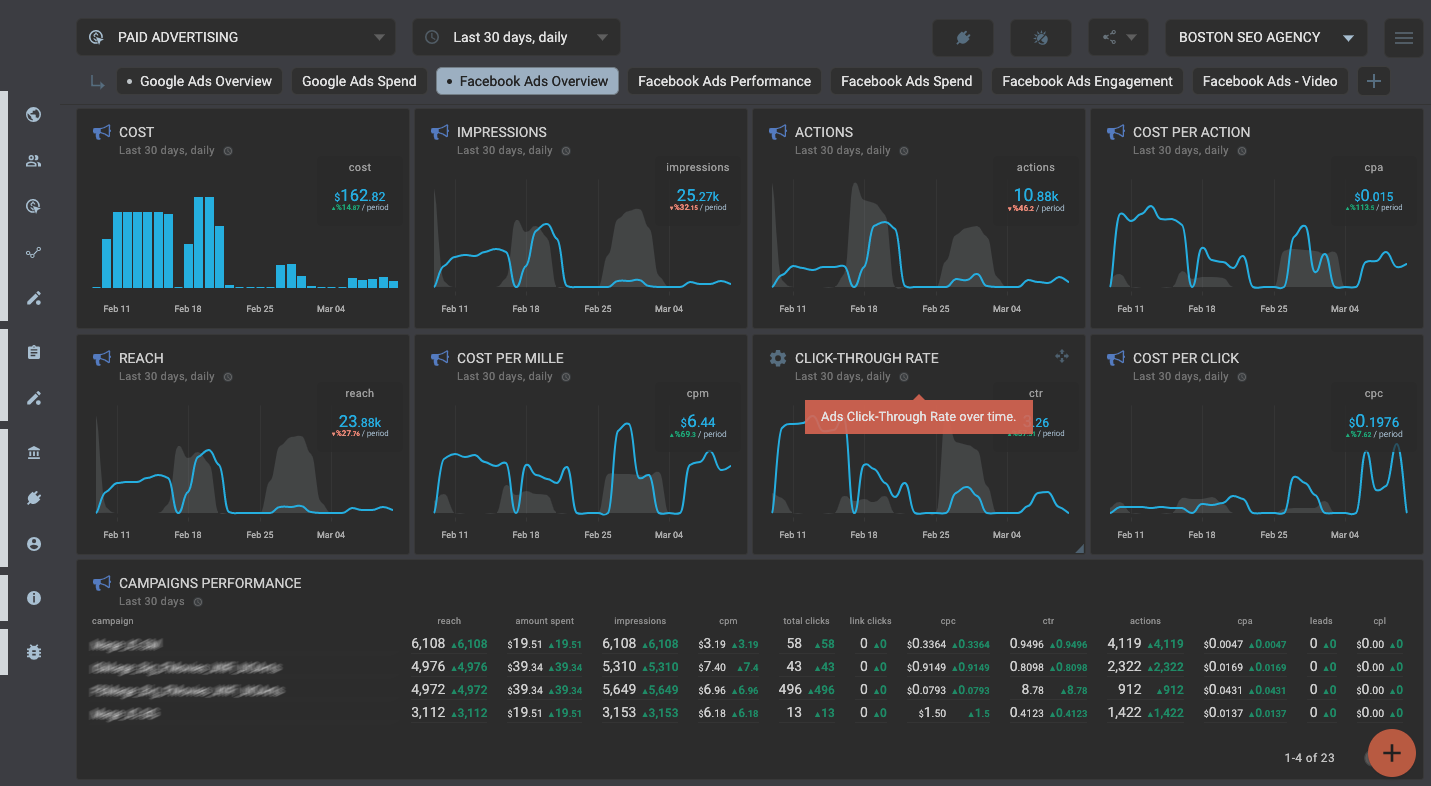
Understanding the Vital Facebook Ads PPC Metrics
Impressions: This metric reveals the number of times your ad was displayed on a user's screen. It's the foundational step in any digital marketing campaign. A high impression count means your ad has extensive visibility, but this doesn’t always translate to engagement or conversions.
Clicks: A core metric, clicks measure the number of times users took action on your ad. It provides insights into how enticing or relevant your advertisement is to your audience.
CPC (Cost Per Click): This is the amount you pay for each click on your ad. Monitoring the CPC helps in understanding if you are getting value for your advertising dollar and if your ad is targeting the right audience effectively.
Cost: This encompasses the total amount you spend on your advertising campaign. Keeping a tight watch on your expenses ensures you’re on budget and allows for optimizations based on the performance.
ROAS (Return on Ad Spend): Perhaps one of the most essential metrics, ROAS calculates the return on investment from your ad campaign. A positive ROAS indicates a successful campaign, while a negative one signals a need for strategy reevaluation.
Why Reporting PPC Metrics Across Channels is Crucial
In today's digital age, users are spread out across various platforms and channels. To maximize reach and engagement, businesses often advertise on multiple platforms. This dispersal makes it critical to have a consolidated report that provides insights across all channels.
Having an integrated view:
- Offers a holistic understanding of performance.
- Highlights interplay and dependencies between channels.
- Saves time from juggling different reporting tools.
Make sure you check Octoboard's PPC Automated Reporting Features for a full overview of different options and integrations that cover, among others Google Ads, LinkedIn Ads, Bing Ads, Tiktok Ads and Criteo.
- Real-time performance
- Reach and user actions
- Advertisement cost tracking
Automated data reports enabled by Octoboard software
Facebook Ads - Cost and Performance
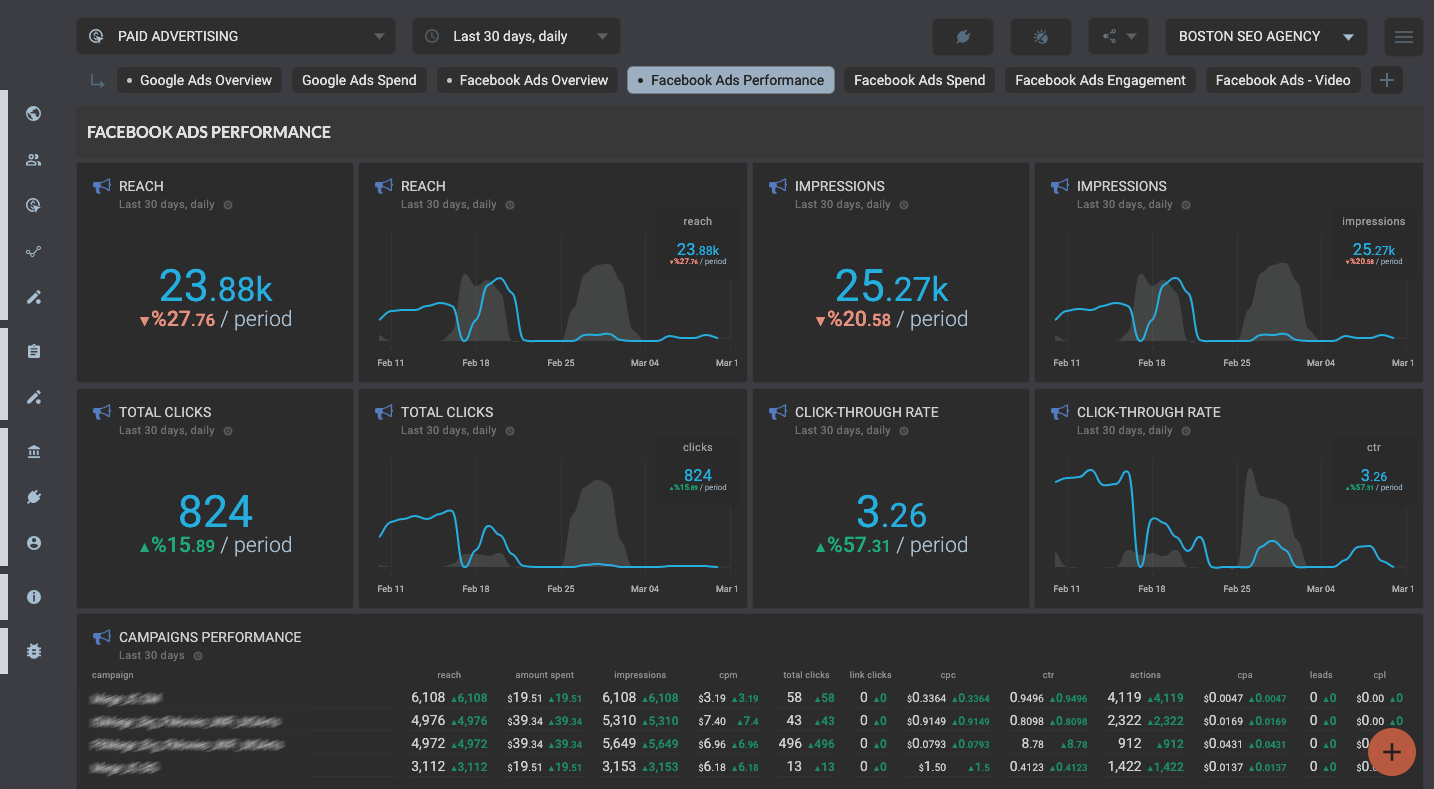
Facebook Ads PPC report - Performance
Facebook Ads PPC Performance template (Report)
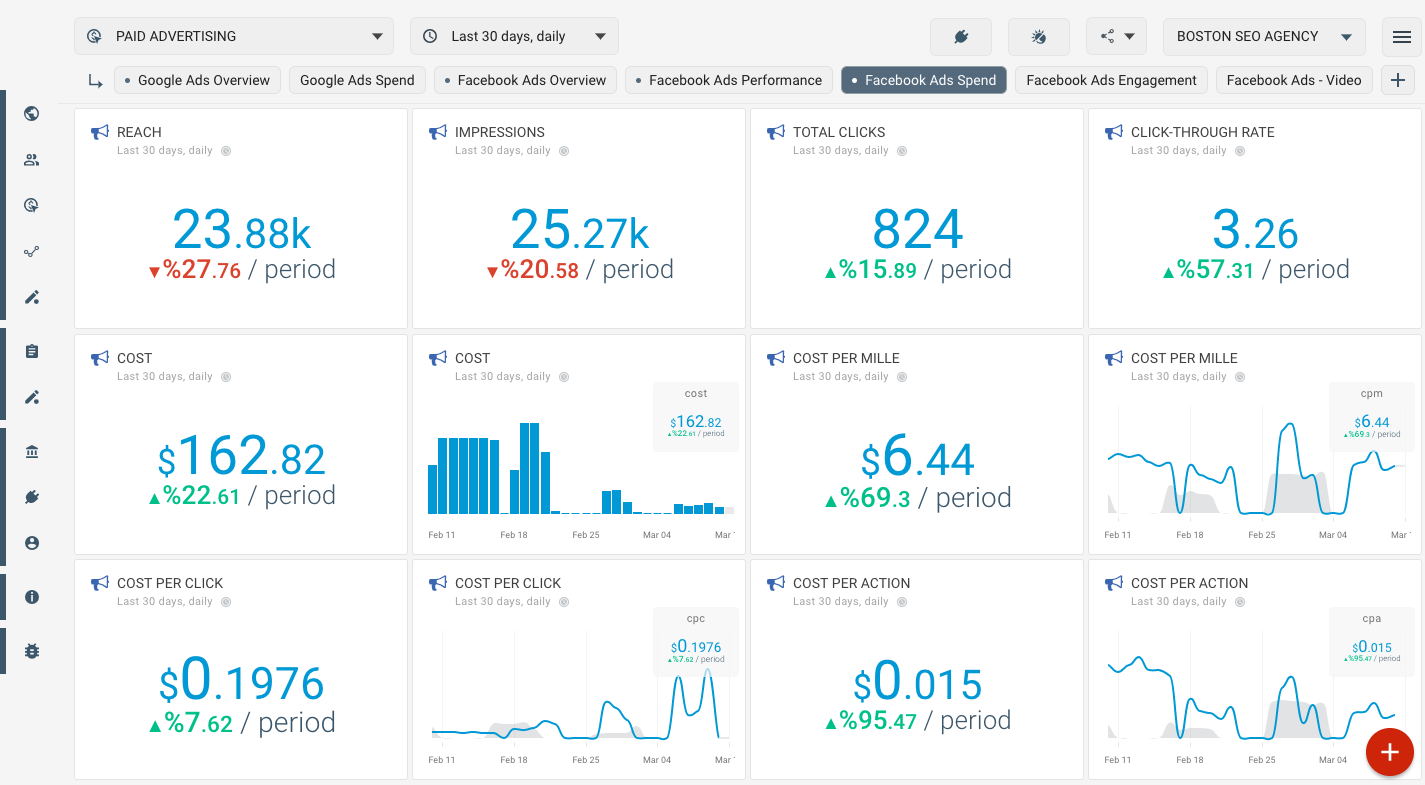
Facebook Ads PPC dashboard - Ad Spend
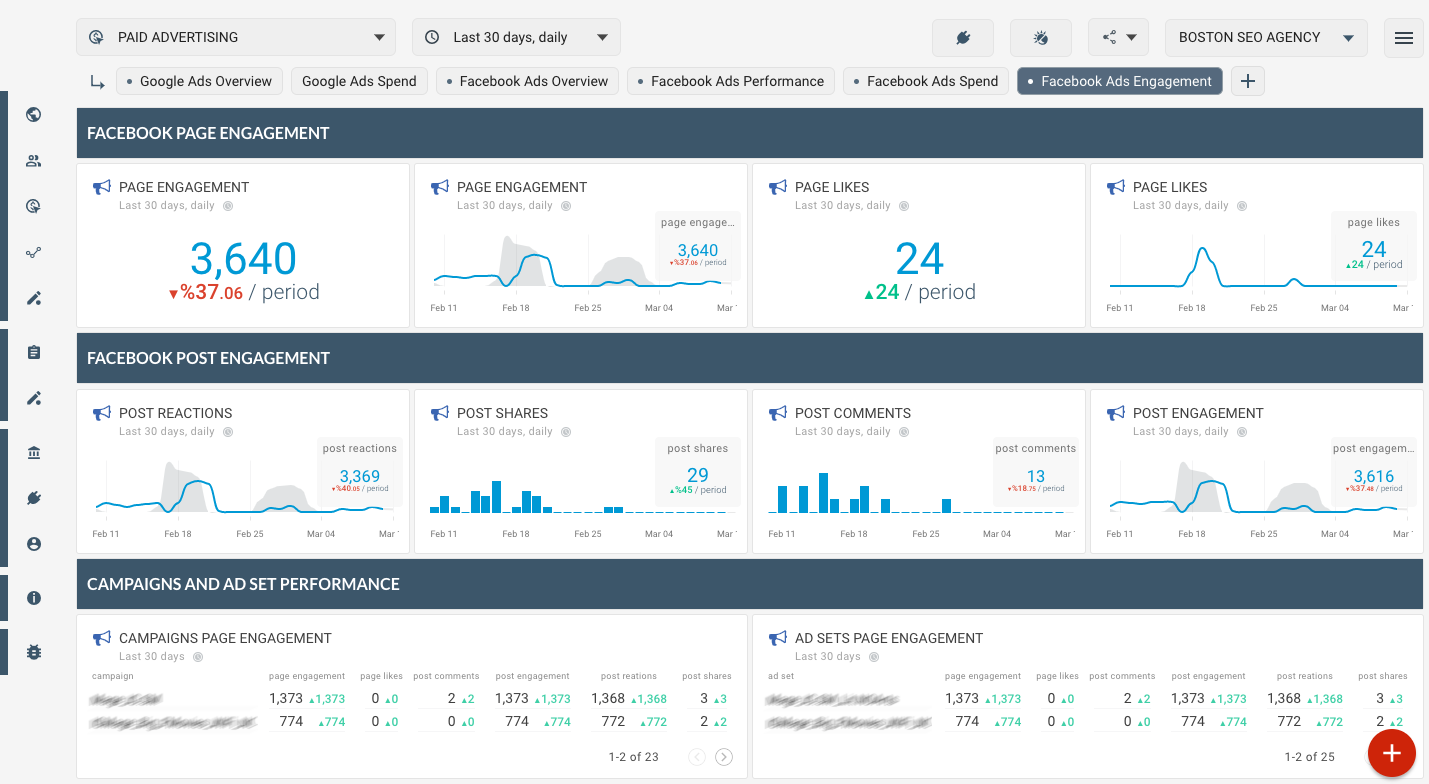
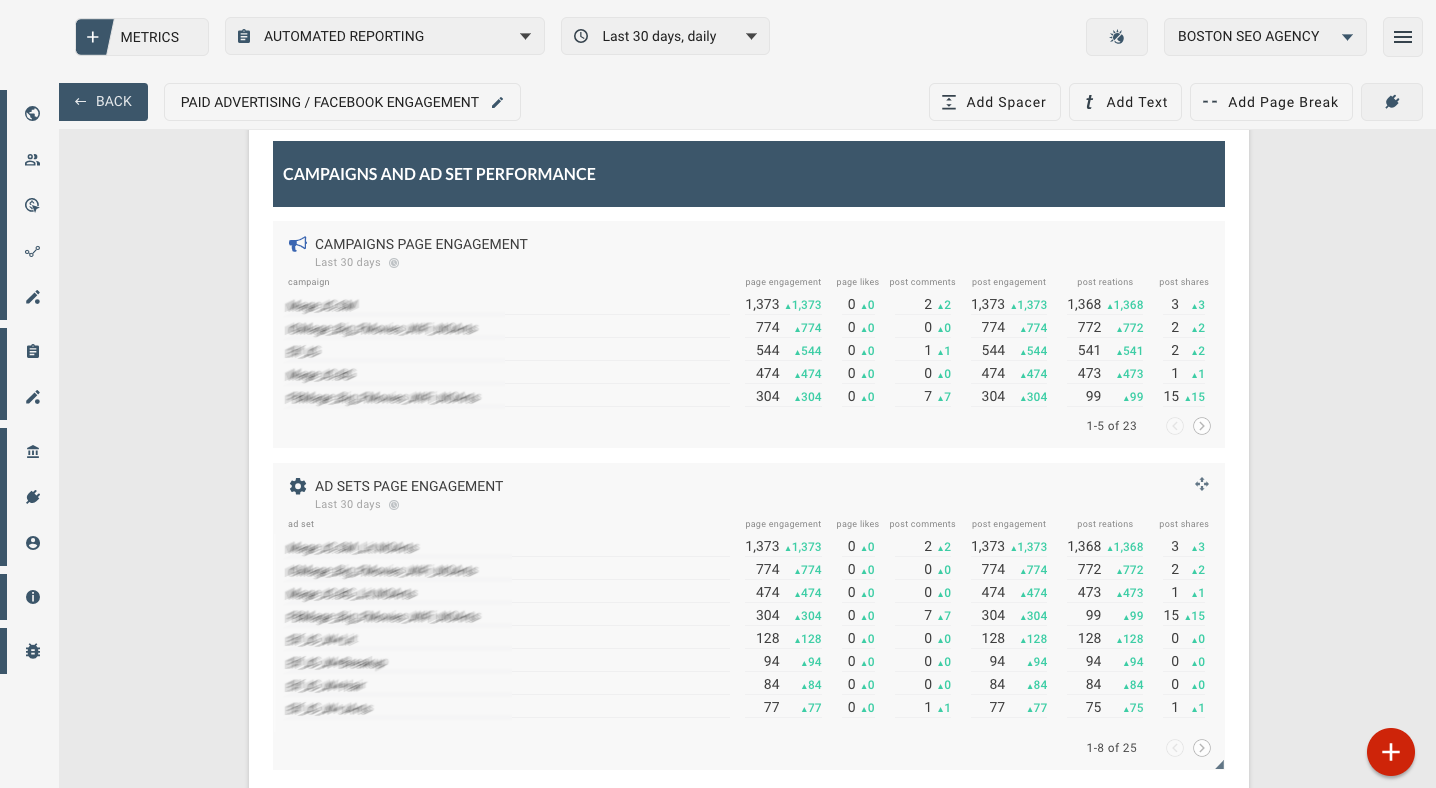
Facebook Ads Engagement
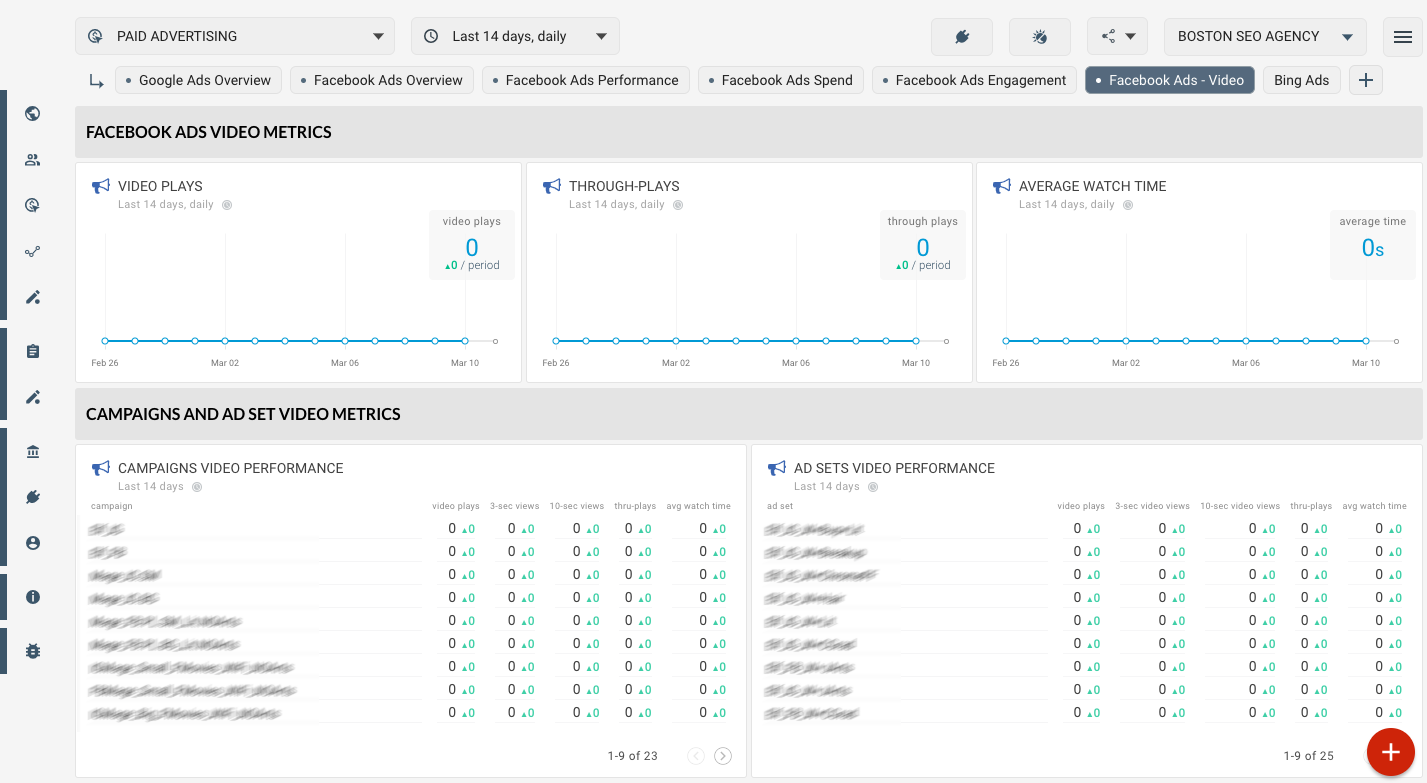
Facebook Ads Video
Facebook Ads Engagement (Report)
Facebook Ads Video (Report)
Facebook Ads Performance (Report)