Best automated AdRoll reports for marketing teams
Build automated marketing reports for your analytics teams and clients using AdRoll data.

ADROLL REPORTING
AdRoll retargeting performance.
AdRoll Integration: Building Automated AdRoll PPC Analytics Reports Using Octoboard
In today’s digital marketing landscape, data-driven decision-making is not just an advantage; it's a necessity. For marketing teams and agencies leveraging AdRoll for their PPC campaigns, the ability to analyze and present results effectively is crucial. This is where integrating AdRoll with the Octoboard Marketing Analytics platform becomes a game-changer.
Understanding AdRoll Metrics for Enhanced Reporting
To begin with, let’s delve into the key AdRoll metrics that form the backbone of effective PPC analytics:
- AdRoll Overview: A snapshot of overall campaign performance, offering insights into various aspects of your PPC efforts.
- AdRoll Cost Overview: Understanding your spend is crucial in evaluating the efficiency of your campaigns and in optimizing your budget allocation.
- AdRoll Campaign Performance: Detailed insights into each campaign help in identifying what's working and what isn't.
- AdRoll Adgroup Performance: This metric drills down to the ad group level, allowing for more granular analysis and optimization.
- AdRoll CPM (Cost per Mille): CPM helps in understanding the cost-effectiveness of your campaigns in terms of impressions.
- AdRoll CPA (Cost per Acquisition): A vital metric to gauge the cost incurred in acquiring a customer.
- AdRoll Revenue: Directly ties your PPC efforts to revenue generation, a crucial metric for ROI calculation.
- AdRoll ROAS (Return on Ad Spend): Perhaps the most important metric, ROAS, measures the effectiveness of your PPC campaigns in terms of revenue generated per dollar spent.
Automating PPC Analytics with Octoboard
The Octoboard Marketing Analytics platform revolutionizes how marketing teams approach PPC analytics. By automating the generation of AdRoll reports, Octoboard saves marketing teams countless hours that would otherwise be spent on manual data compilation and analysis. With Octoboard, reports can be scheduled on a weekly or monthly basis, ensuring consistent and timely visibility into PPC analytics efforts. This regular reporting rhythm is essential for teams and management to stay informed and make data-driven decisions.
Centralizing PPC Analytics Across Multiple Channels
Octoboard’s strength lies in its ability to centralize PPC analytics reporting from multiple channels. Why is this important?
- Unified View: It offers a consolidated dashboard that presents a holistic view of all PPC efforts across different platforms.
- Comparative Analysis: Easily compare performance across channels to allocate resources more effectively.
- Time Efficiency: Reduces the need to toggle between multiple platforms, saving time and reducing the risk of data misinterpretation.
Advanced PPC Analytics Module
For marketing agencies looking to go a step further, Octoboard’s advanced PPC analytics module is a treasure trove. This feature allows teams to build custom metrics, use advanced formulas, and transform PPC data across different channels, locations, and currencies. The flexibility to customize and deep-dive into analytics is invaluable for agencies that manage diverse client portfolios. Discover more about this powerful module at Octoboard PPC Analytics Module.
Automated Data Insights and Trend Monitoring
One of the most innovative features of Octoboard is its ability to monitor data trends and generate OpenAI data insights using AdRoll data. This automated trend detection is vital for several reasons:
- Proactive Optimization: Stay ahead by quickly identifying and acting on emerging trends.
- Performance Alerts: Automated insights can highlight anomalies or significant performance changes, prompting timely intervention.
- Strategic Planning: Long-term trend analysis aids in strategic decision-making and future campaign planning.
Explore how this feature can transform your data analysis at Octoboard Automated Data Insights.
Google Sheets Data Export for Enhanced Accessibility
Octoboard’s Google Sheets data export feature is a boon for teams that prefer working with spreadsheets. This add-on allows easy export of AdRoll data into Google Sheets, enabling:
- Customized Data Manipulation: Use familiar spreadsheet functions to further analyze and present data.
- Accessibility: Share data easily across teams without needing access to the Octoboard platform.
- Archiving and Reporting: Maintain historical data records and create custom reports in a format that’s universally accessible.
Learn more about this feature at Octoboard Google Sheets Add-on.
Empowering Marketing Teams with Automated AdRoll Reporting
In conclusion, integrating AdRoll with Octoboard transforms how marketing teams and agencies handle PPC analytics. The combination of detailed AdRoll metrics with Octoboard’s automation, centralization, and advanced analytics capabilities equips marketing professionals with the tools they need to excel in a competitive digital landscape. By embracing this integration, teams can not only save time but also gain deeper insights, leading to more effective and data-driven marketing strategies.
Automated data reports enabled by Octoboard software
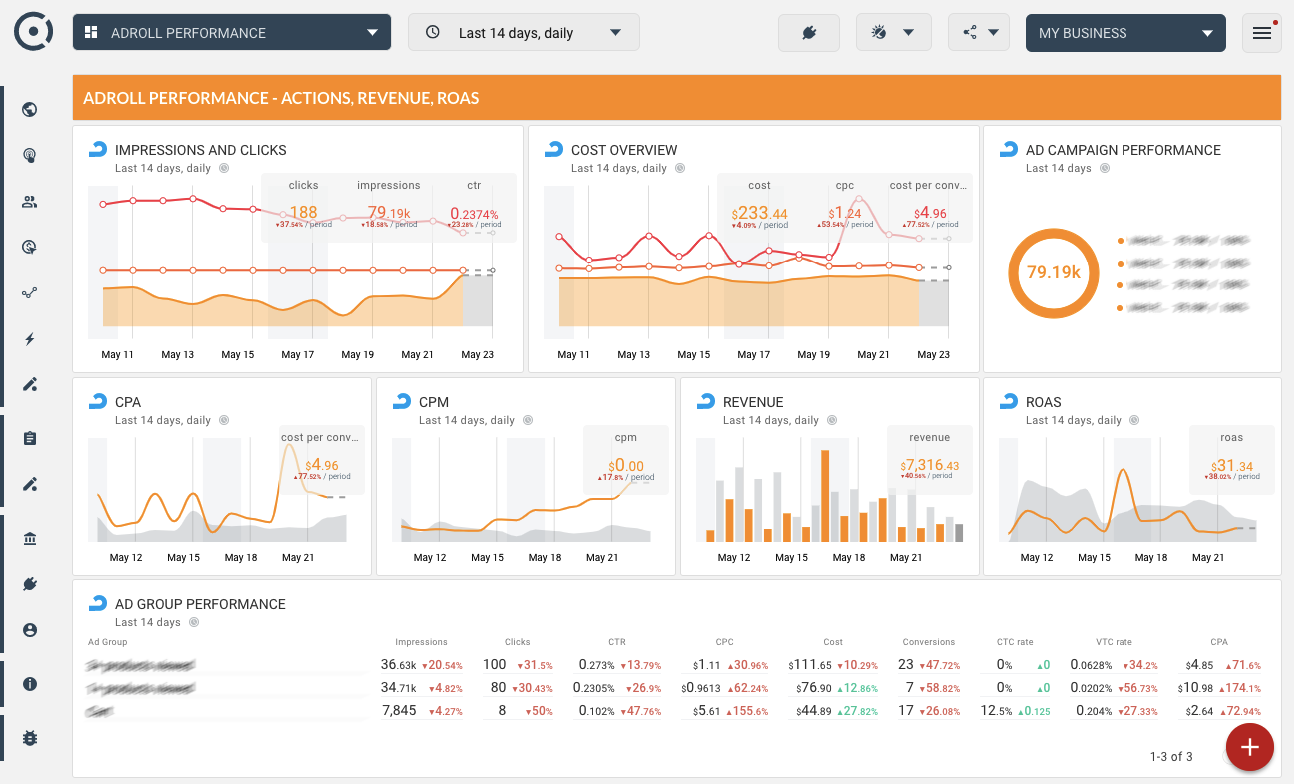
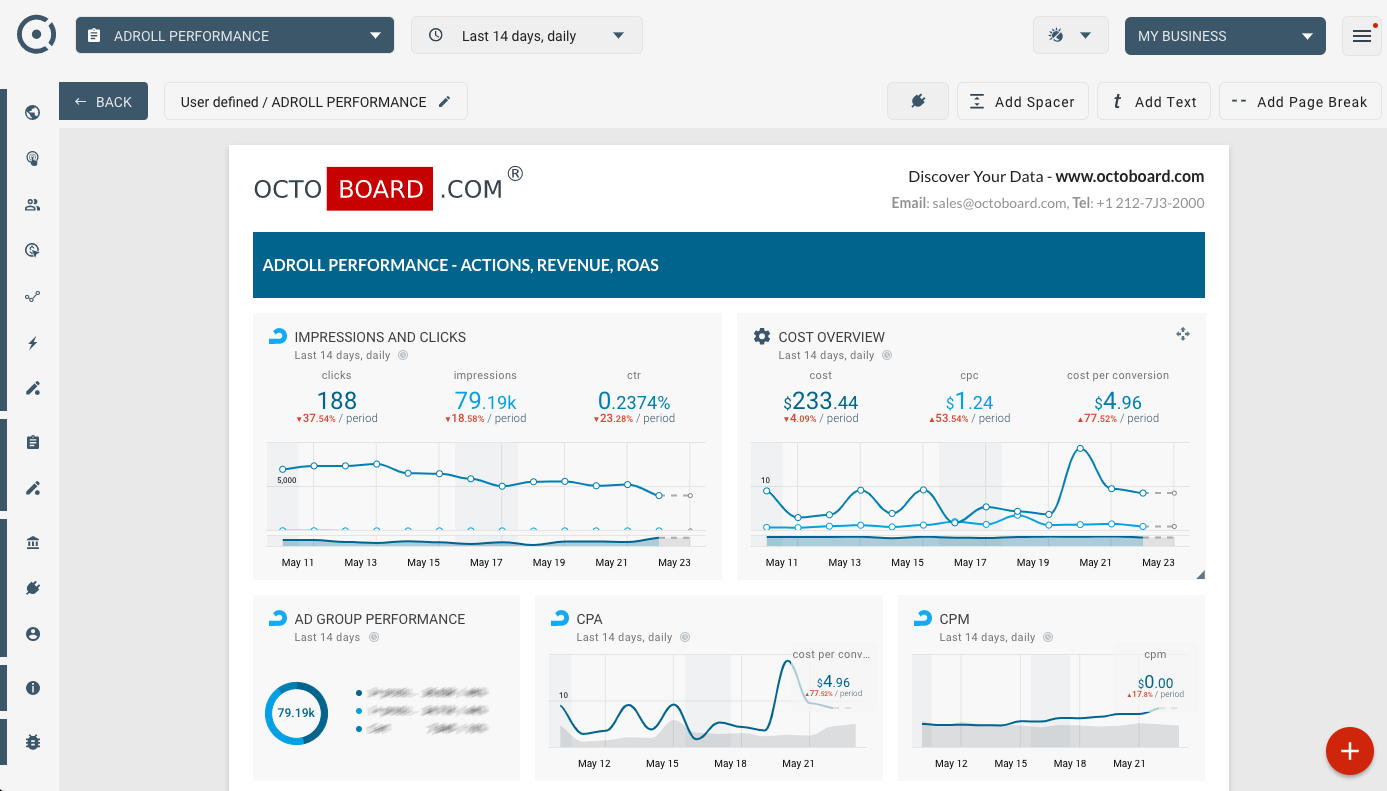
AdRoll Performance dashboard
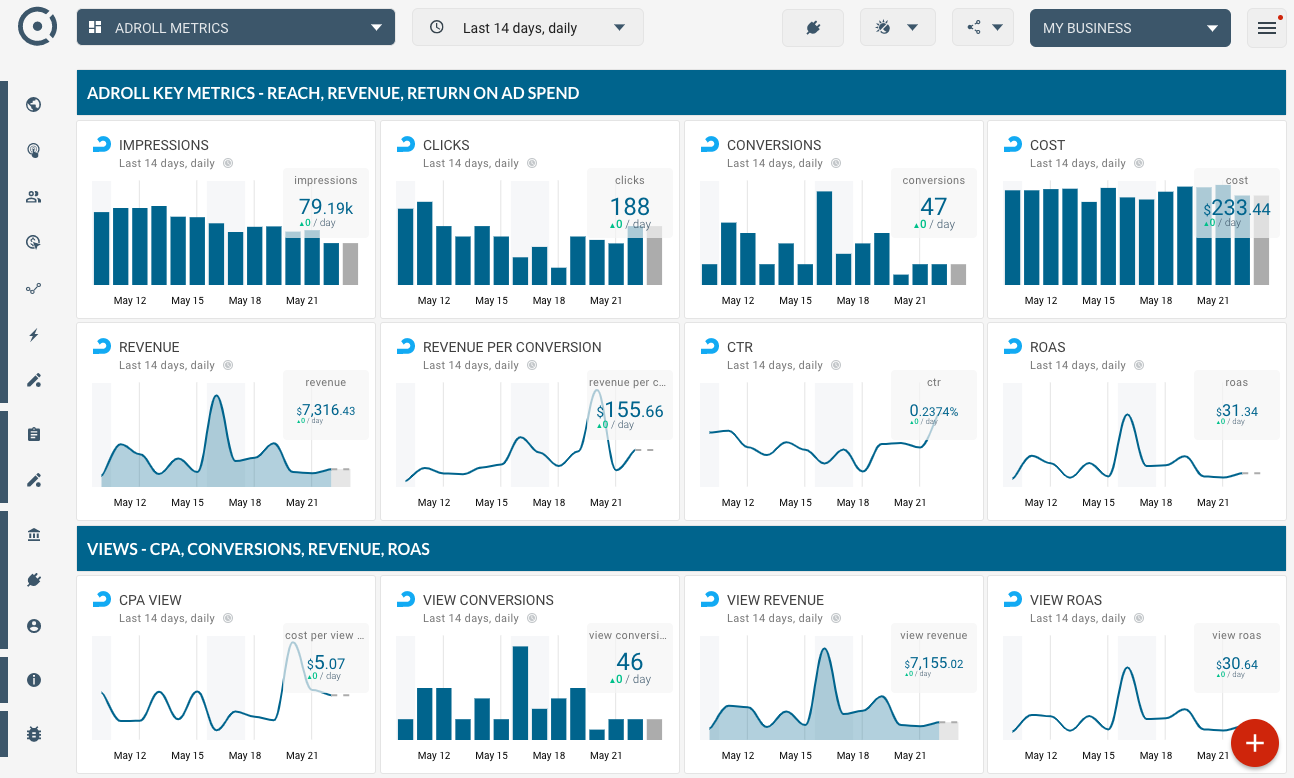
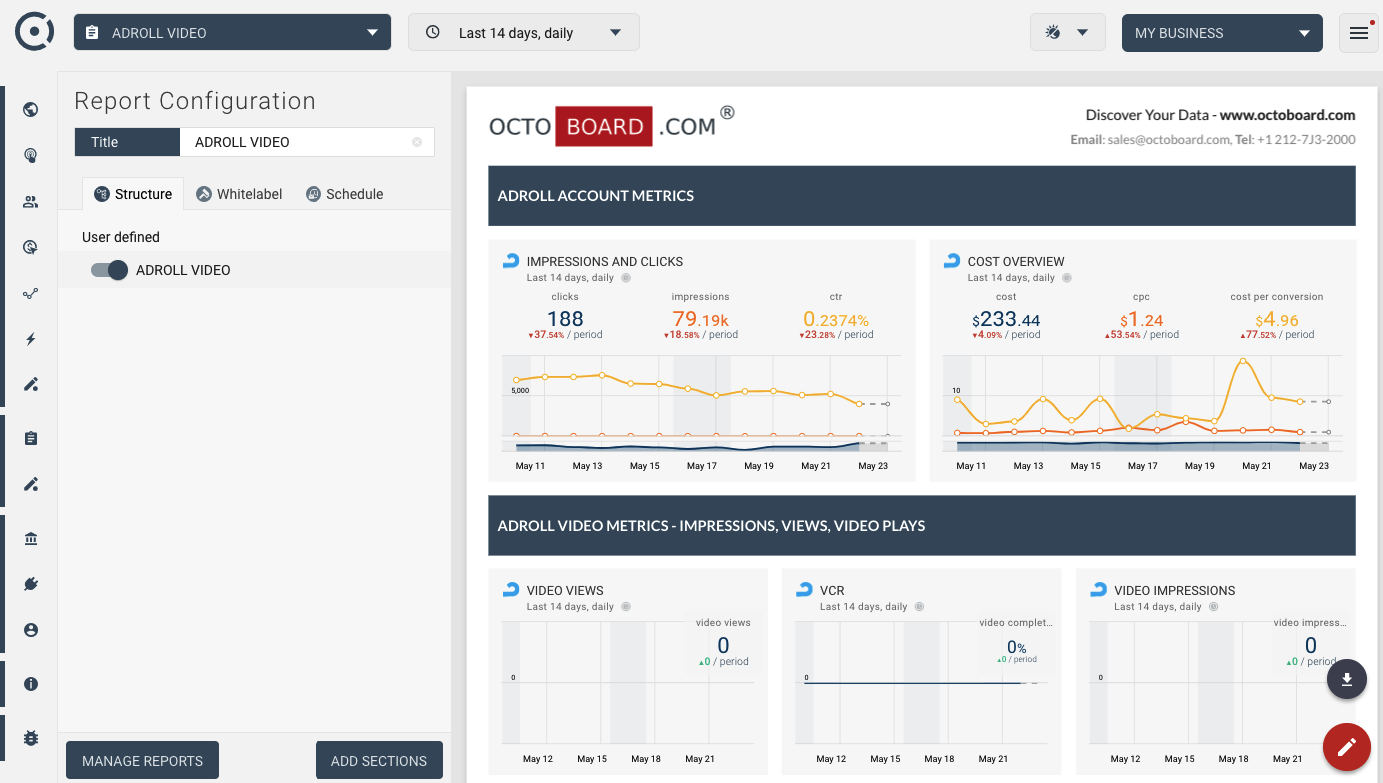
AdRoll Metrics dashboard
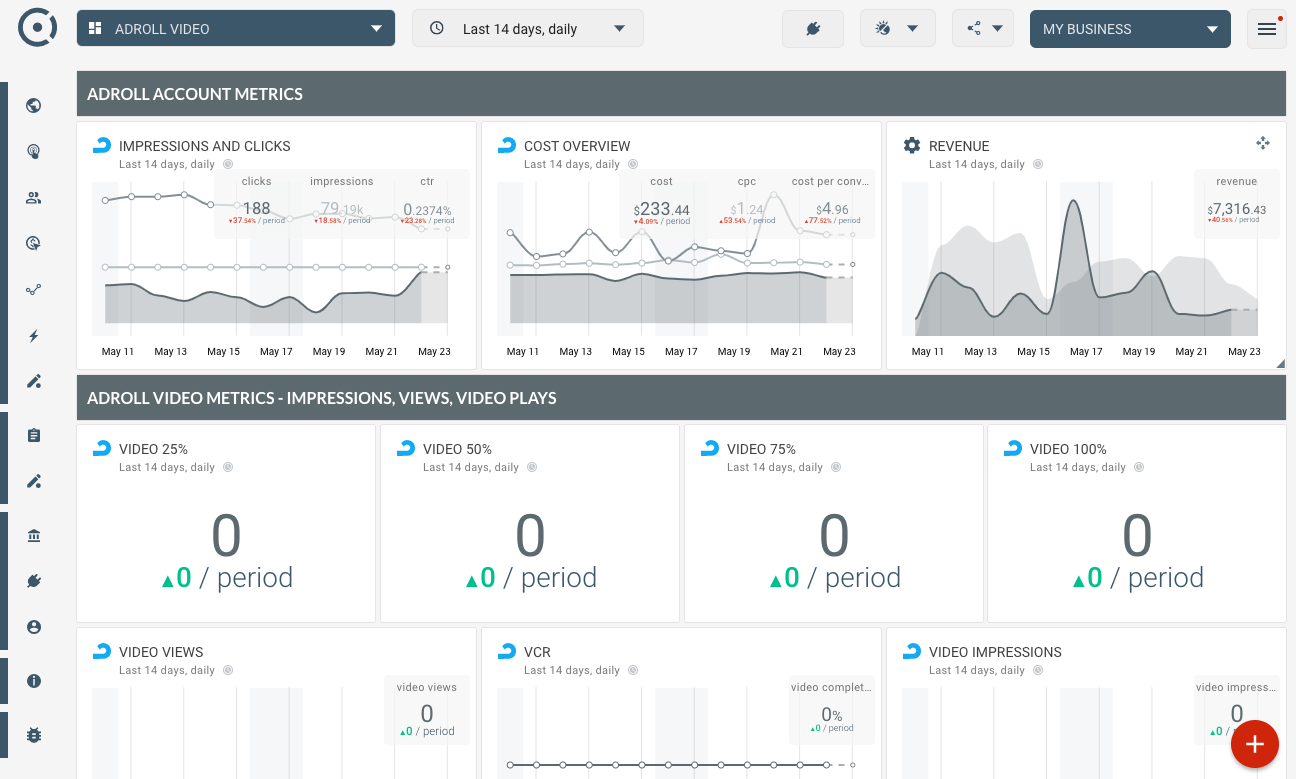
AdRoll Video metrics dashboard
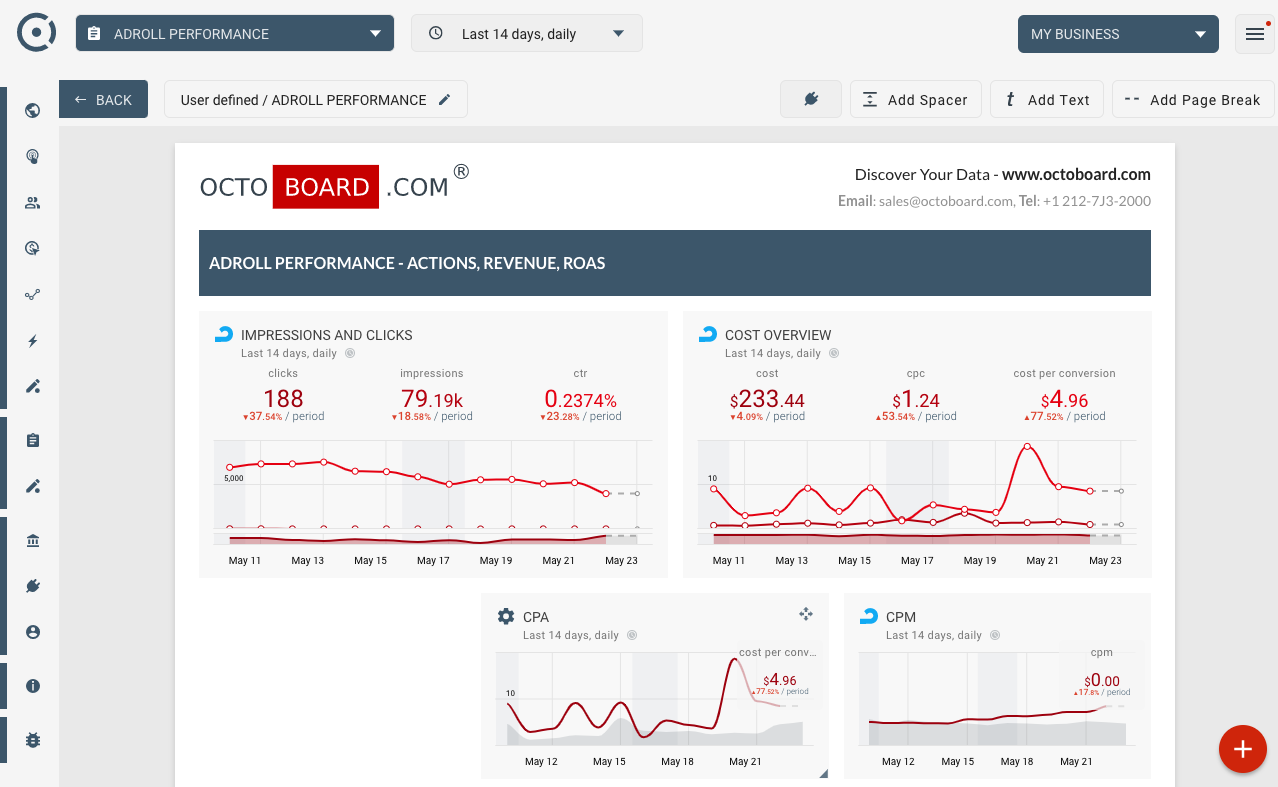
AdRoll Performance template (Report)
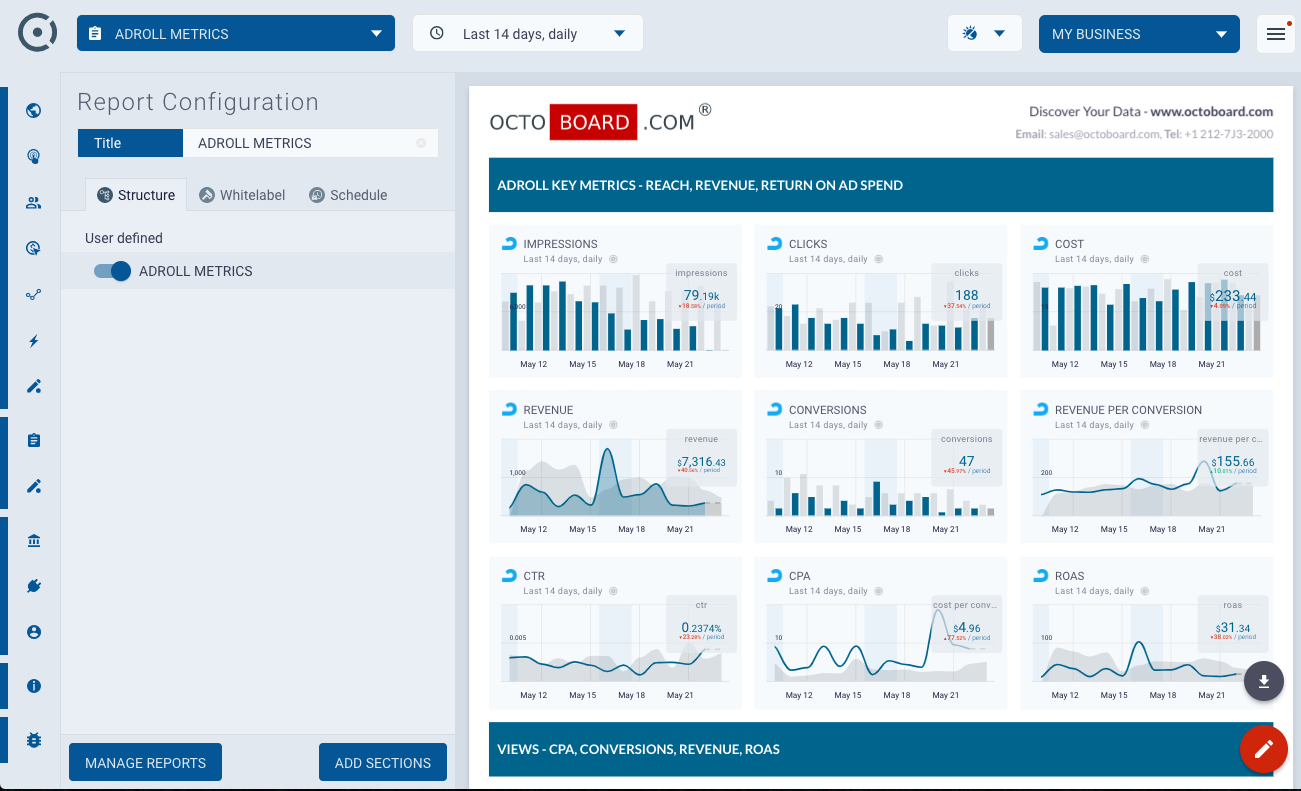
AdRoll Metrics template (Report)