How to automate paid advertising (PPC) reports using Google Ads data
Building automated marketing reports using Google Ads data.

GOOGLE ADS REPORTING
Google Ads performance, cost vs revenue, return on investment and ad ranking.
Google Ads Integration: Building automated Google Ads dashboards and PPC reports using Octoboard
The Significance of Google Ads Metrics for Marketing Teams
For marketing teams striving to demonstrate the impact of their campaigns, the listed Google Ads metrics play an instrumental role:
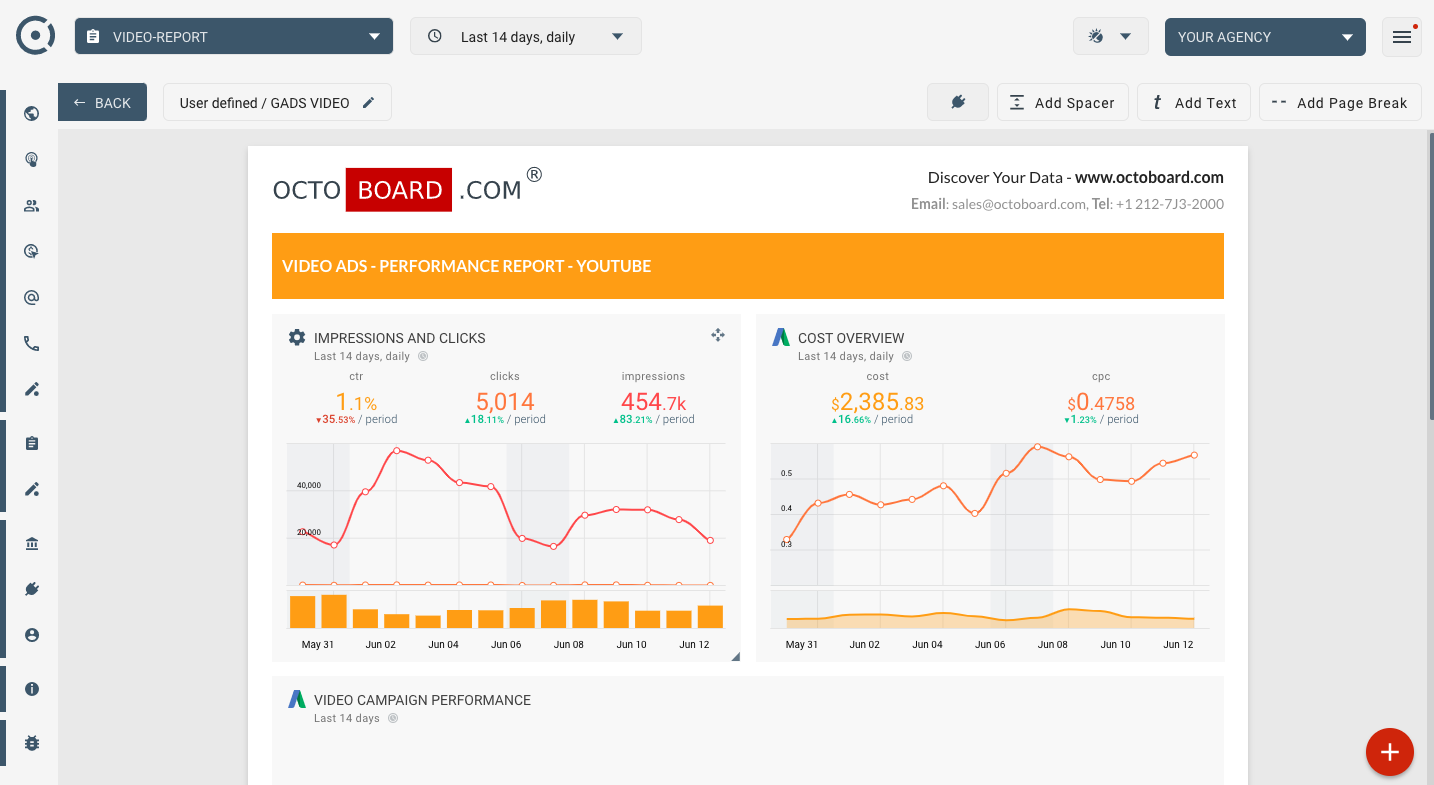
- Google Ads CTR - Allows teams to understand the effectiveness of their ad content in enticing clicks.
- Google Ads Cost - Offers insight into the budget spent on advertising.
- Google Ads Impressions - Indicates the visibility of ads to potential customers.
- Google Ads CPM - Represents the cost incurred for every 1000 ad views, critical for budgeting.
- Google Ads CPC - A measure of the cost per click, vital for understanding ad efficiency.
- Google Ads Clicks - The number of clicks received, showcasing direct engagement.
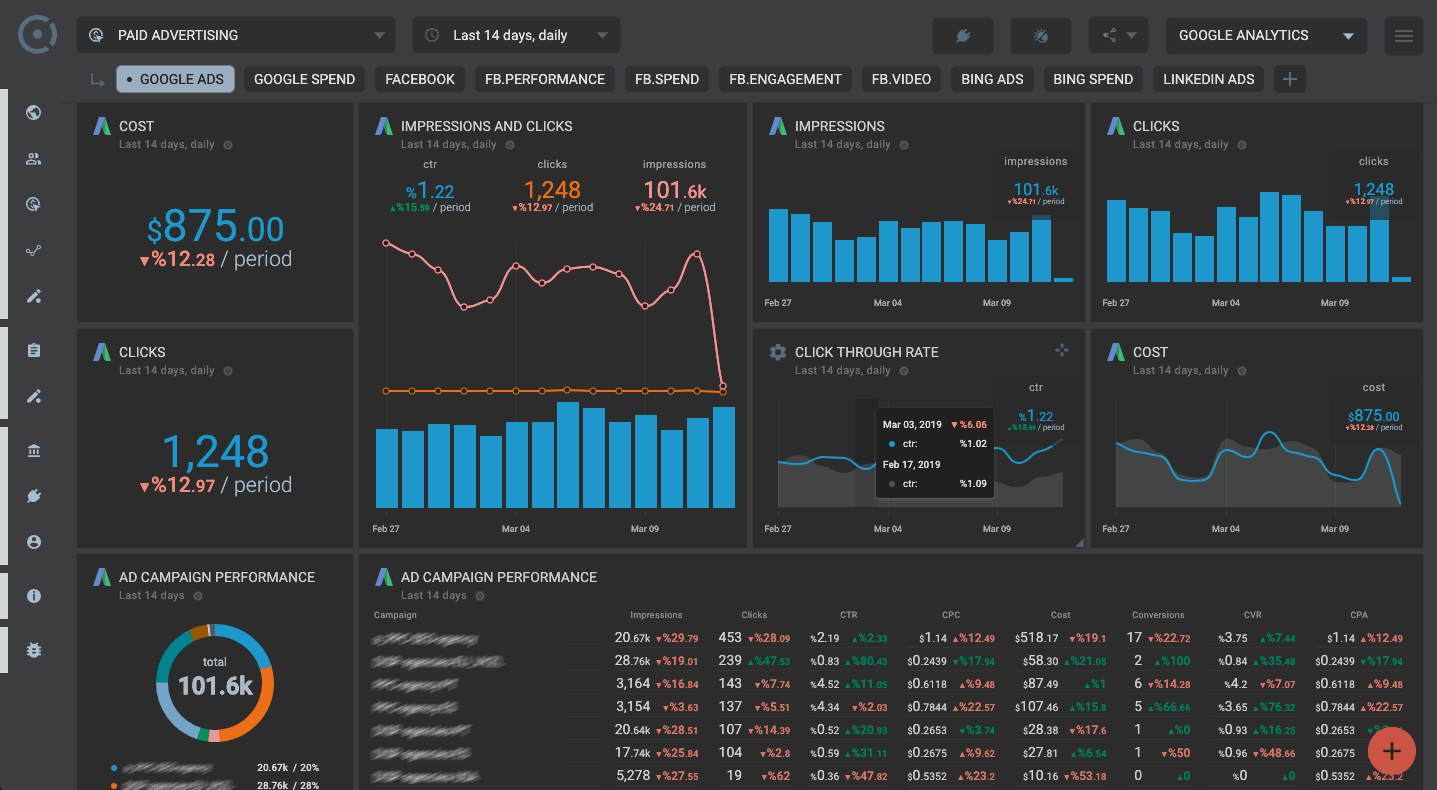
- Campaign Performance - Provides a holistic view of how various campaigns are faring.
- Google Ads Clicks by Country - Offers geographical insights for targeted marketing.
- Google Ads Device Performance - Reveals which devices are garnering more engagement.
Automation with Octoboard: A Time-Saver
In the fast-paced digital marketing realm, automation is no longer a luxury—it's a necessity. The Octoboard Marketing Analytics platform offers streamlined report generation, enabling marketing teams to save time by automating the entire process. By scheduling reports on a weekly or monthly basis, teams and management can stay updated, ensuring transparency in paid advertising endeavors.
One-Stop Solution for PPC Reporting
With the proliferation of multiple PPC channels, consolidating data and metrics becomes a challenge. Octoboard's PPC Analytics platform is the panacea, collating all PPC reports under one umbrella. This unified approach offers clarity and facilitates better decision-making by:
- Eliminating the need for multiple tools.
- Offering a holistic view of various PPC campaigns.
- Ensuring data consistency and accuracy.
Discover more about Octoboard's PPC Analytics module here.
Transcending Traditional Metrics with Octoboard's Advanced PPC Analytics
Beyond just displaying metrics, Octoboard's advanced PPC Analytics module offers tools for creating new metrics, defining dimensions, and deploying formulas to transform data. This flexibility empowers marketing agencies to craft tailored reports, ensuring meaningful insights for their specific needs.
Staying Ahead with Automated Data Trend Monitoring
One of the cornerstones of effective marketing is adapting to trends. Octoboard facilitates this by automatically detecting data trends via metrics like Google Ads CTR, CPC, and more. Leveraging Octoboard's ChatGPT/OpenAI feature, agencies can derive actionable insights to refine their marketing strategies.
Google Sheets Integration: A Bridge to Enhanced Data Viewing
For devops teams and marketers who prefer Google Sheets for its versatility and collaborative features, Octoboard offers the Google Sheets data export feature. With the Google Sheets data add-on, teams can effortlessly send their data to Google Sheets, enjoying the familiar interface and extensive customization options.
In this ever-evolving digital landscape, tools like Octoboard are indispensable for marketing teams. From automating reports to offering advanced analytical capabilities, Octoboard ensures that teams remain agile, informed, and ahead of the curve.
- Real-time performance
- Reach and user actions
- Google Ads return on investment
Automated data reports enabled by Octoboard software
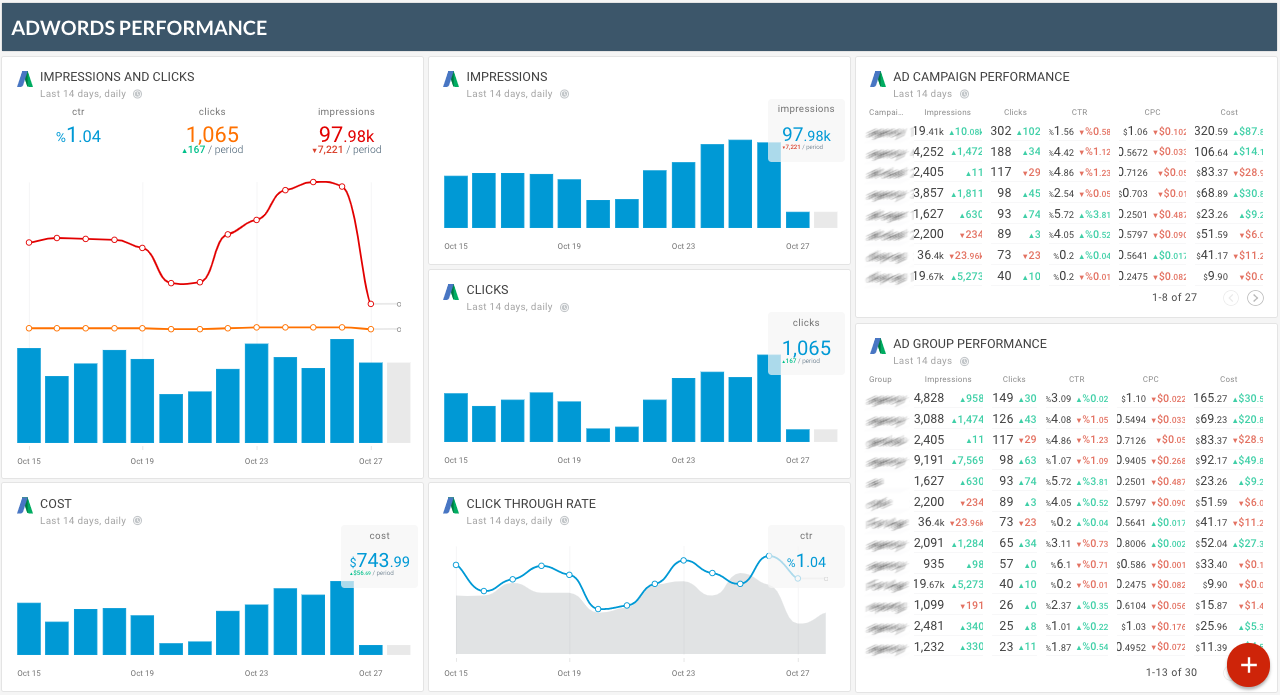
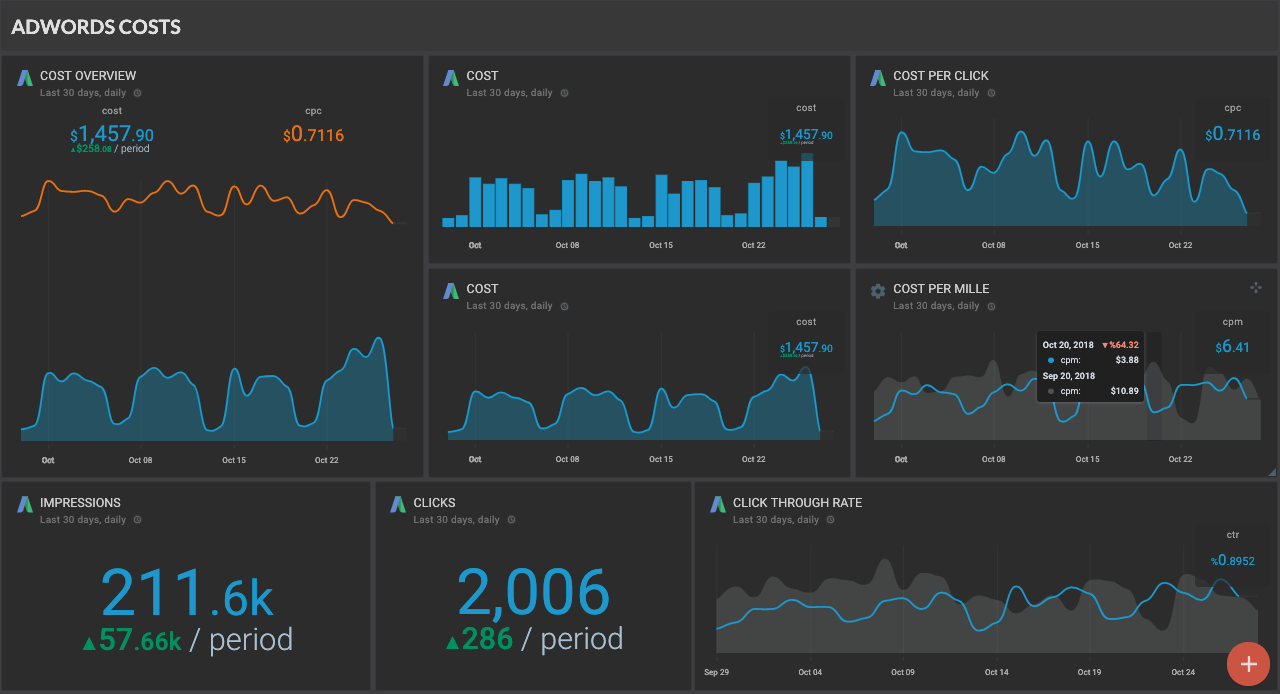
Google Ads PPC dashboard
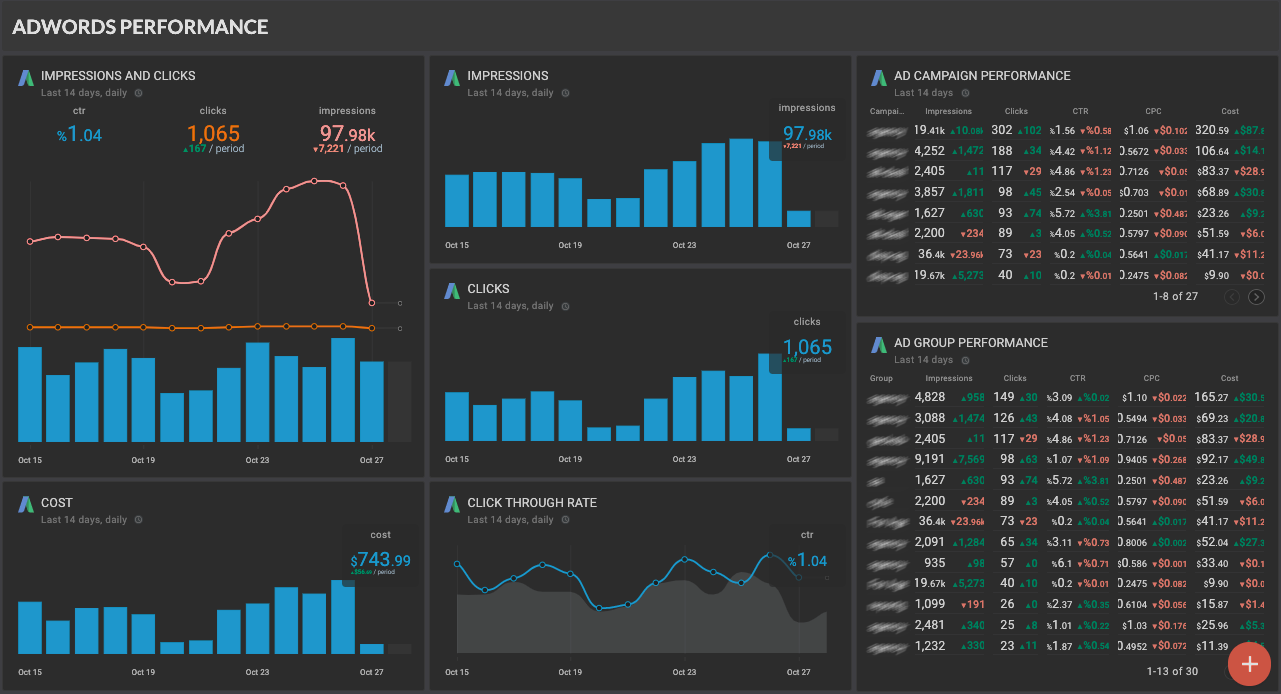
Google Ads PPC Overview (Report)
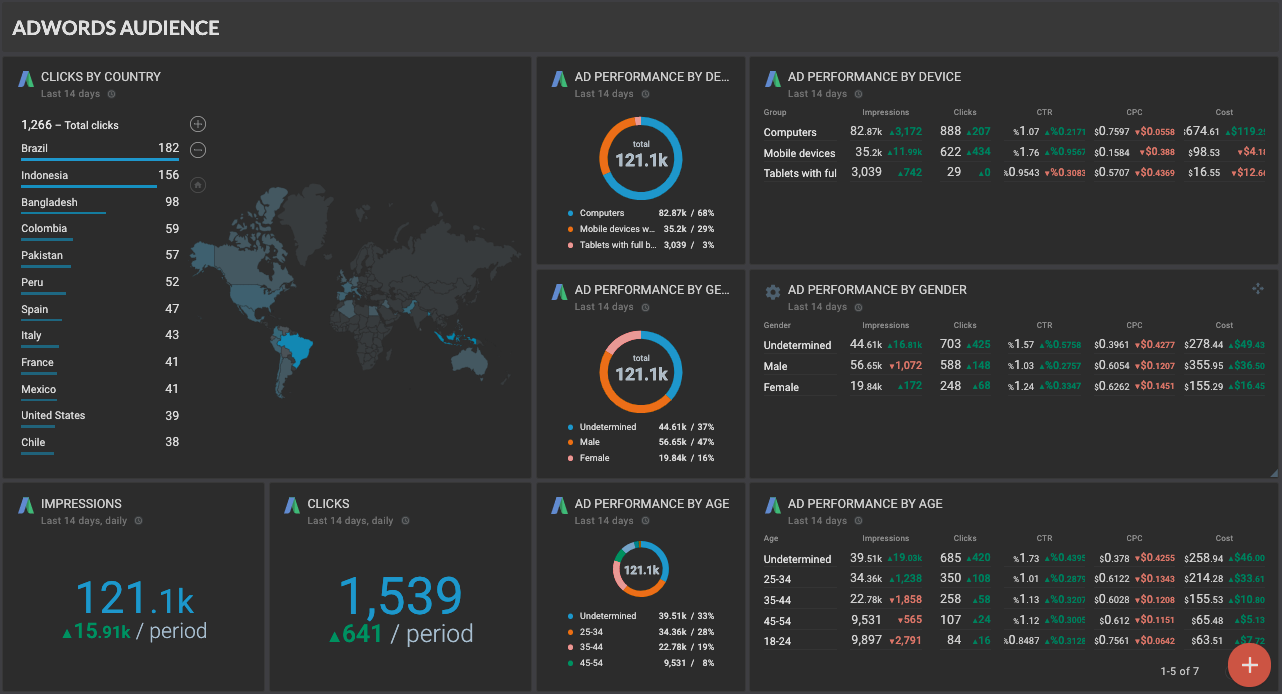
Google Ads PPC template - Audience
Google Ads PPC template - Cost
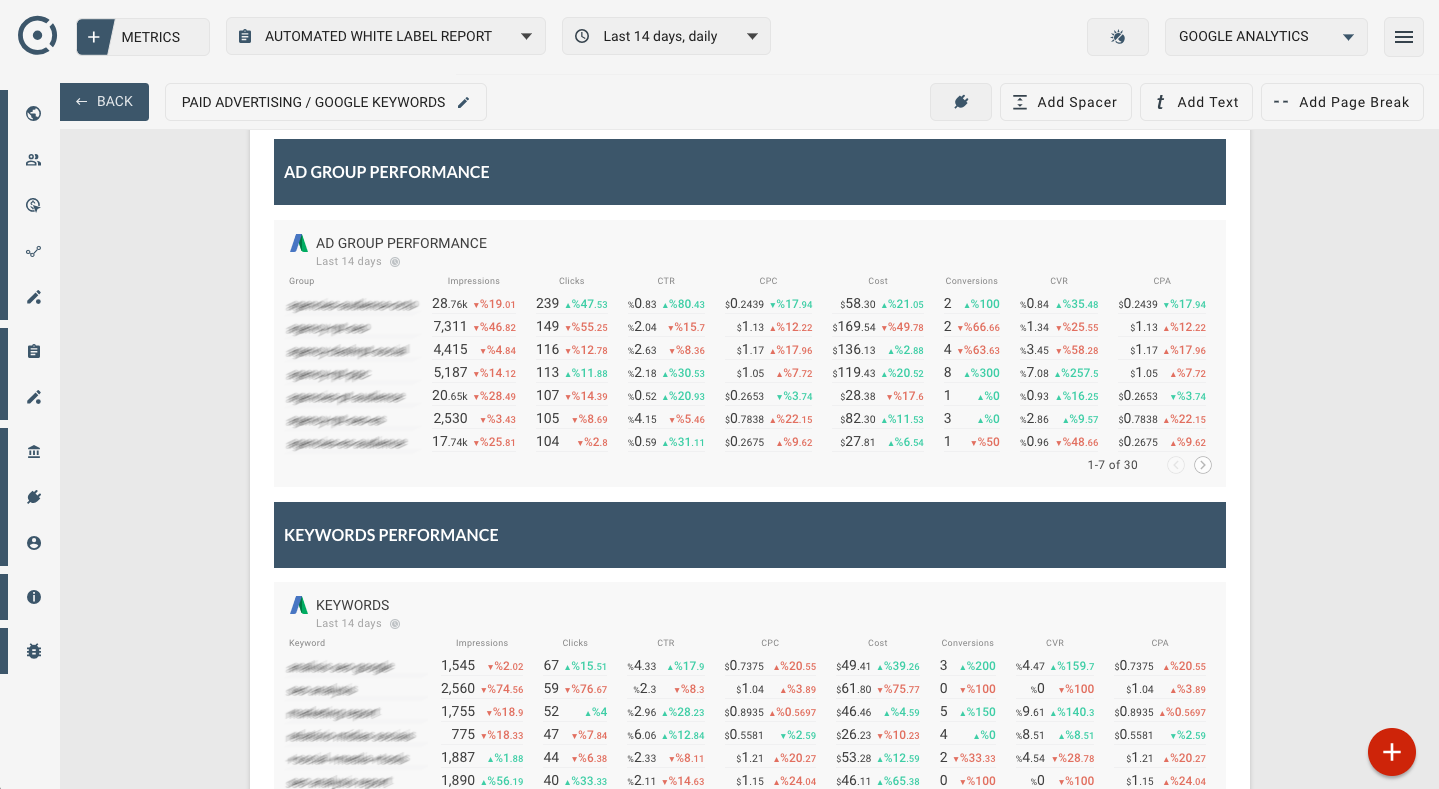
Google Ads PPC Keywords (Report)
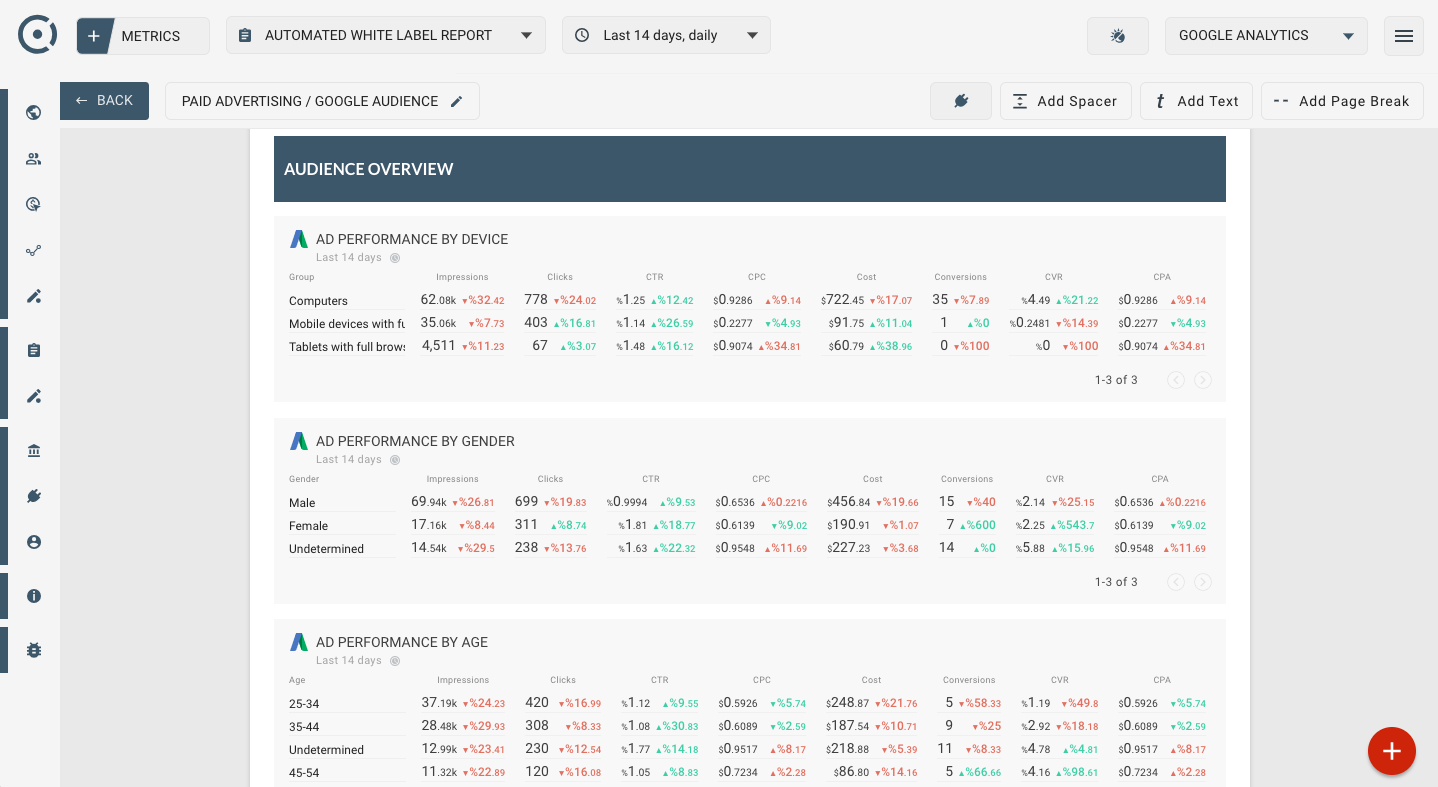
Google Ads PPC Audience (Report)
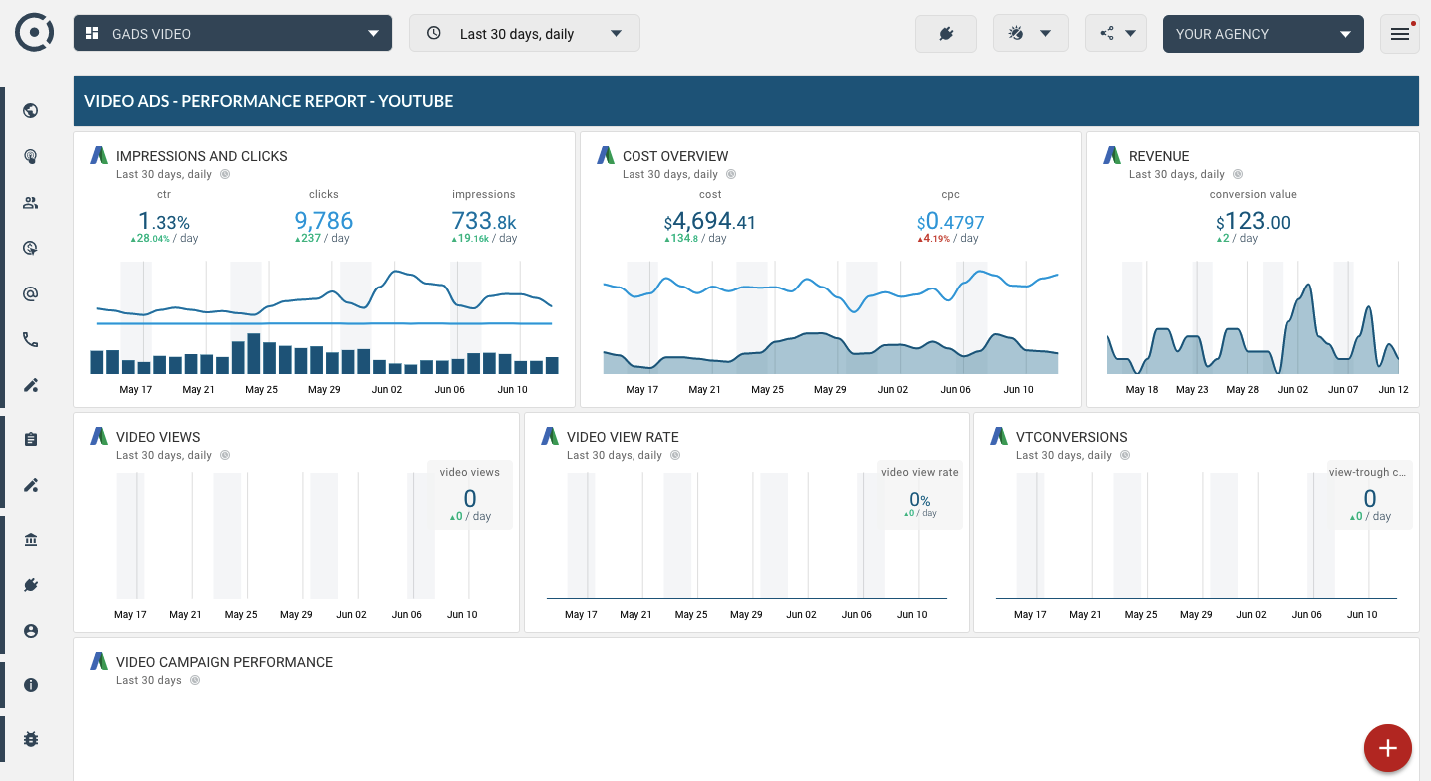
Youtube video (Google ads) dashboard