Marketing reports and dashboards using Yandex data with Octoboard
Use Yandex search engine data to build automated marketing reports and dashboards.

YANDEX METRICA REPORTING
Yandex Metrica web analytics dashboards for website audience, content analysis, traffic sources, eCommerce and general website performance monitoring.
Yandex Metrica Web Analytics Reports for Audience Insights, Content Evaluation, Traffic Sources, eCommerce, and General Website Performance Monitoring
Yandex Metrica delivers a diverse array of web analytics capabilities that empower businesses to understand audience behavior, evaluate website content, identify traffic sources, monitor eCommerce performance, and oversee overall website effectiveness. This robust tool provides actionable metrics that can influence marketing strategies and operational decisions.
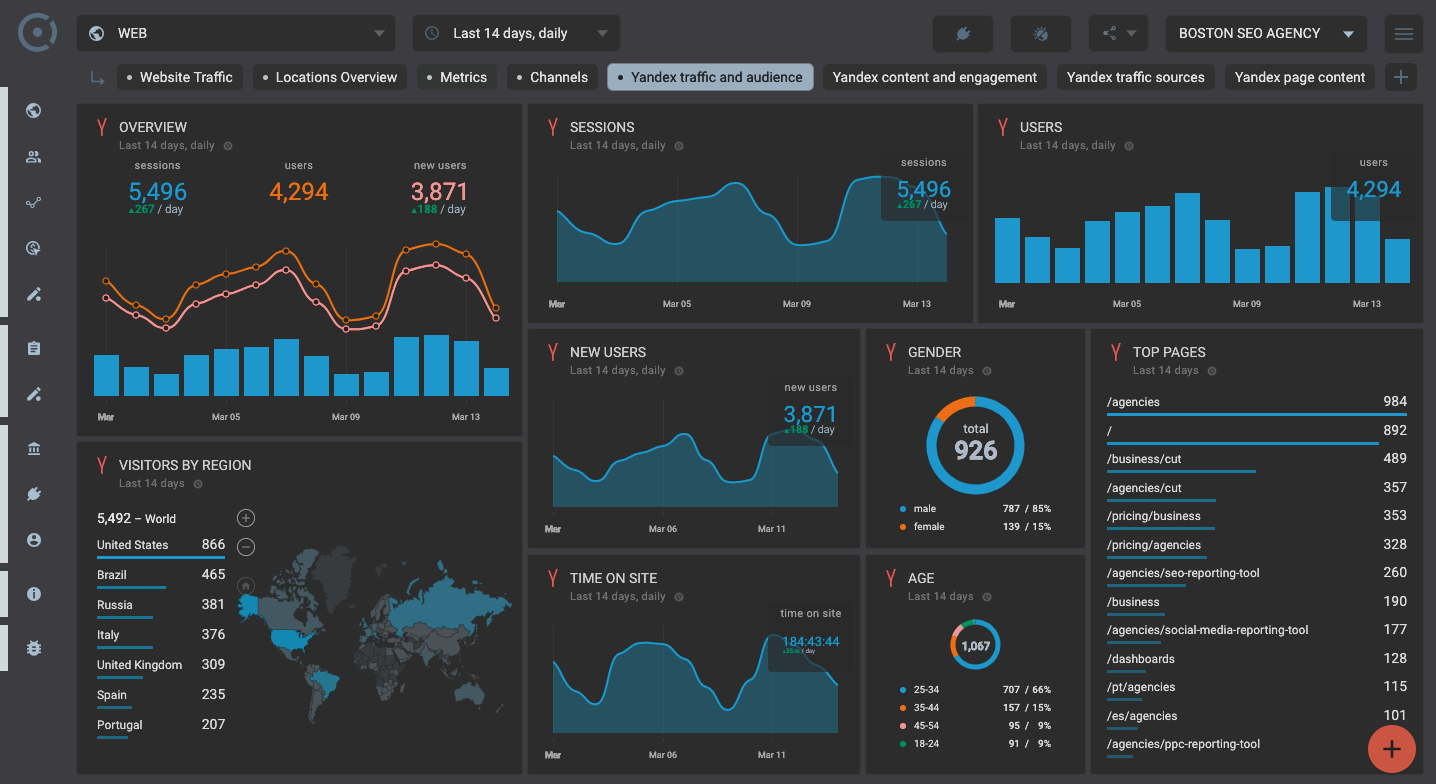
Audience Insights
The audience insights module of Yandex Metrica offers deep demographic data, including geographic distribution. By analyzing where the visitors come from, businesses can tailor marketing strategies to align with regional preferences. Key metrics in this area include:
- Geographic Distribution: Understand the location of visitors, which helps in localizing marketing campaigns.
- Demographic Profile: Gain insights into age, gender, and interests of users to better target content and advertisements.
Content Evaluation
Yandex Metrica helps assess the performance of website content through various metrics. This analysis is crucial for recognizing what type of content attracts users and keeps them engaged. Important metrics in content evaluation include:
- Pageviews: Track which pages garner the most attention, guiding future content creation.
- Content Engagement: Measure how users interact with different aspects of content, revealing what resonates most with the audience.
Traffic Sources
Identifying how visitors arrive at a website is fundamental for effective marketing. Yandex Metrica categorizes traffic sources to help understand which channels drive the most visitors. Key sources include:
- Organic Search: Evaluate performance from search engines, informing SEO strategies.
- Referral Traffic: Analyze traffic from other websites and partnerships, helping to identify strong backlink opportunities.
- Social Media: Monitor traffic derived from social networks, aiding in the assessment of social marketing efforts.
eCommerce Monitoring
For online retailers, tracking eCommerce performance is essential. Yandex Metrica provides tools for analyzing sales data and user behavior concerning products. This includes:
- Conversion Rates: Measure the percentage of visitors that complete a desired action, like making a purchase.
- Order Tracking: Analyze the number of orders received and the products sold to determine sales trends.
General Website Performance
Monitoring general website performance is critical for maintaining user satisfaction. Yandex Metrica offers metrics that can help pinpoint areas for improvement:
- Average Session Duration: This metric tracks how long users stay on the site, indicating the effectiveness of engagement strategies.
- Bounce Rate: Understand the percentage of visitors who navigate away after viewing only one page, which can reveal issues in content or user experience.
Automation and Reporting
Integrating Yandex Metrica with reporting tools like Octoboard can streamline data management and reporting processes. Automated reporting features contribute significantly to efficiency. Key benefits include:
- Quick Report Generation: Automated tools save time by swiftly compiling data into comprehensive reports.
- Regular Updates: Marketing teams can automate the scheduling of reports, ensuring consistent performance reviews and timely insights.
User Engagement Indicators
Yandex Metrica also tracks user engagement through several key indicators. These metrics can help businesses enhance user experience and content relevance. Vital engagement indicators include:
- Active Users: Know the number of people actively interacting with the site in real time.
- Return Visitors: Analyze the ratio of returning users to gauge loyalty and satisfaction.
Multi-Channel Analytics
The ability to gather insights from various marketing channels creates a more comprehensive view of performance. Yandex Metrica allows for multi-channel analysis, which includes:
- Performance Comparison: Marketers can compare how different traffic sources perform relative to each other.
- ROI Assessment: This integrated analysis helps in determining the effectiveness of marketing investments across channels.
Data Management and Accessibility
Effective data management is pivotal for decision-making. Yandex Metrica's ability to export data into platforms like Google Sheets allows for flexibility in data handling. Key features include:
- Data Export Options: Easily export data for further analysis or custom reporting.
- Shared Access: Google Sheets allows team members to access and collaborate on data from anywhere.
Conclusion
The variety of metrics and tools provided by Yandex Metrica makes it an invaluable resource for businesses looking to analyze their web performance comprehensively. By leveraging audience insights, content evaluation, traffic sources, eCommerce tracking, and performance monitoring, companies can make data-driven decisions that enhance marketing efficiencies and drive growth. The integration of automated reporting solutions further streamlines these processes, allowing marketing teams to focus on strategy and implementation rather than manual data compilation. Through these insights, businesses can maintain a competitive edge in the digital landscape.
Automated Data Reports Enabled by Octoboard Software
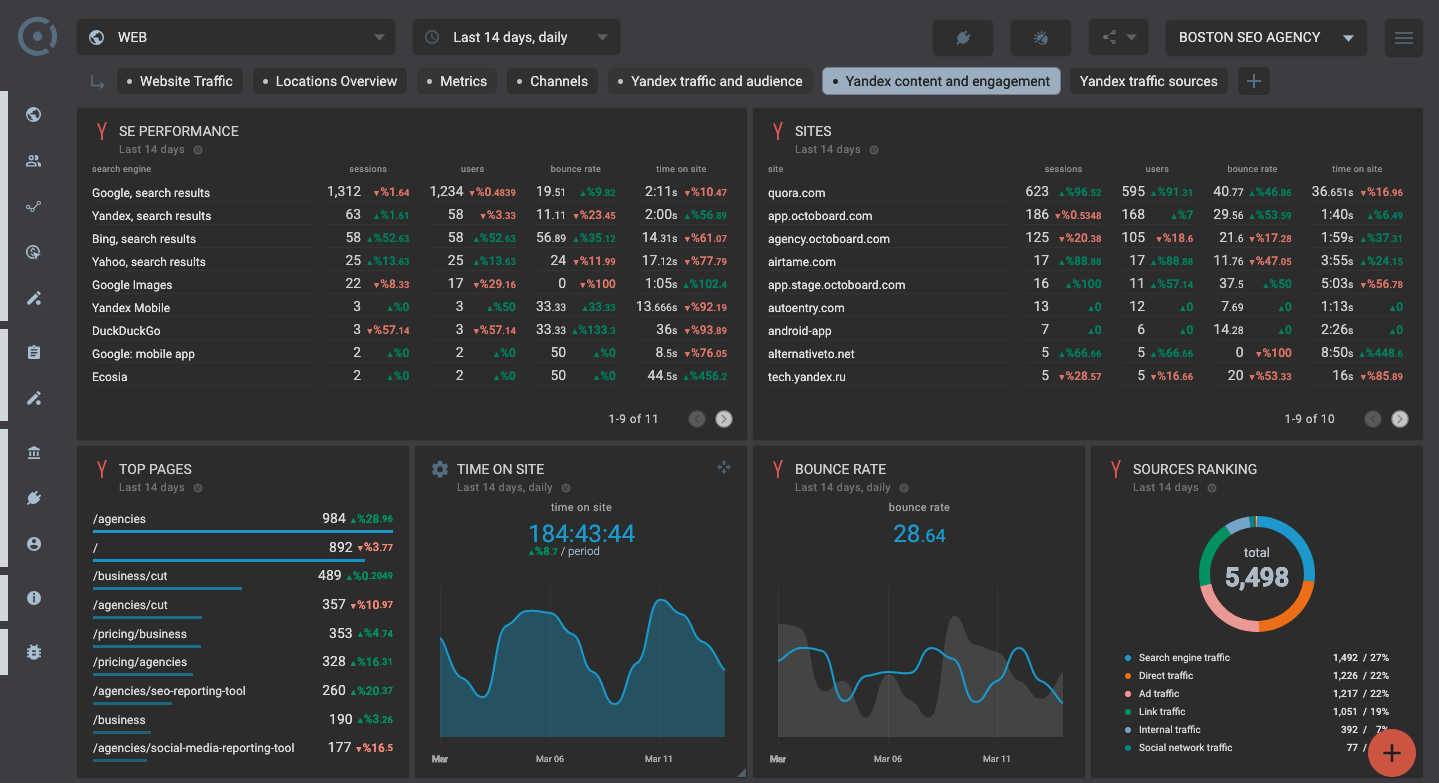
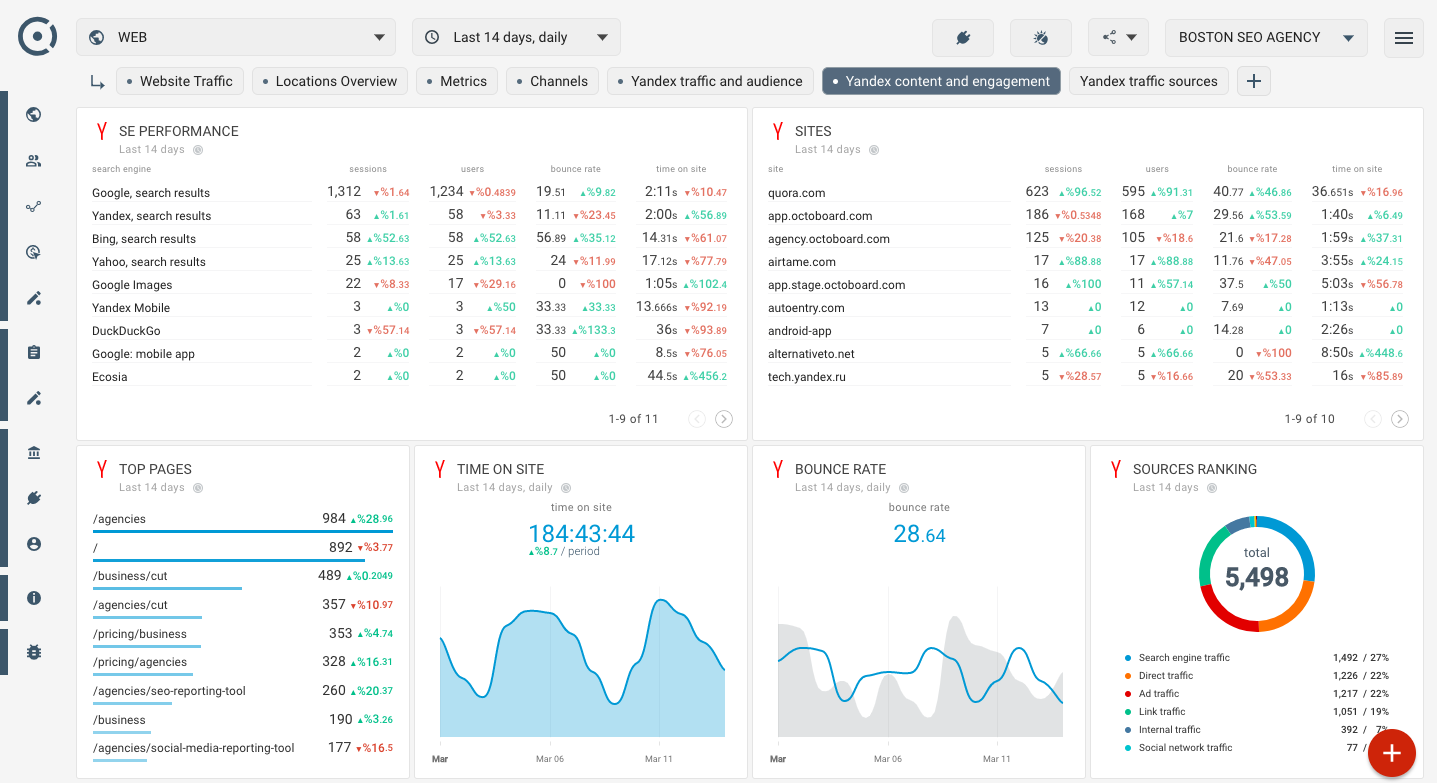
Yandex Analysis of Content and User Engagement
The review of content and traffic origins utilizes Yandex Metrica to provide insights into performance.
- Content Assessment: Metrics reveal which content performs best to optimize engagement strategies.
- Traffic Sources: Identifies and evaluates various channels driving traffic, allowing for targeted improvements.
This systematic analysis aids in making data-driven decisions for content enhancement and audience reach.
Yandex Metrica Metrics
GENERAL OVERVIEW
An overview of the key metrics that reflect website activity over time, including sessions, user totals, and new visitors.
- Sessions: The total count of visits to the website.
- Unique Users: The number of distinct visitors during a given time frame.
- New Users: The count of visitors who are accessing the website for the first time.
VISIT COUNTS
The quantity of visits to the website over a specified period.
VISITOR TOTALS
A record of visitors to the site tracked over time.
FIRST-TIME VISITORS
Metrics concerning visitors who are accessing the website for the first time.
PAGE VISITS
A performance metric indicating page popularity based on the number of views.
This displays the ranking of pages based on total visits received.
There is a wealth of visitor information available, including demographics and geographic information. Yandex Metrica offers insights such as age, gender, location, device usage, and technology preferences. Utilizing these tools can help understand the interaction levels of different audience segments with the site's content.
AGE DEMOGRAPHICS
Reports that categorize visitors by age based on session data.
This analysis employs advanced technology to derive demographic insights regarding user groups.
Note: Only sessions from users identified by age and gender are reported.
AGE-BASED PERFORMANCE
Performance assessment across various age groups.
This metric allows for understanding how different content appeals to age demographics.
GENDER DEMOGRAPHICS
Statistics regarding the gender composition of visitors based on session data.
GENDER-BASED PERFORMANCE
Assessment of site effectiveness segmented by gender.
Monitoring this can provide insights regarding content relevance to different genders.
REGION ANALYSIS
Insights regarding visitor traffic by geographical locations, displayed on a map.
Countries and regions are explored to understand the distribution of sessions.
DEVICE USAGE
Insight into types of devices used by visitors, tracked over time.
DEVICE-BASED PERFORMANCE
Performance metrics related to different device categories.
BROWSER USAGE
Statistics on visitor browser preferences tracked over time.
BROWSER-BASED PERFORMANCE
Assessment of site performance across various web browsers.
To assess content quality, metrics such as time spent on the site, bounce rate, and exit rate should be monitored closely. Variations in these metrics may warrant further exploration, particularly in relation to content modifications. It is crucial to analyze how spikes in traffic correlate with changes in content or source adjustments to effectively tailor landing pages or ad campaigns.
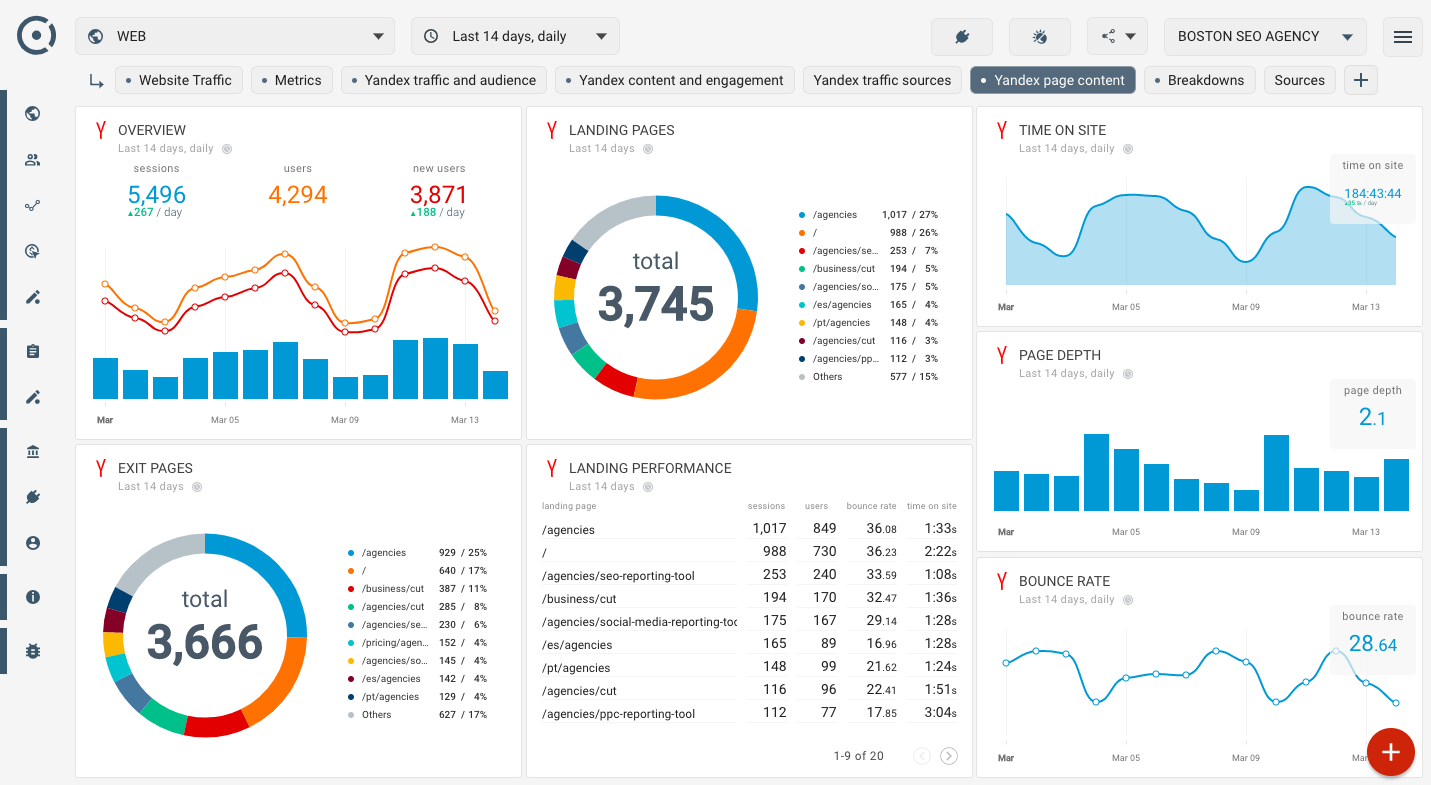
TOP VISITED PAGES
Ranking of the most visited pages based on unique user counts.
LANDING PAGES
Performance metrics for landing pages categorized by the number of visits.
LANDING PAGE ANALYSIS
Details rankings of top landing pages, including total sessions, unique users, and bounce rates for each page.
EXIT PAGES
Tracks the pages through which users most frequently exit, including session numbers and bounce rates.
BOUNCE RATE
A metric detailing the percentage of visitors who leave the website after viewing only one page.
PAGE DEPTH
This metric refers to the number of pages users view during their visit.
AVERAGE TIME ON SITE
Tracks the total duration visitors spend on the site over time.
This provides an aggregate of time spent in minutes and seconds.
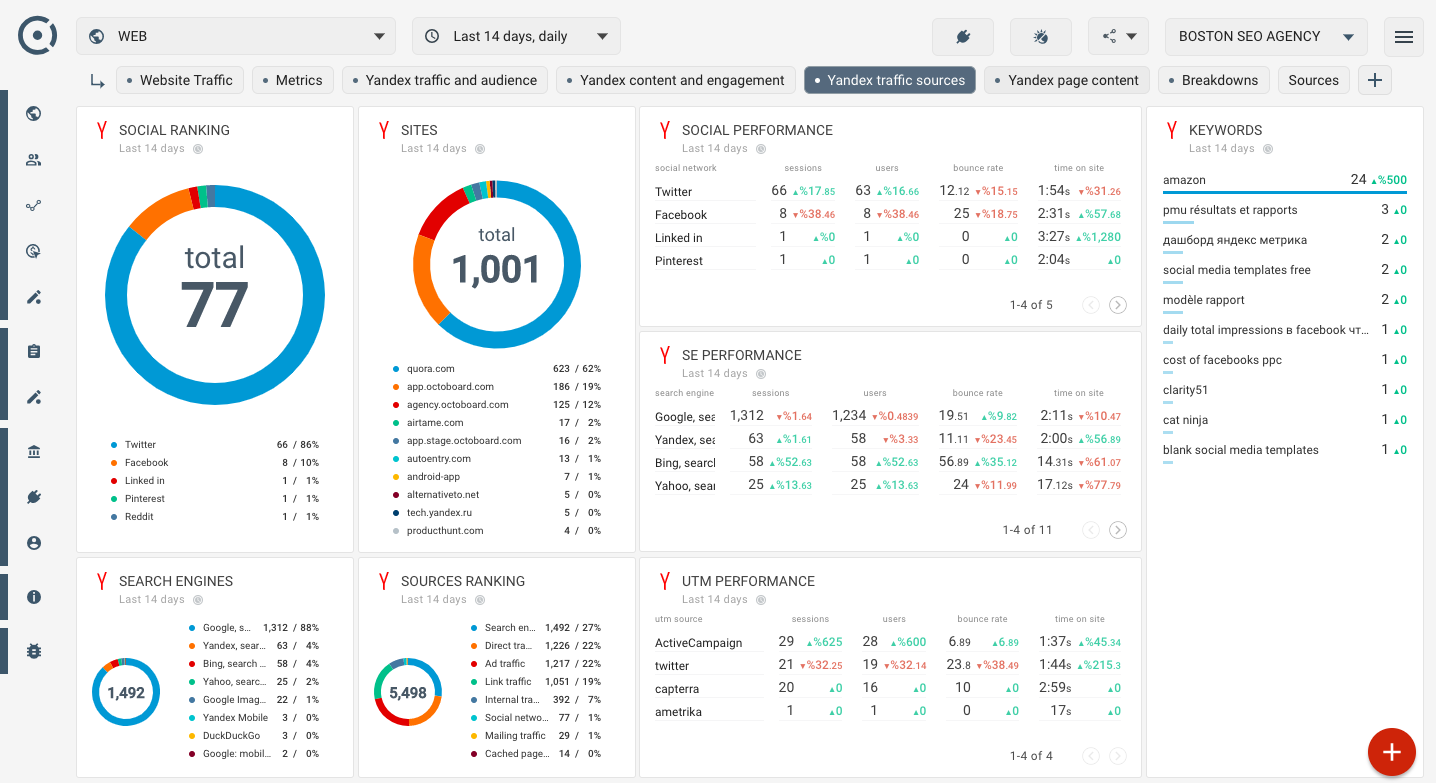
TRAFFIC SOURCES RANKING
Analyzes which sources bring the most visitors by session count.
SOURCE PERFORMANCE
Performance metrics evaluating traffic from various source sites, including sessions, unique users, bounce rates, and time spent.
SOCIAL SOURCES RANKING
Ranks social media networks according to the number of sessions they generate.
SOCIAL MEDIA PERFORMANCE
Performance metrics for traffic originating from social networks tracked by user interactions.
SEARCH ENGINE TRAFFIC
Metrics detailing traffic generated from search engines, based on session counts.
SEARCH ENGINE PERFORMANCE
Performance assessment of traffic from search engines, including metrics on sessions, users, bounce rates, and time on site.
KEYWORD ANALYSIS
A ranking of keywords based on session frequency.
KEYWORD PERFORMANCE
Metrics assessing the performance of search keywords, including session counts, unique users, and bounce rate trends.
PPC NETWORKS TRAFFIC
An overview of session counts generated from pay-per-click networks.
PPC NETWORK PERFORMANCE
Performance metrics for pay-per-click networks, including sessions and user engagement data.
UTM TAGS RANKING
Session counts attributed to various UTM tags.
Tip: UTM tags help track the source and effectiveness of campaigns by coding URLs to distinguish traffic origins.
UTM TAG PERFORMANCE
Details performance metrics for UTM tags, including session data, user counts, and engagement statistics.
CONVERSION METRICS
Insights into eCommerce performance through key metrics.
This evaluates orders, purchased items, and popular product trends.
TOTAL ORDERS
Metrics detailing the performance of orders, encompassing the number of purchases and users engaging with purchases.
- Total Sessions: Count of all visits.
- Users With Purchases: Users who bought items.
- Total Revenue: Revenue generated from all sessions.
ITEMS SOLD
Metrics analyzing the total number of items sold in sessions.
- Total Sessions: Observes the number of visits.
- Total Purchased Items: Counts items acquired across all sessions.
- Total Revenue from Sales: Tracks the cost of all items acquired.
POPULAR PRODUCTS
Tracks total product engagement, including views and purchase activity.
- Total Sessions: Count of total visits.
- Total Item Views: Highlights product page views over all sessions.
- Users Viewing Products: Reflects the total visitors interested in at least one item.
- Items Added to Cart: Captures the number of items added to user carts during sessions.
- Total Purchased Items: Provides the count of items bought.
AVERAGE TIME ON SITE PER SESSION
Tracks the average duration users spend on the site within a given session timeframe.
This metric provides a detailed average duration available for analysis.