How to build advanced automated SEO reports using Google Analytics data
Building automated SEO reports using Google Analytics data is easy.

GOOGLE ANALYTICS (UA) REPORTING
Google analytics dashboards for audience, content analysis, goals and ecommerce metrics monitoring.
Google Analytics reports for Audience, Content Analysis, Goals, and Ecommerce Metrics Monitoring
Google Analytics is essential for marketing teams, providing a wide range of metrics to track user engagement and boost strategies. Automated dashboards leverage this data to present insights in a clear manner while saving valuable time.
Key Metrics for Audience Insights
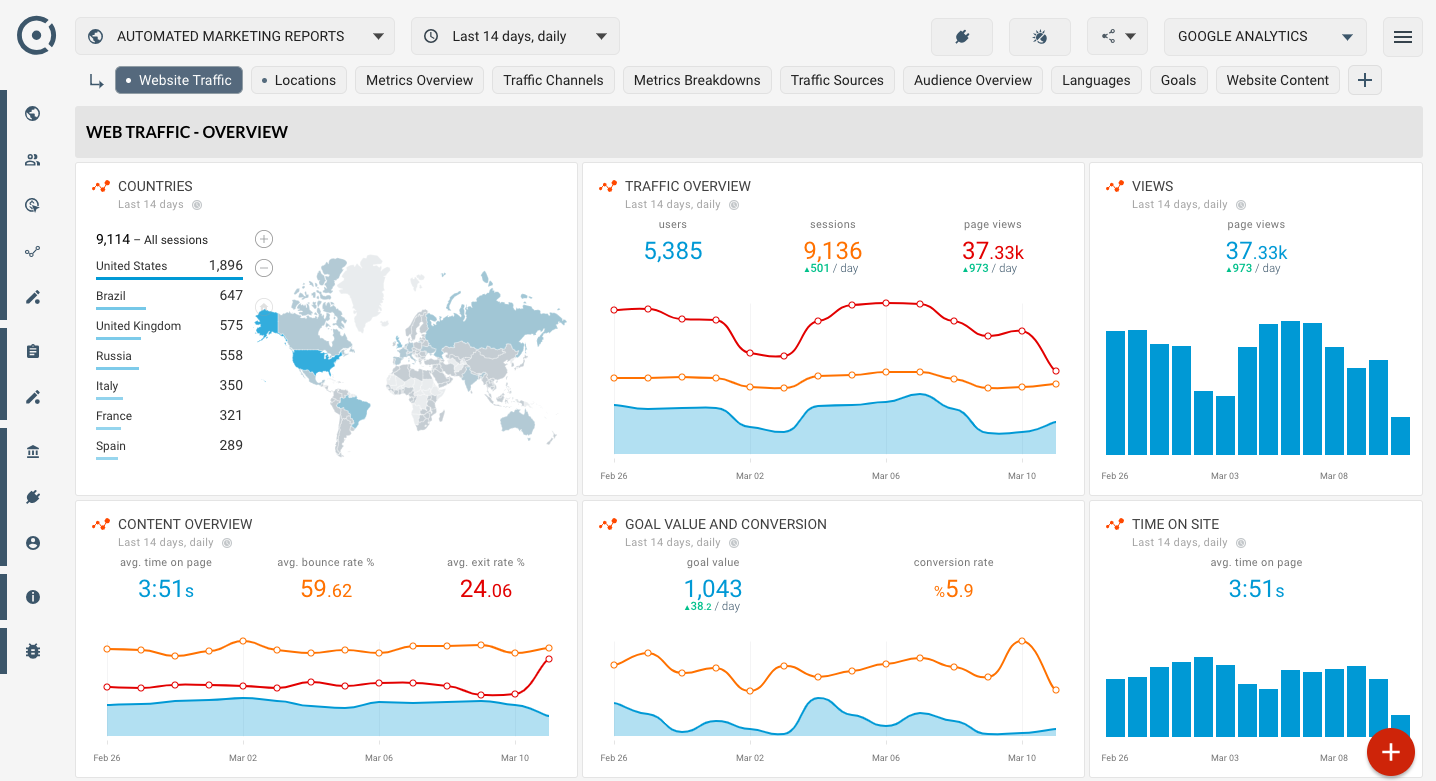
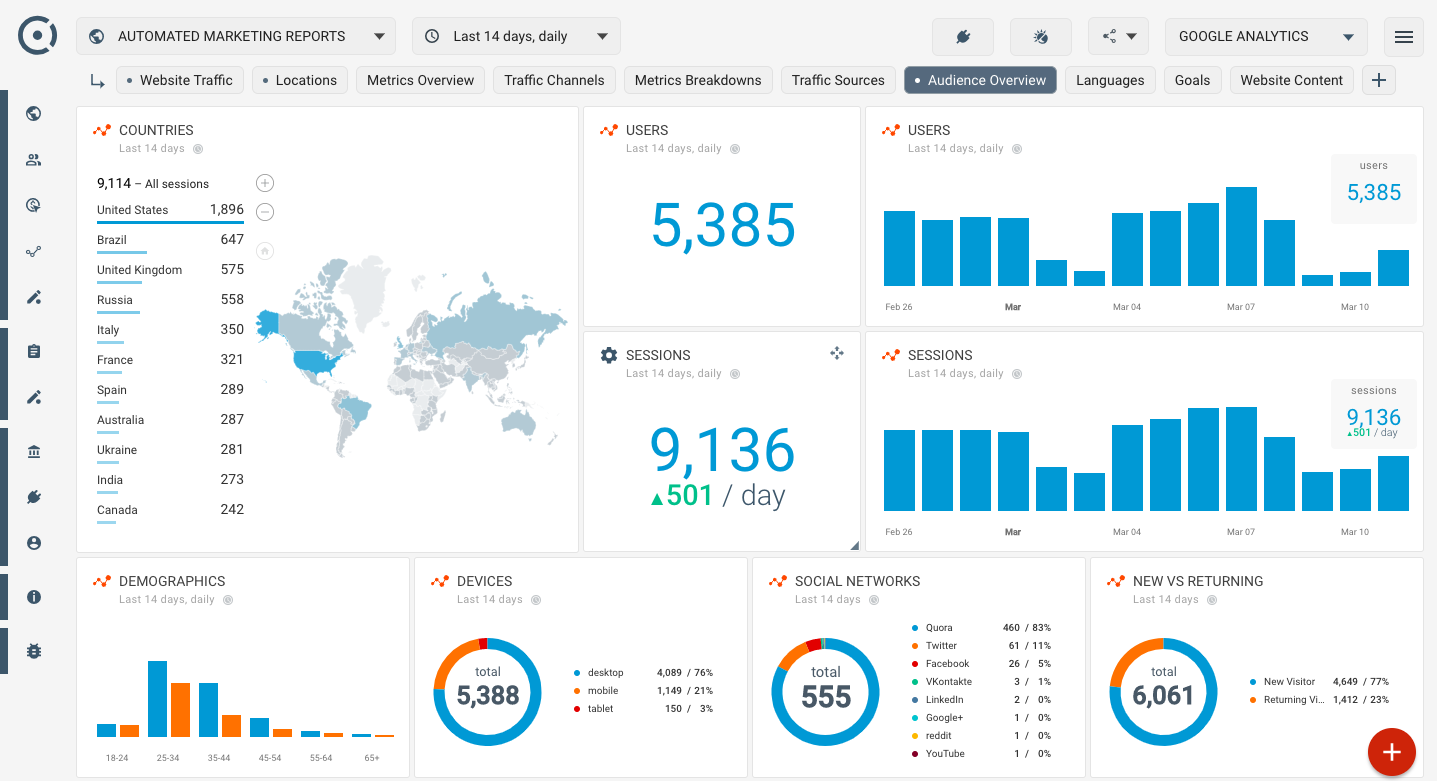
- Users: Total unique individuals visiting the website.
- Sessions: Count of distinct sessions initiated by users.
- Countries: Geographic insights into user origins.
- Demographics: Age, gender, and other demographic insights on users.
- New vs. Returning Visitors: Distinction between first-time users and those who return.
- Devices: Information on the devices used to access the site.
- Social Networks: Identification of social platforms driving the most traffic.

Importance of Content Analysis
Content quality impacts user engagement and search rankings. Dashboards can help in assessing the performance of various content types:
- Page Views: Number of times a specific page is viewed.
- Average Time on Page: How long users typically spend on a page, indicating content engagement.
- Bounce Rate: Percentage of users who leave the site after viewing only one page, highlighting content relevance.
- Exit Rate: Insight into the last page users visited before leaving, helpful for optimizing content flow.
Goal Tracking and Website Performance
Setting and tracking goals within Google Analytics is a foundational element that aids marketing teams in measuring success:
- Goal Completions: Count of how many times users completed a desired action.
- Goal Conversion Rate: Percentage of sessions that resulted in a goal completion.
- User Engagement Metrics: Insights into click-through rates and other engagement indicators indicate how well goals are met.
Ecommerce Performance Monitoring
For businesses engaged in online sales, tracking ecommerce-specific metrics is vital. Dashboards can display:
- Revenue: Total income generated from sales.
- Transaction Count: The number of completed purchases.
- Average Order Value (AOV): Revenue divided by the total number of transactions, indicating spending patterns.
- Conversion Rate: The percentage of visitors who make a purchase, crucial for assessing the effectiveness of sales strategies.
The Advantages of Automated Reporting with Octoboard
Manual reporting can be burdensome and time-consuming, but integrating Google Analytics with Octoboard simplifies this process. Automated dashboards offer:
- Time Savings: Reduced hours spent on creating and compiling reports.
- Real-Time Insights: Immediate access to data, enhancing decision-making and transparency.
- Scheduled Reporting: Regularly timed delivery of updates to stakeholders, available weekly or monthly.
Unified SEO Reporting
Centralizing various SEO data streams allows companies to view comprehensive analytics across all channels. Octoboard helps bring together:
- Organic Traffic Analysis: Understanding where traffic originates.
- Social Media Engagement Metrics: Assessing contributions from social platforms.
- Ad Spend Insights: Monitoring the effectiveness of paid advertising efforts.
This integrated approach minimizes data fragmentation and supports an overall perspective on digital marketing strategies.
Advanced PPC Analytics
Pay-per-click (PPC) advertising necessitates thorough analysis to maximize returns. Octoboard equips teams to:
- Customize Metrics: Tailor data points to suit specific campaign needs.
- Leverage Advanced Calculations: Apply complex formulas to evaluate PPC performance.
- Streamline Reporting Processes: Create cohesive reports spanning various PPC platforms.

Actionable Insights from Automated Data Tracking
Monitoring data trends continuously can help marketing teams stay ahead. Key benefits include:
- Trend Detection: Identifying shifts in user behavior swiftly.
- Strategic Adaptation: Adjusting marketing strategies in response to real-time insights.
- Consistent Performance Monitoring: Regular assessments ensure marketing initiatives remain effective.
Collaborative Data Accessibility
With features like Google Sheets integration, Octoboard enhances team collaboration:
- Seamless Data Transfer: Quick exporting of data to Google Sheets for further analysis.
- Real-Time Collaboration: Team members can work together without hindrance.
- Custom Visualizations: Flexibility to create personalized data presentations and analyses.
Summary of Effective Metric Grouping
To maximize the impact of dashboards, effective grouping of Google Analytics metrics is advisable. The most useful categories include:
- Audience Behavior: Metrics revealing user interactions and demographics.
- Content Quality: Assessing how well content performs based on user engagement.
- Goal Performance: Metrics focused on progress towards strategic objectives.
- Ecommerce Metrics: Essential for tracking sales performance and understanding customer behavior.
Employing automated reporting tools like Octoboard allows marketing teams to streamline their workflows and deliver heightened value to their clients and stakeholders.
Automated Data Reports Enabled by Octoboard Software
GOOGLE ANALYTICS - SUMMARY
This section provides insights into website traffic, user demographics, referral sources, and goal attainment.
GOOGLE ANALYTICS - DEMOGRAPHICS
Data regarding user age, gender, geographical location, interests, and purchasing behaviors.
GOOGLE ANALYTICS - PERFORMANCE
Analysis of traffic origins and content metrics, including duration on the site, page views, and bounce rates.
GOOGLE ANALYTICS - OBJECTIVES
Information on the value of goals, their completions, conversion rates, and instances of abandonment.
Google Analytics (UA) metrics
Unique Visitors
This metric tracks the number of distinct users visiting the website during a specified time frame. It provides insight into audience reach and engagement levels.
Total Sessions
The total sessions metric represents the number of interactions that users initiate on a website within a specific time period. Each session can include multiple page views or actions.
User Languages
This section displays the primary languages spoken by the audience, ranked by user count. It helps in tailoring content and marketing strategies to better suit the audience's preferences.
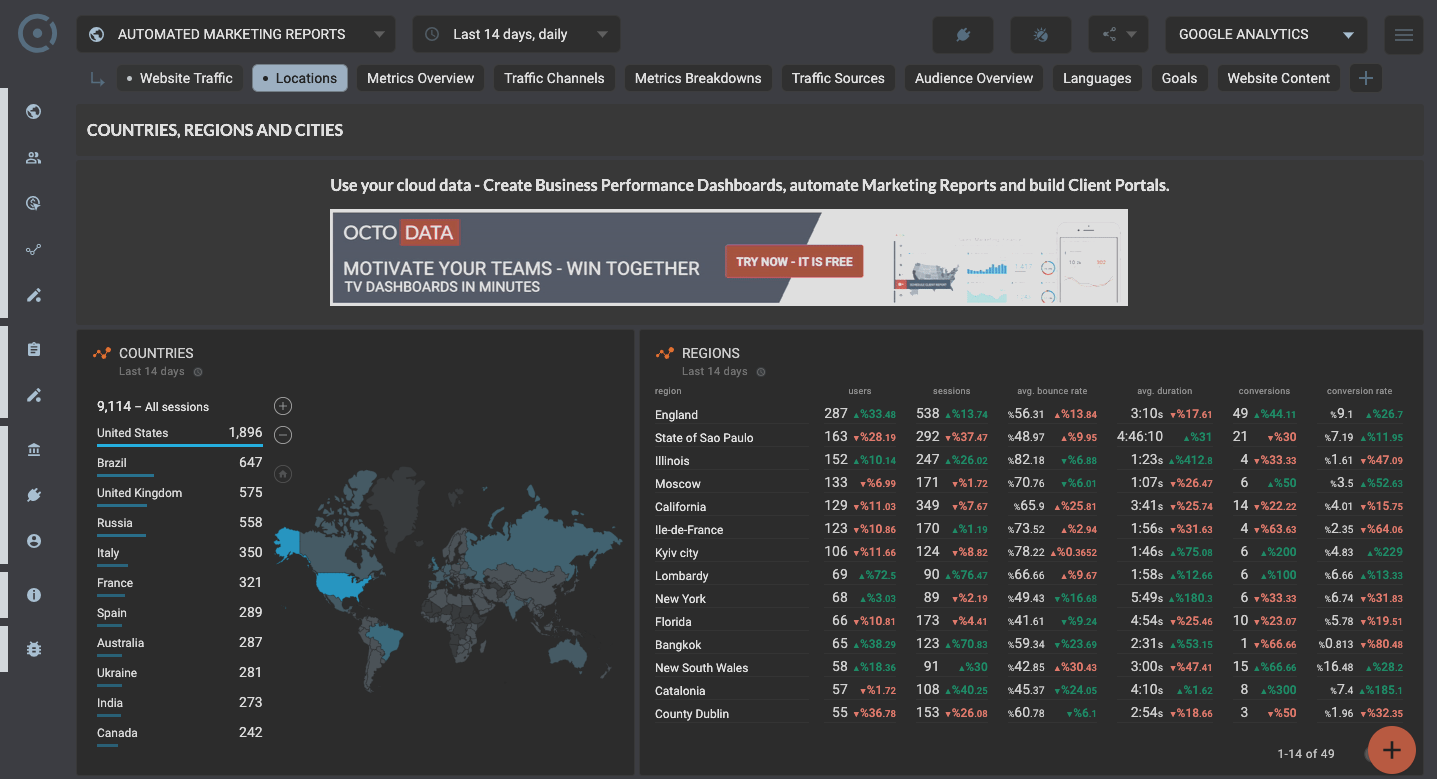
Audience Locations
A geographical representation of users is shown, ranking countries based on the number of sessions. This data assists in identifying key regions for targeted marketing.
Regional Breakdown
This metric outlines the distribution of users by region. It provides valuable insights into where the website's audience is concentrated.
City Distribution
Cities with the highest user counts are ranked in this section. It aids in localizing marketing efforts to enhance user engagement in specific urban areas.
New vs. Returning Visitors
This analysis distinguishes between new and returning users, helping to understand customer loyalty and site performance in retaining visitors.
Device Categories
Monitoring the types of devices used by visitors provides insights into user preferences and helps optimize the site for various platforms, such as mobile, tablet, and desktop.
Audience Demographics
This section covers the age and gender distribution of the audience, allowing for targeted marketing strategies based on demographic insights.
Visitor Interests
An overview of the interests of website visitors is provided, ranked by the number of sessions. Identifying these interests helps in enhancing content relevance and engagement.
Purchase Intentions
This metric ranks audience interests in various product categories based on user count, providing insights into potential sales opportunities.
Source of Traffic
Traffic sources inform where the website visitors originate from. Analyzing these sources over time can reveal effective channels to focus marketing efforts.
Referral Sources
This section ranks different referral sources by user count. Understanding which sources drive traffic can help in optimizing those channels for better performance.
Search Keywords
Keywords that result in users finding the website are listed here, ranked by the number of sessions. This data is crucial for enhancing SEO strategies.
Source Mediums
This metric identifies the various mediums through which traffic arrives at the site, ranked by user engagement, providing context for marketing decisions.
Social Media Traffic
A ranking of social networks that contribute traffic to the website. This information can guide strategies for social media marketing and engagement.
Content Performance Overview
The content overview encompasses key performance metrics such as average time on site, bounce rate, and exit rate. These figures help assess content relevance and effectiveness.
Average Time Spent
This metric measures the average duration that users spend on the website, providing insights into user engagement and the effectiveness of content.
Page Views
The total number of page views tracked over a specified period. This data reflects overall user engagement and the popularity of specific content.
Bounce Rate
The bounce rate indicates the percentage of single-page visits in which users leave the site without further interaction. Monitoring this helps to gauge content effectiveness.
Exit Rate
This metric shows the percentage of exits from the site in relation to total page views. Understanding exit rates can guide improvements to content and navigation.
Pages Ranked by Views
This section ranks website pages based on the number of unique views. It assists in identifying the most popular content that resonates with the audience.
Pages Ranked by Time
Web pages are listed based on the average time users spend on each. This data indicates which pages are engaging users effectively.
Entry Pages
The landing pages are ranked by the number of sessions. Analyzing these pages can help optimize user experience from the moment they arrive on the site.
Exit Pages
This section displays the last pages visited by users before leaving the website, allowing for assessment of content effectiveness on retention.
Website Performance
Key metrics related to website speed and overall performance are monitored to ensure optimal user experience. Site speed is crucial for maintaining user engagement.
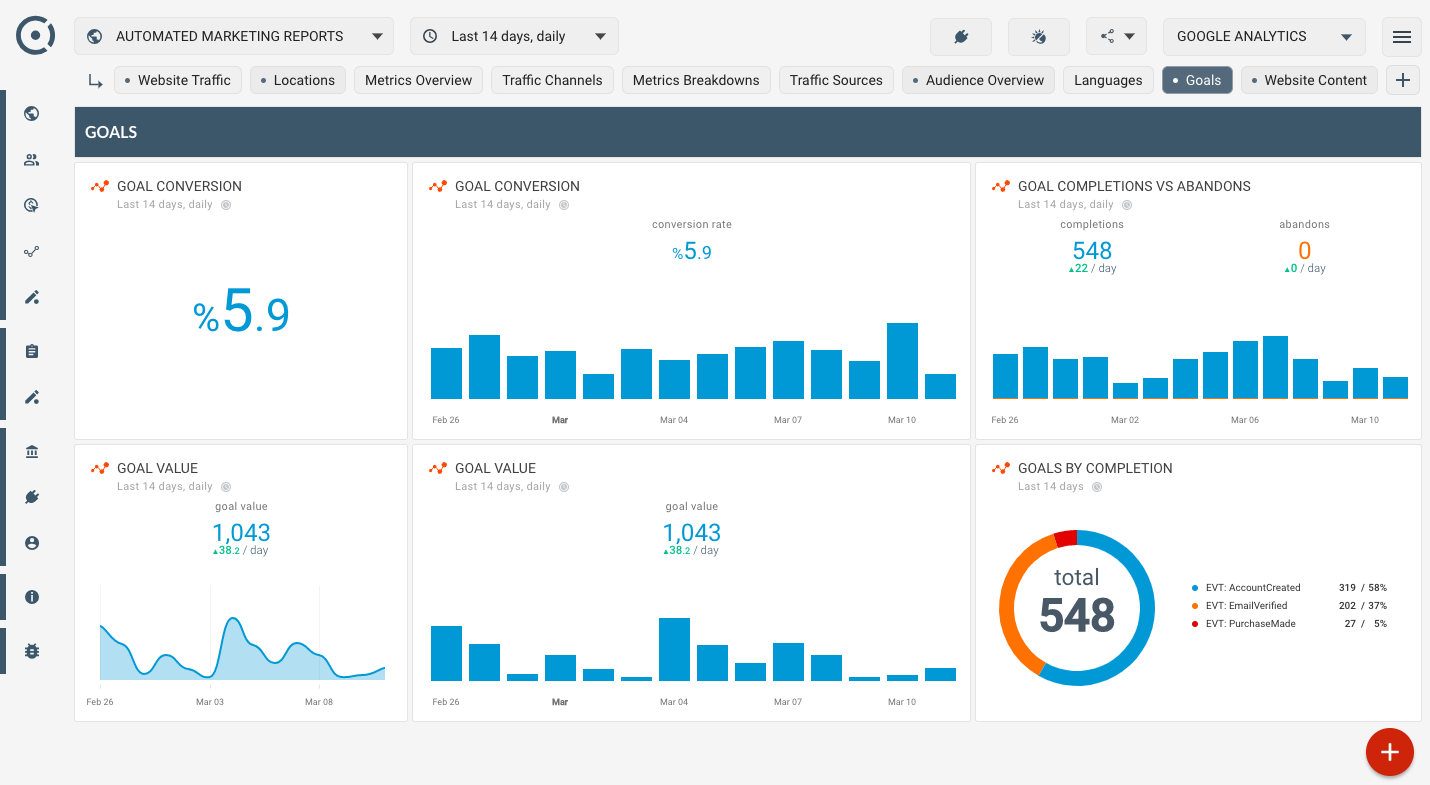
Goal Value and Conversions
This metric shows the value generated from goal completions over time for selected mediums and sources, offering insights into overall performance.
Completed Goals
The number of completed goals over time is tracked here, providing a measure of site effectiveness in achieving defined objectives.
Conversion Rate
The rate of goal completions for various mediums, sources, or goals is reported, helping evaluate marketing effectiveness.
Goal Value
Each goal's value is tracked based on selected mediums or sources, contributing to a comprehensive view of marketing performance.
Abandonment Rate
This metric measures the percentage of users who start a goal but do not complete it. Understanding abandonment helps refine user experience.
Goals Ranking
Goals are ranked by their completion rate, providing insights into which objectives are most effectively met within the site.
Goal Completion Locations
This section ranks locations by goal completions, offering insights into geographical performance related to specific objectives.
E-commerce Overview
An overview of e-commerce performance metrics, including revenue and conversion rates, is provided. Essential for businesses engaging in online sales.
Top Selling Products
The highest revenue-generating products are ranked, allowing businesses to gauge performance and customer preferences in their offerings.
Leading Campaign Performance
This section assesses the performance of marketing campaigns based on revenue, assisting in identifying effective strategies.
E-commerce Conversion Rate
Tracks the conversion rates for all or selected products, providing insights into sales efficiency and effectiveness.
Revenue Trends
Revenue generated over time for selected products is monitored, critical for financial assessments and strategic planning.
Transaction Overview
The number of transactions processed for selected products over time is reported, helping understand sales dynamics.
Revenue by Keywords
Revenue breakdown by keywords assists in evaluating the effectiveness of specific search terms in generating sales.
Revenue by Medium
This metric outlines revenue generated stemming from various marketing mediums, helping identify effective channels.
Transaction Revenue
The average revenue per e-commerce transaction is analyzed here, providing key insights into pricing strategies.
Campaign Performance Overview
An overview of Google Ads campaigns is presented, showcasing key metrics to evaluate marketing effectiveness.
Search Query Analysis
Search queries are analyzed, including metrics related to goals and conversions, revealing insights into audience behavior.
Video Campaign Performance
This section focuses on metrics related to video campaigns and their contributions to goals and conversions.
Goals by Traffic Source
Tracks the number of goals achieved segmented by traffic source, offering insights for optimizing marketing channels.
Channel Metrics
A comprehensive analysis of traffic channels reports key metrics and conversions. Understanding these dynamics can help optimize marketing efforts.
Source Mediums Analysis
A deeper look into performance statistics from various sources and mediums, including goals achieved, allows for strategic adjustments.
Traffic Overview Metrics
This includes tracking page views, total sessions, and unique users over time. Having a clear understanding of traffic patterns can guide content strategy development.
Geographic Insights
Audience insights based on geographical data are essential for targeted marketing and optimizing content to meet the needs of specific regions.
- Audience behavior
- Content quality and page analysis
- Goals and general website performance
- eCommerce
Automated data reports enabled by Octoboard software
Google Analytics - Overview
Google Analytics - Audience
Google Analytics - Content