Best automated SEO reports using Google Analytics 4 data
Create engaging SEO reports using GA4 data in Octoboard.

GOOGLE ANALYTICS 4 REPORTING
Google Analytics 4 metrics
GA4 Integration: Building automated GA4 SEO reports using Octoboard
In the rapidly evolving digital marketing landscape, leveraging insights from analytics has become paramount. Google Analytics 4 (GA4) has set new standards in understanding user interactions and website performance. This blog will delve into the powerful alliance of Octoboard and GA4, simplifying SEO reporting for marketing professionals.
Unveiling the Power of Google Analytics 4 (GA4) Metrics
The fundamental purpose of any analytics tool is to provide actionable insights that drive business decisions. Here are some of the prominent metrics offered by GA4:
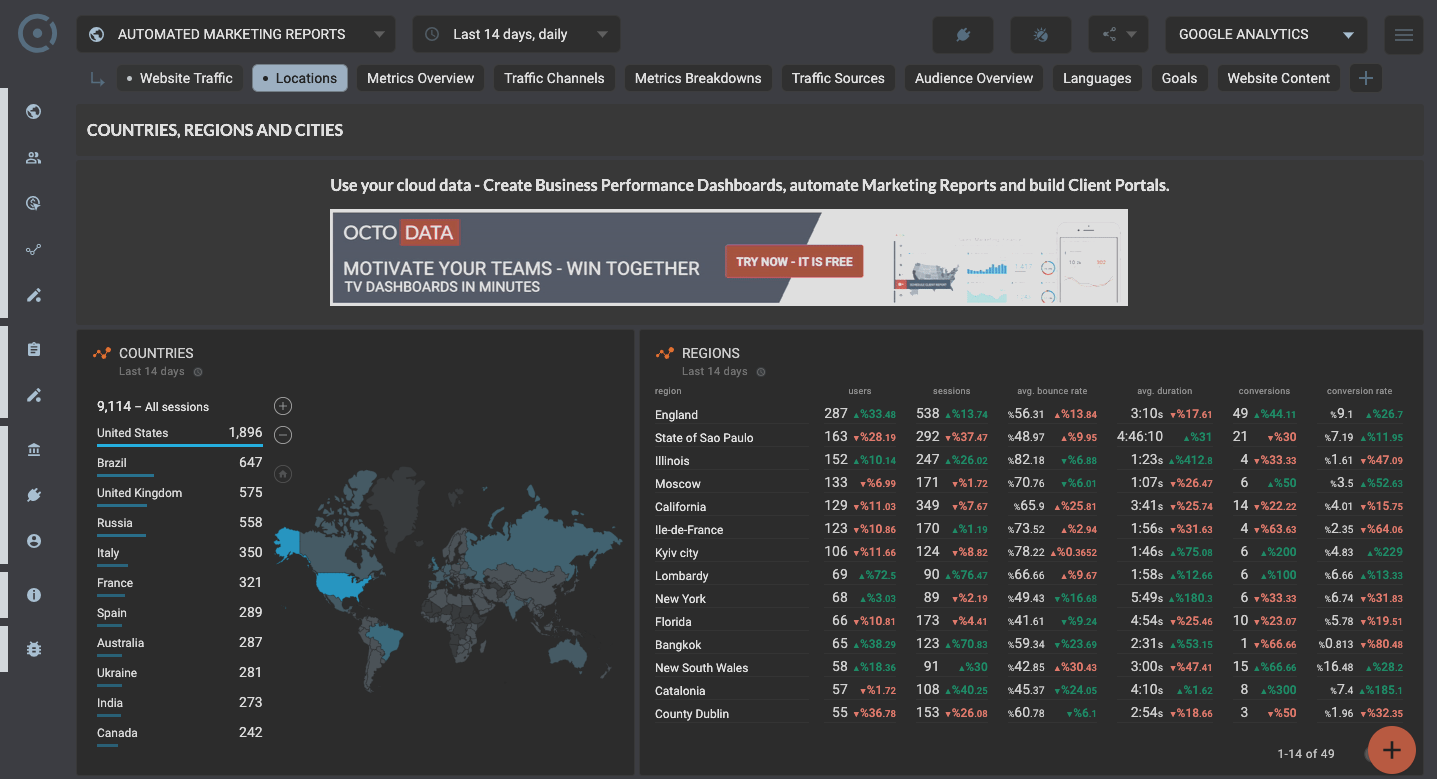
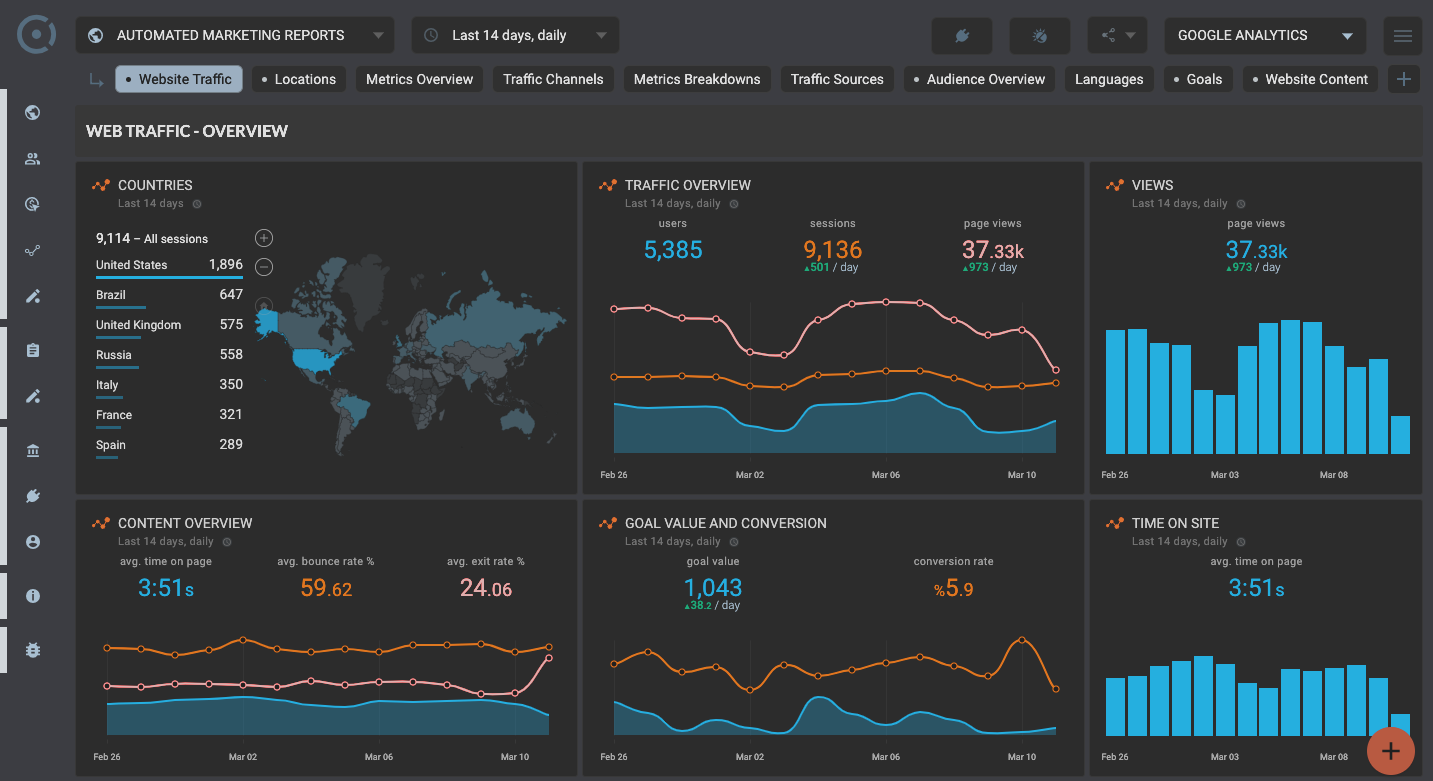
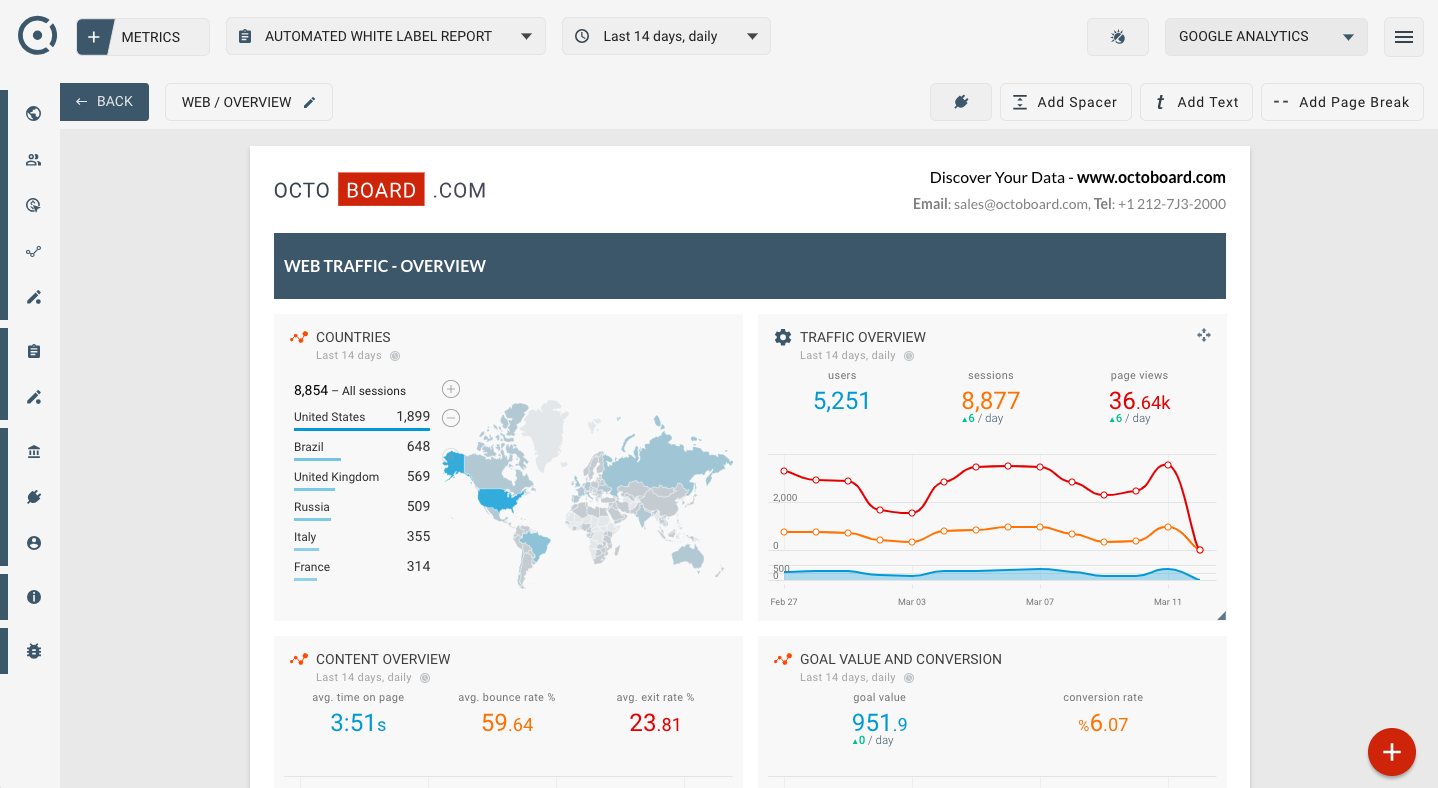
- Google Analytics - Countries: Revealing from which geographical areas the traffic is originating, enabling businesses to target their campaigns effectively.
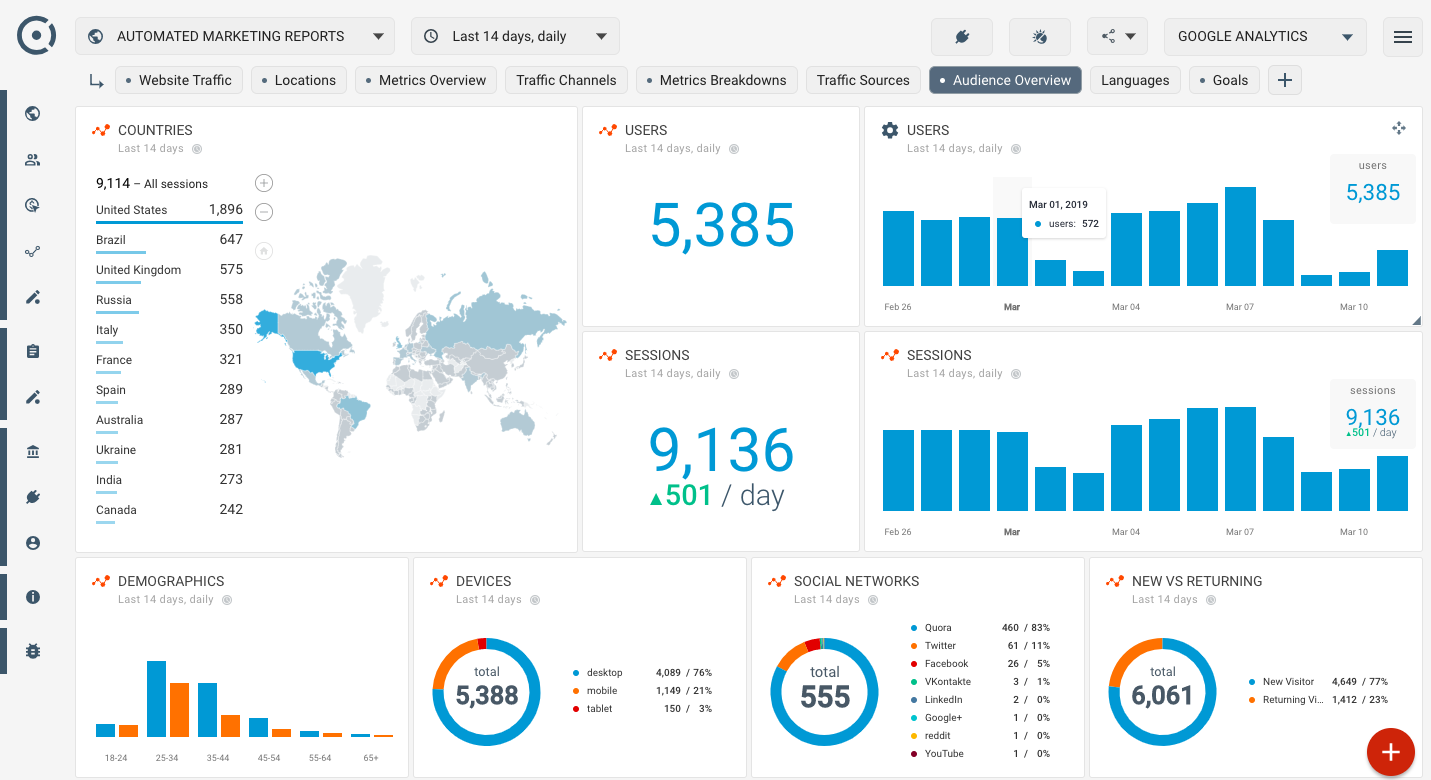
- Google Analytics - Audience Overview: Understanding the nature of the audience in terms of behavior, interests, and demographics.
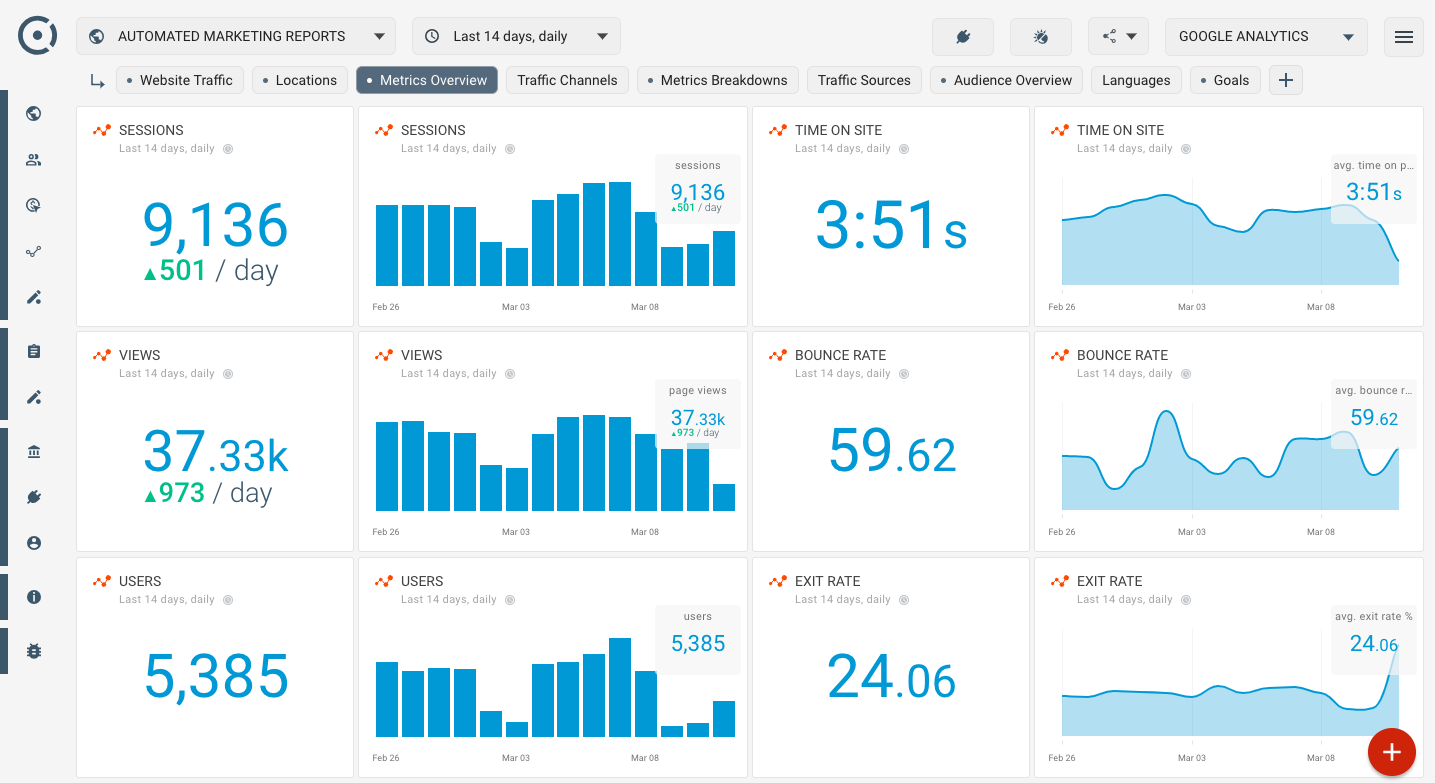
- Google Analytics - Pageviews: A measure of the popularity of the site's content.
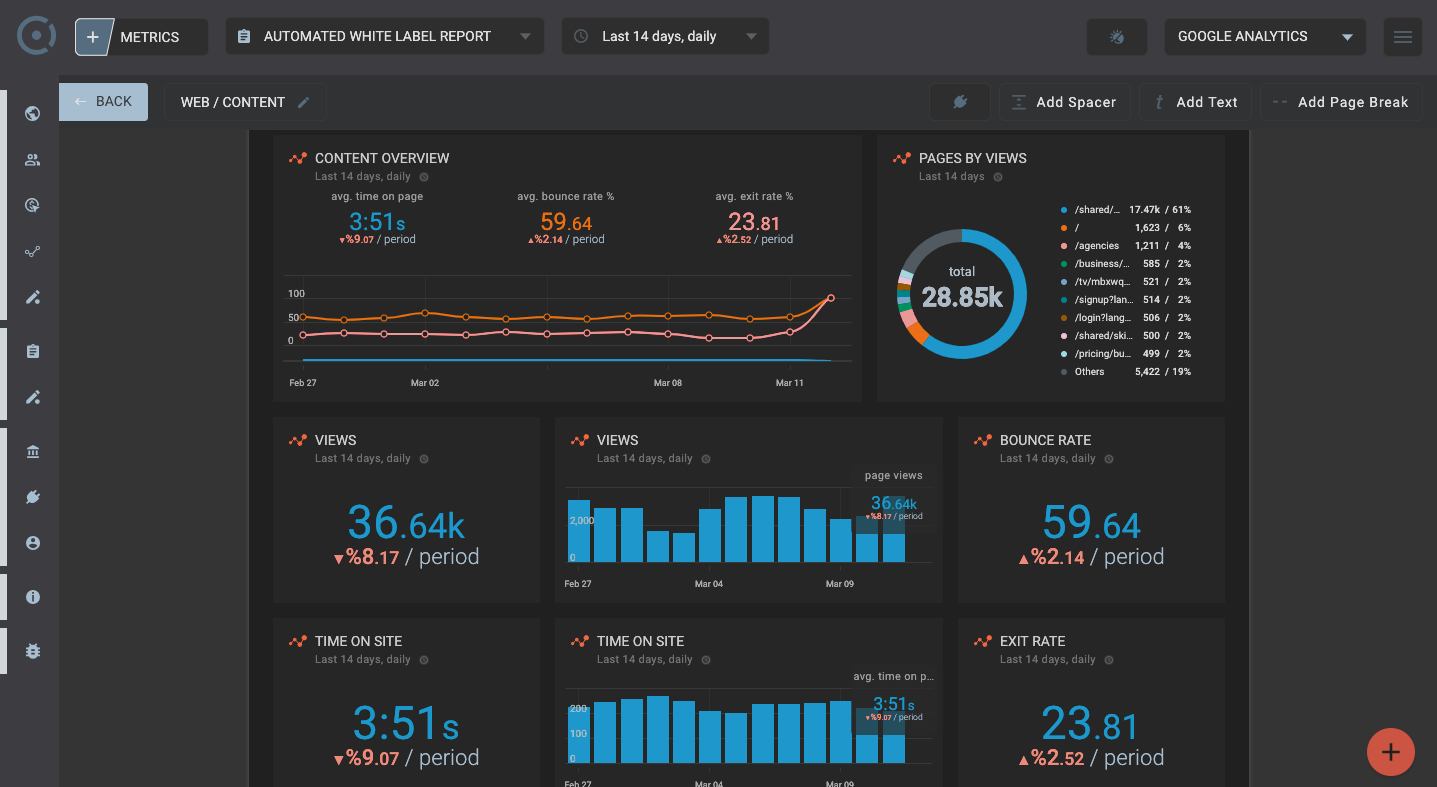
- Google Analytics - Content Overview: Identifying which parts of the site are engaging the visitors the most.
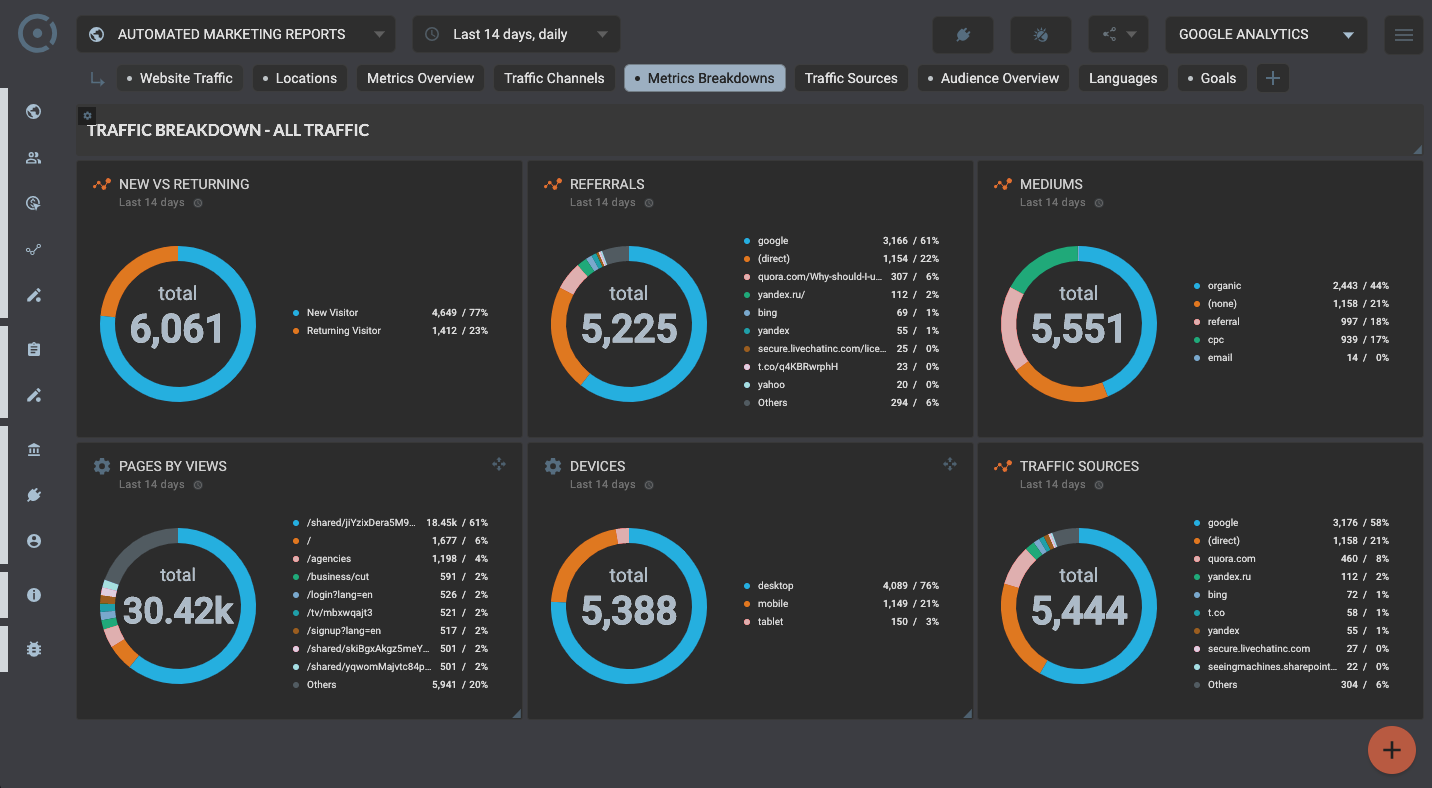
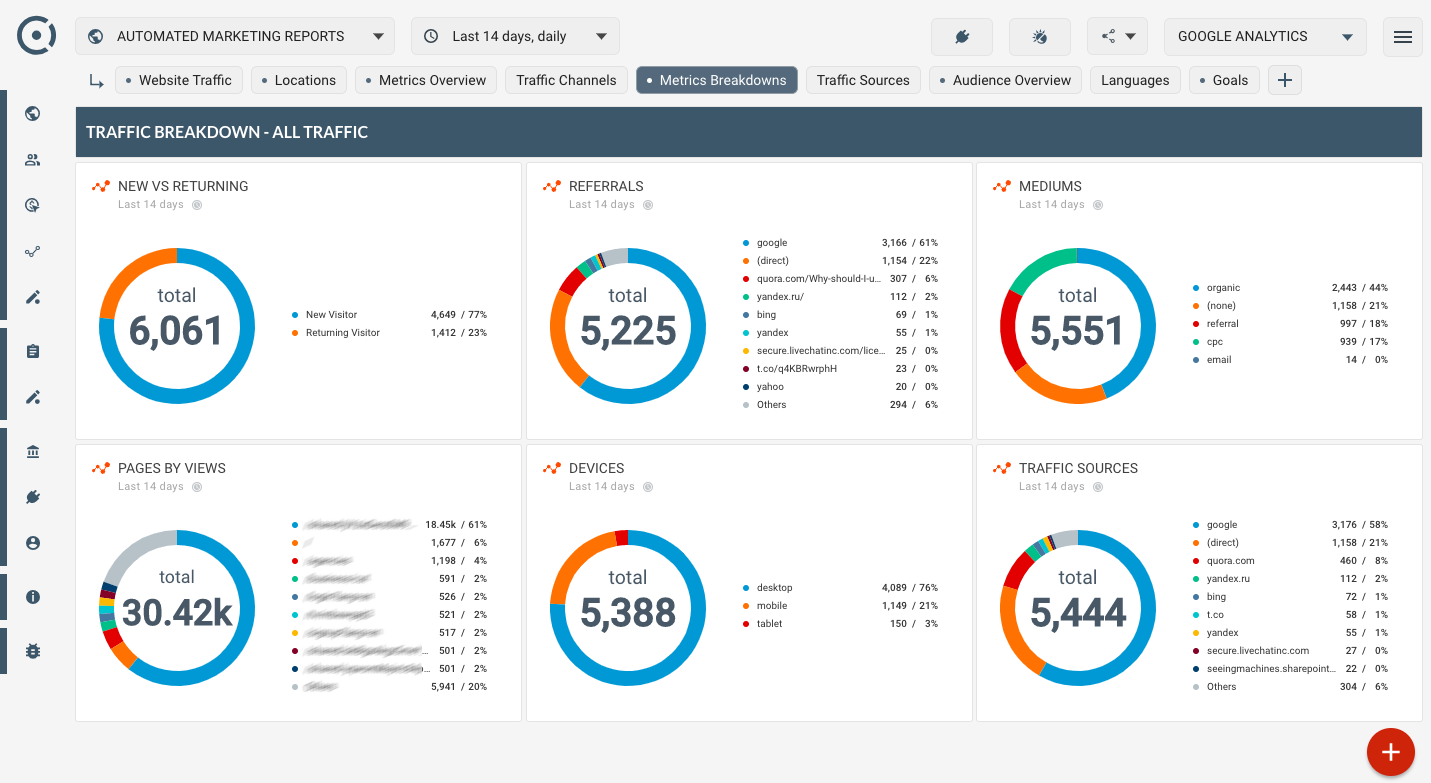
- Google Analytics - Mediums: Recognizing the sources that are driving the most traffic.
- Google Analytics - Average Time on Site: Gauging the engagement level of visitors.
- Google Analytics - Referrals: Pinpointing the third-party sites directing traffic.
- Google Analytics - Social Networks: Tracking the influence of social media on website performance.
- Google Analytics - Devices: Understanding whether users access the site from mobile devices, desktops, or tablets.
Streamlining SEO Reporting with Octoboard
While GA4 offers in-depth insights, sifting through them can be daunting. This is where Octoboard’s Marketing Analytics platform comes into play. By leveraging the cloud data API of GA4, it allows marketers to generate automated SEO reports swiftly. Not only does it save hundreds of hours but also ensures accuracy and comprehensiveness in the reports.
The Importance of Automated Reporting
Automating GA4 reports can dramatically transform the way businesses operate:
- Regular Updates: Sending out these automated reports monthly or weekly ensures that all stakeholders, from team members to top management, remain updated.
- Enhanced Visibility: With these regular updates, there is increased visibility into the effectiveness of advertising and SEO efforts.
- Decision Making: Automated reports provide a foundation for informed business decisions, be it in reallocating budgets or tweaking marketing strategies.
Unified SEO Reporting: The Octoboard Advantage
In the digital world, putting all your eggs in one basket is never a wise strategy. Multiple SEO channels—from organic search to paid advertising, from social media to referrals—need continuous monitoring. Octoboard Analytics platform proves to be a linchpin here. It consolidates data from various SEO channels, offering a holistic view, which is invaluable in strategizing and optimizing campaigns.
Unlocking Advanced Analytics with Octoboard
For marketing agencies that aim to take their analytics game a notch higher, Octoboard’s advanced PPC Analytics module is the perfect tool. By facilitating the creation of new metrics and dimensions and employing advanced formulas, it allows a more nuanced analysis. Especially when reporting across different PPC channels, locations, and currencies, such capabilities can make a marked difference. Dive deeper and explore more about this feature here.
Automated Data Insights: Staying Ahead in the Game
In a competitive market, merely gathering data isn't enough. Detecting trends, analyzing patterns, and predicting future behaviors are vital. With Octoboard’s capability to monitor data trends and generate insights using GA4 data, marketing agencies can stay ahead. Using the power of OpenAI, it ensures that teams are on the right track, making the most out of their marketing initiatives. For a more detailed understanding, visit this link.
Seamless Integration with Google Sheets
For teams that prefer working with Google Sheets, Octoboard offers an impeccable solution. Its Google Sheets data export feature lets marketing teams effortlessly send GA4 data to Google Sheets. This seamless integration aids in easy viewing, sharing, and further analysis of data. Check out this beneficial feature here.
In essence, the combined might of GA4 and Octoboard is revolutionizing SEO reporting, enabling businesses to harness insights and turn them into actionable strategies. With automation, advanced analytics, and seamless integrations at their disposal, marketing professionals are better equipped than ever to drive success.
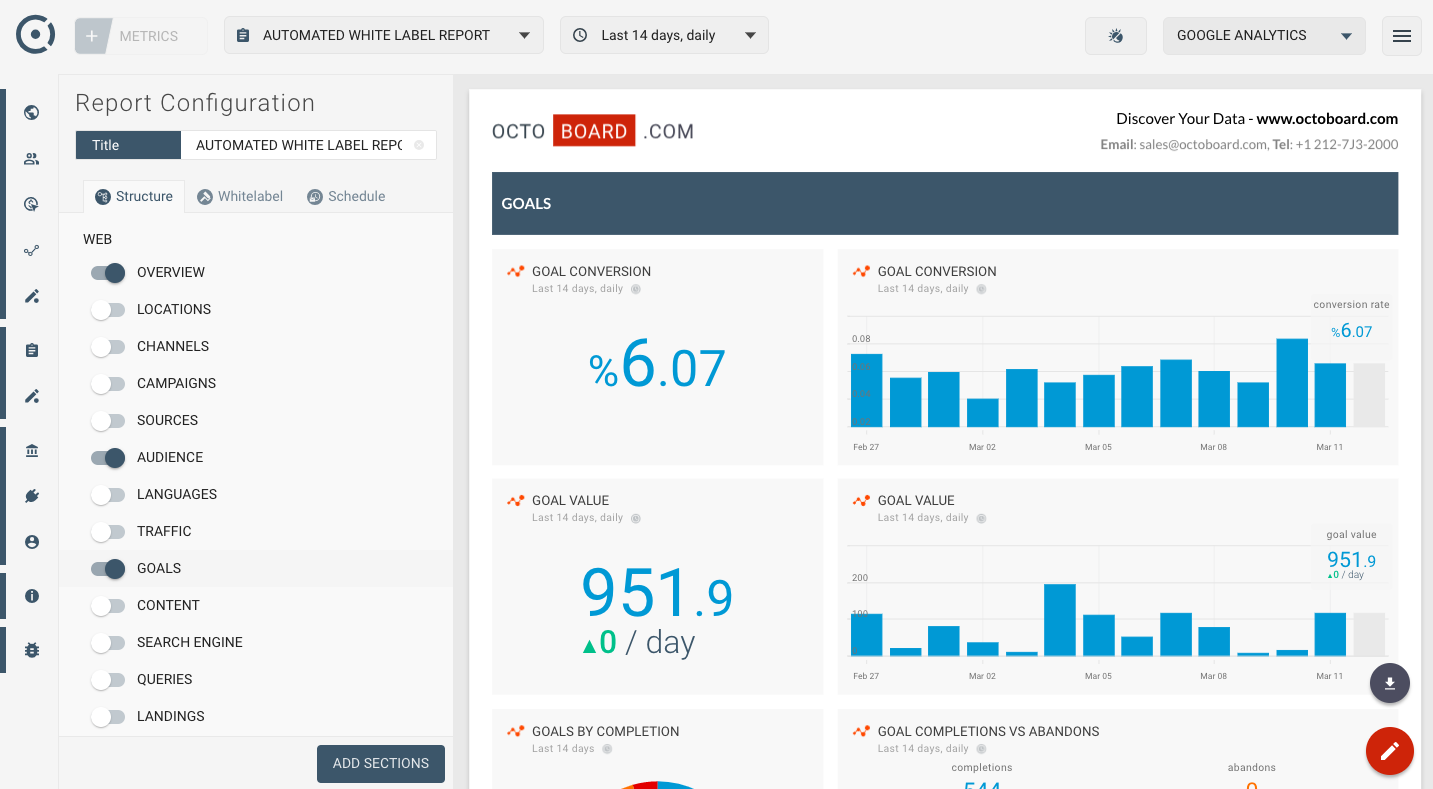
Automated data reports enabled by Octoboard software
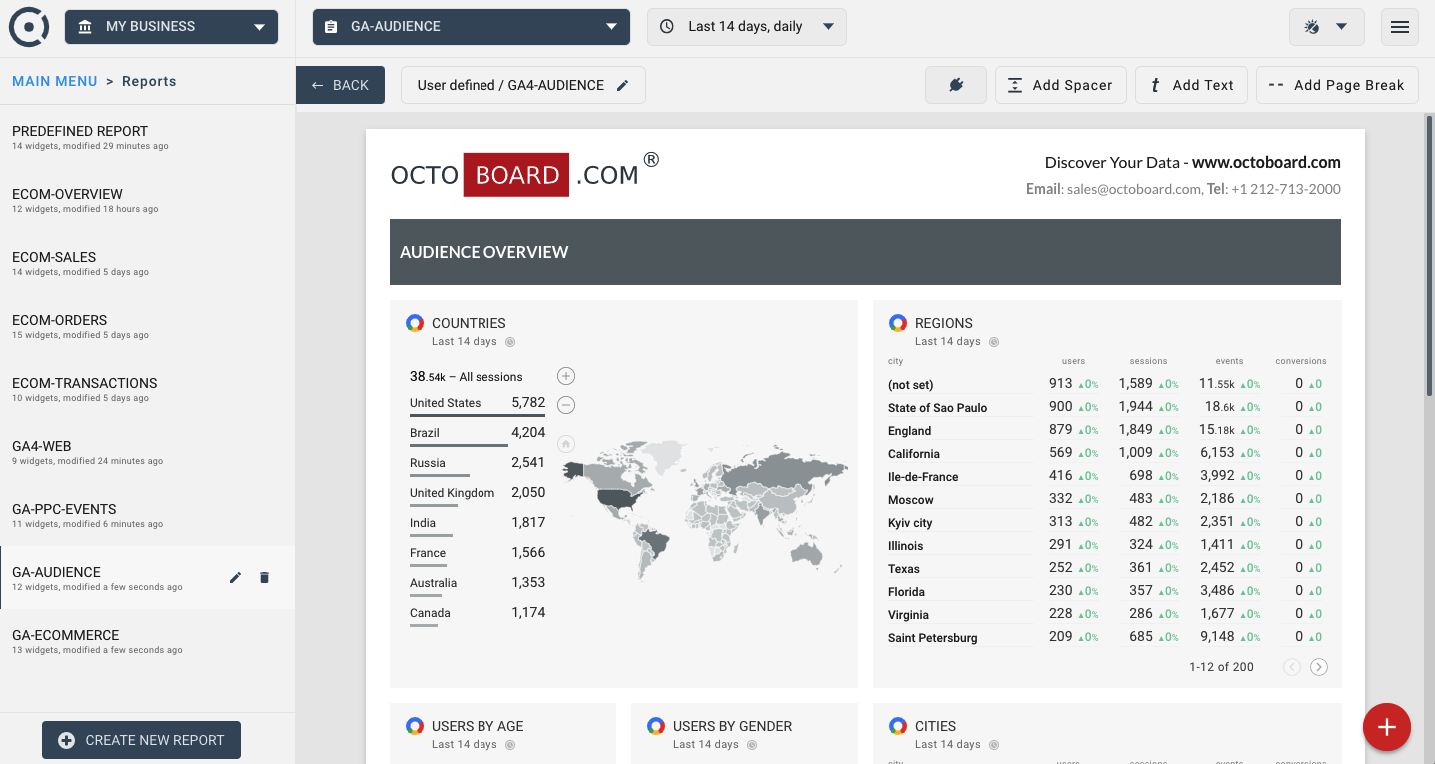
Google Analytics SEO dashboard - Audience
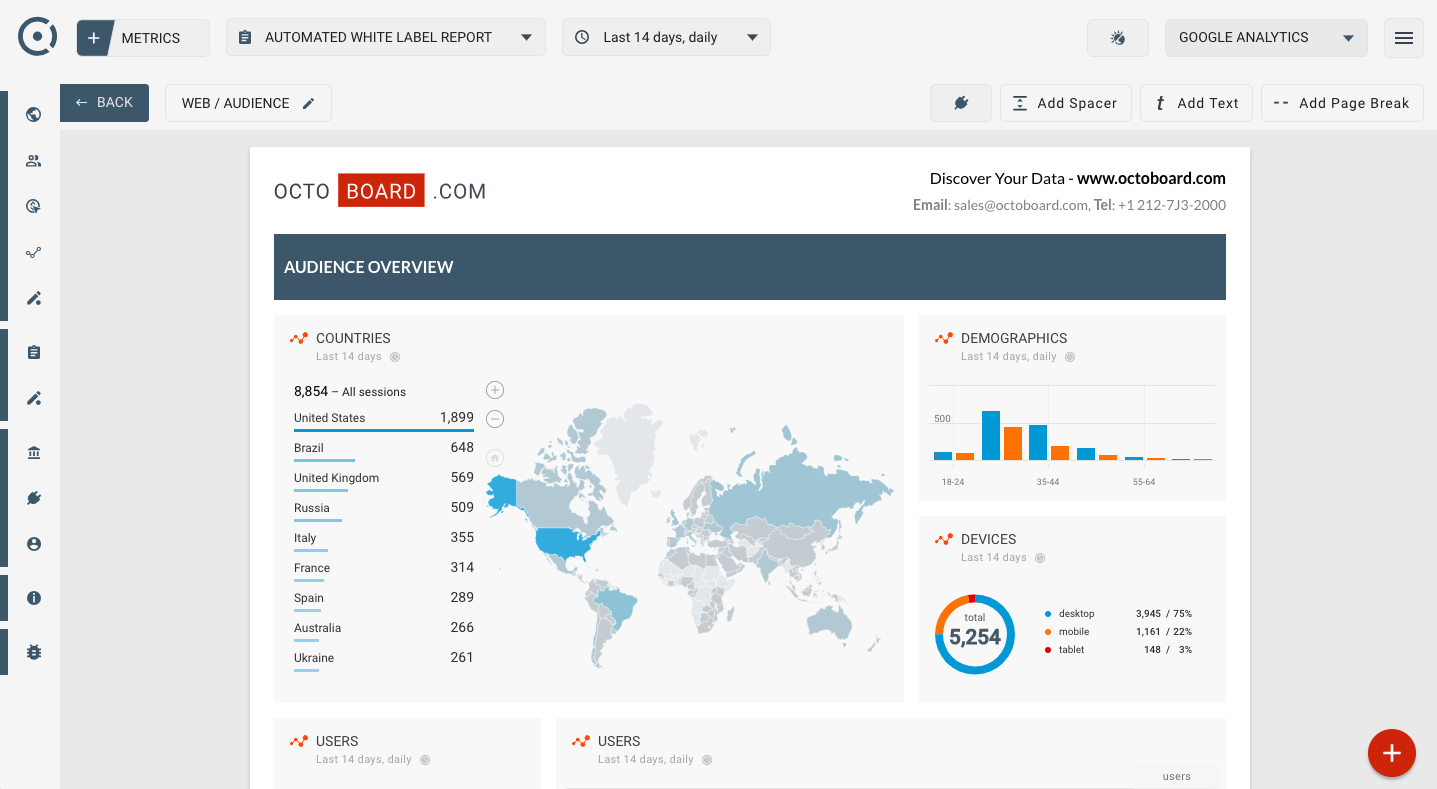
Google Analytics SEO template - Audience (Report)
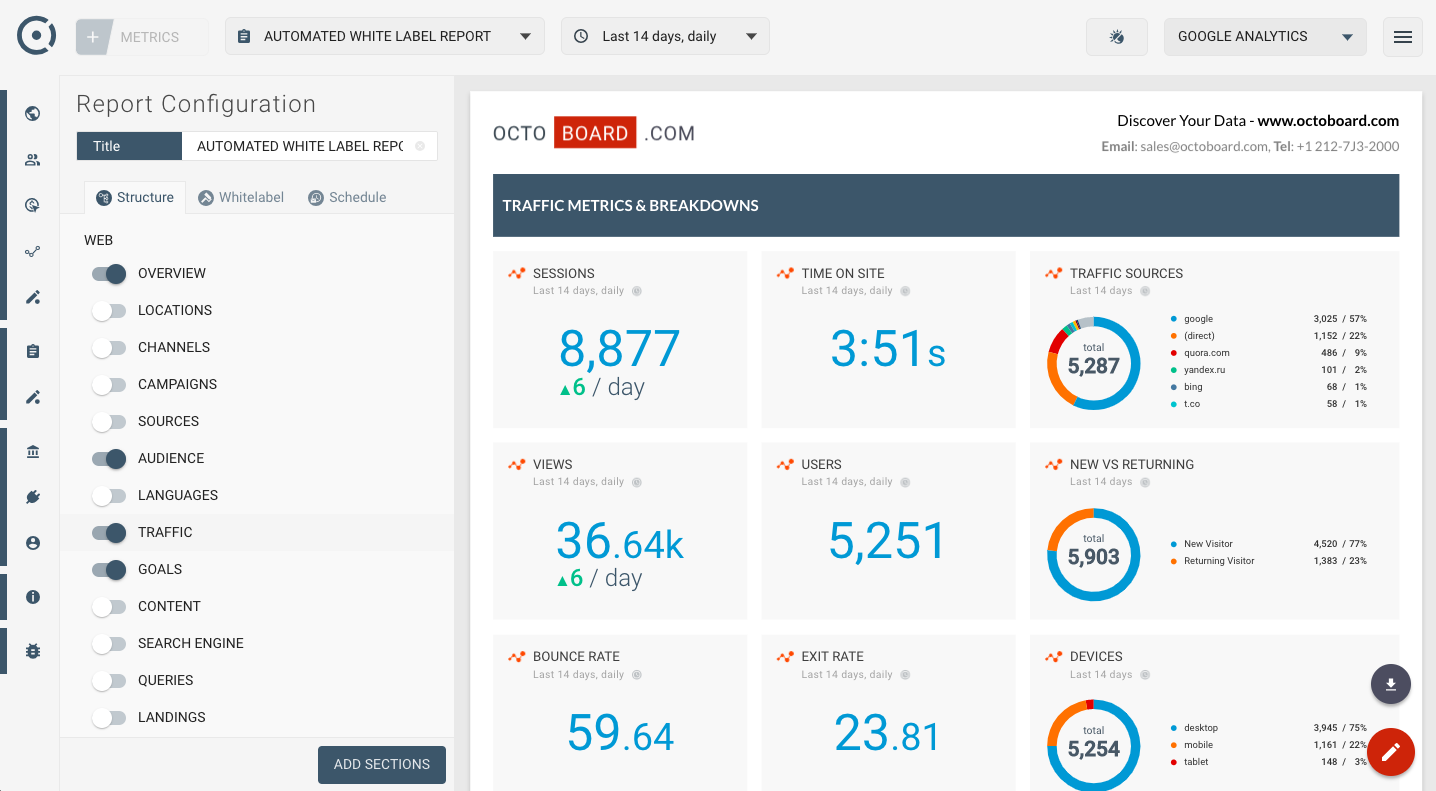
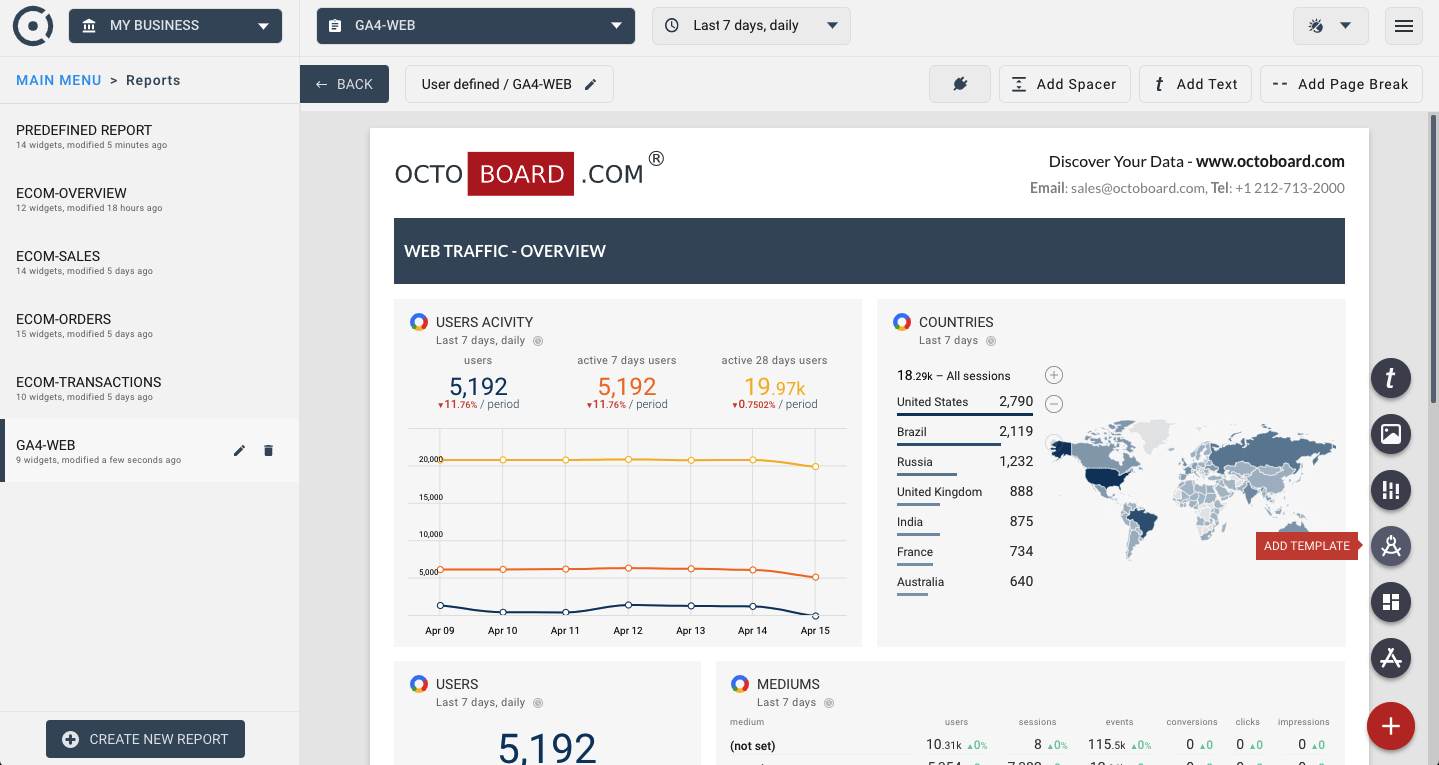
Google Analytics SEO template - Traffic
Google Analytics SEO template - All Traffic (Report)
Google Analytics All Metrics
Google Analytics SEO dashboard - All Traffic
Google Analytics SEO - Audience Traffic
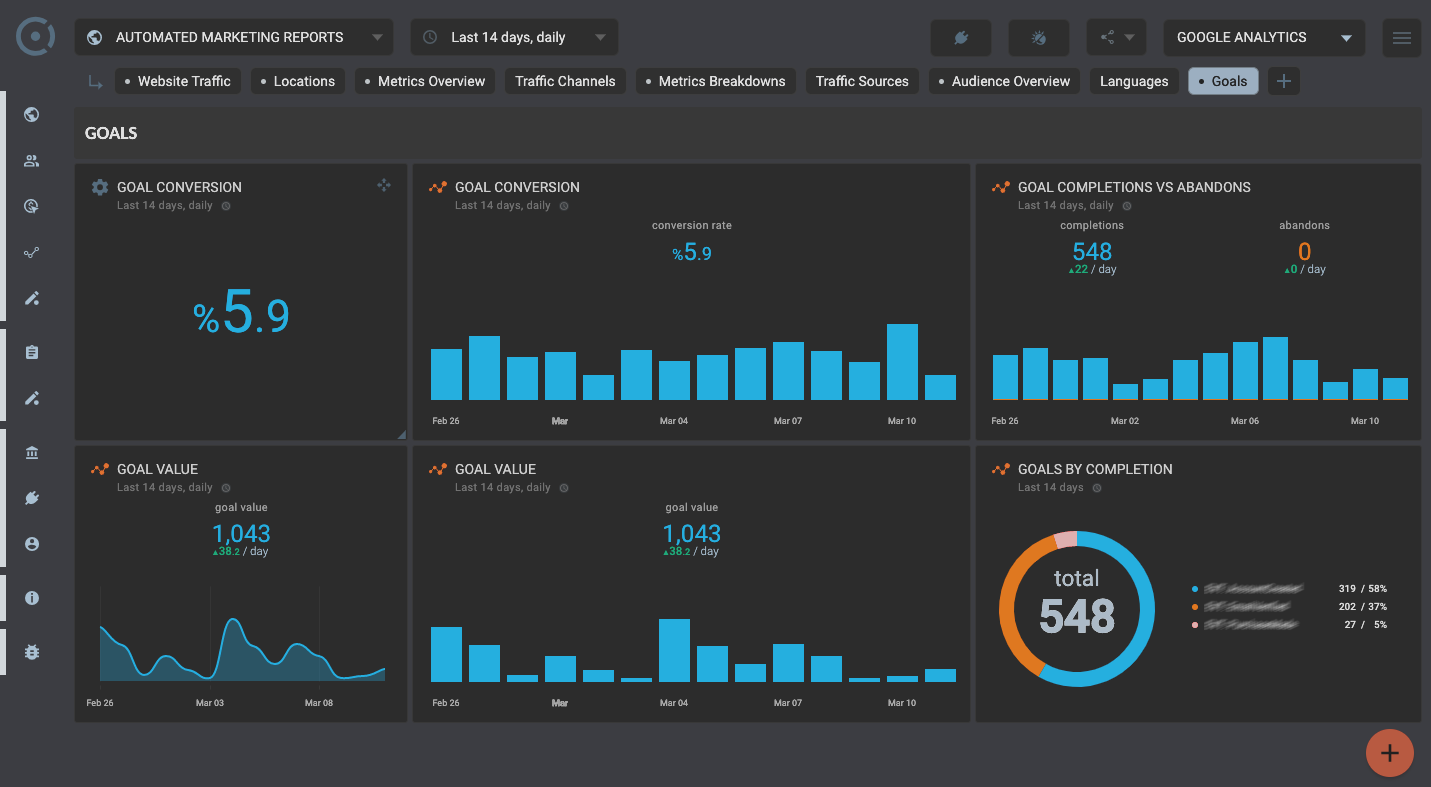
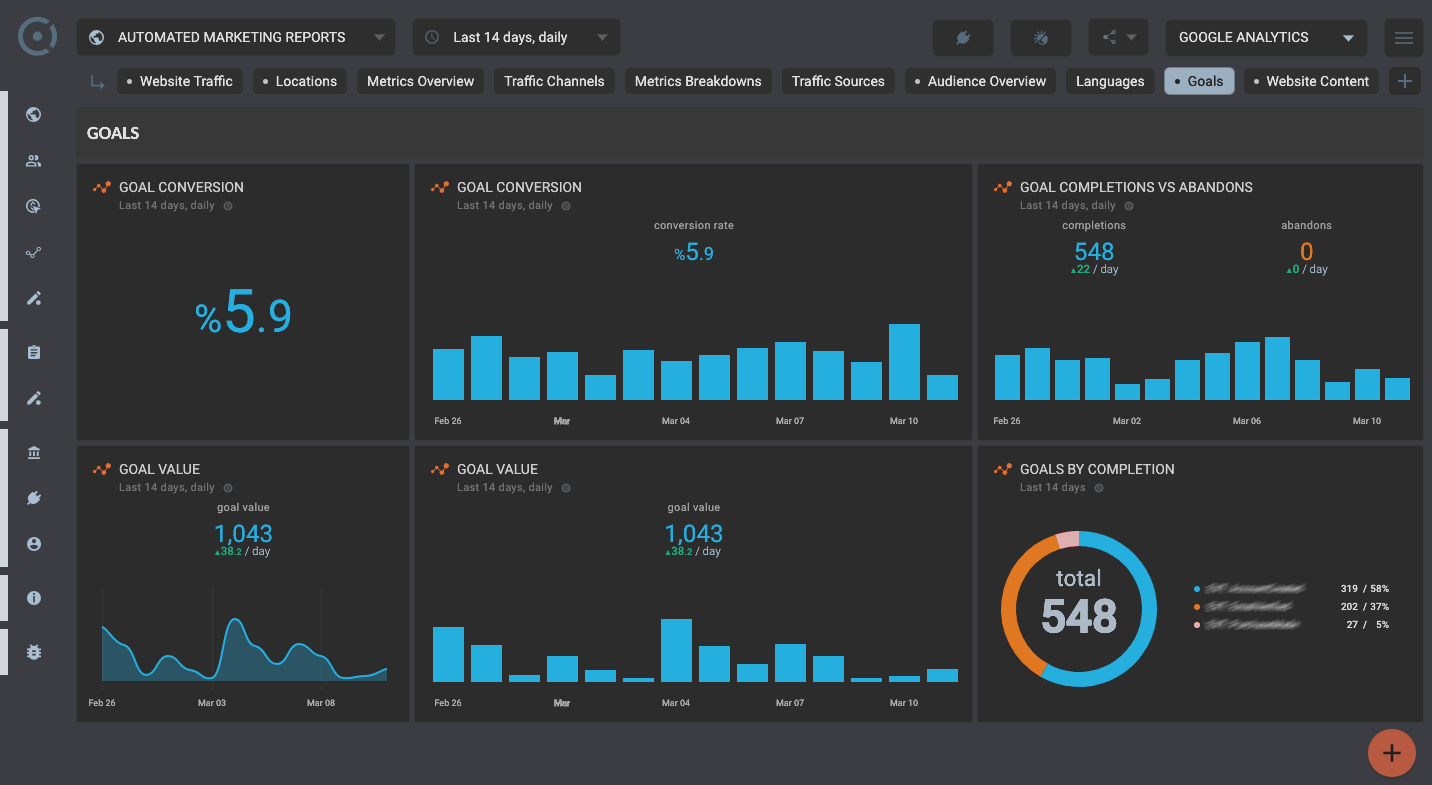
Google Analytics SEO dashboard - Goals
Google Analytics SEO template - Goals (Report)
Google Analytics Metrics SEO dashboard
Google Analytics SEO template (Report)
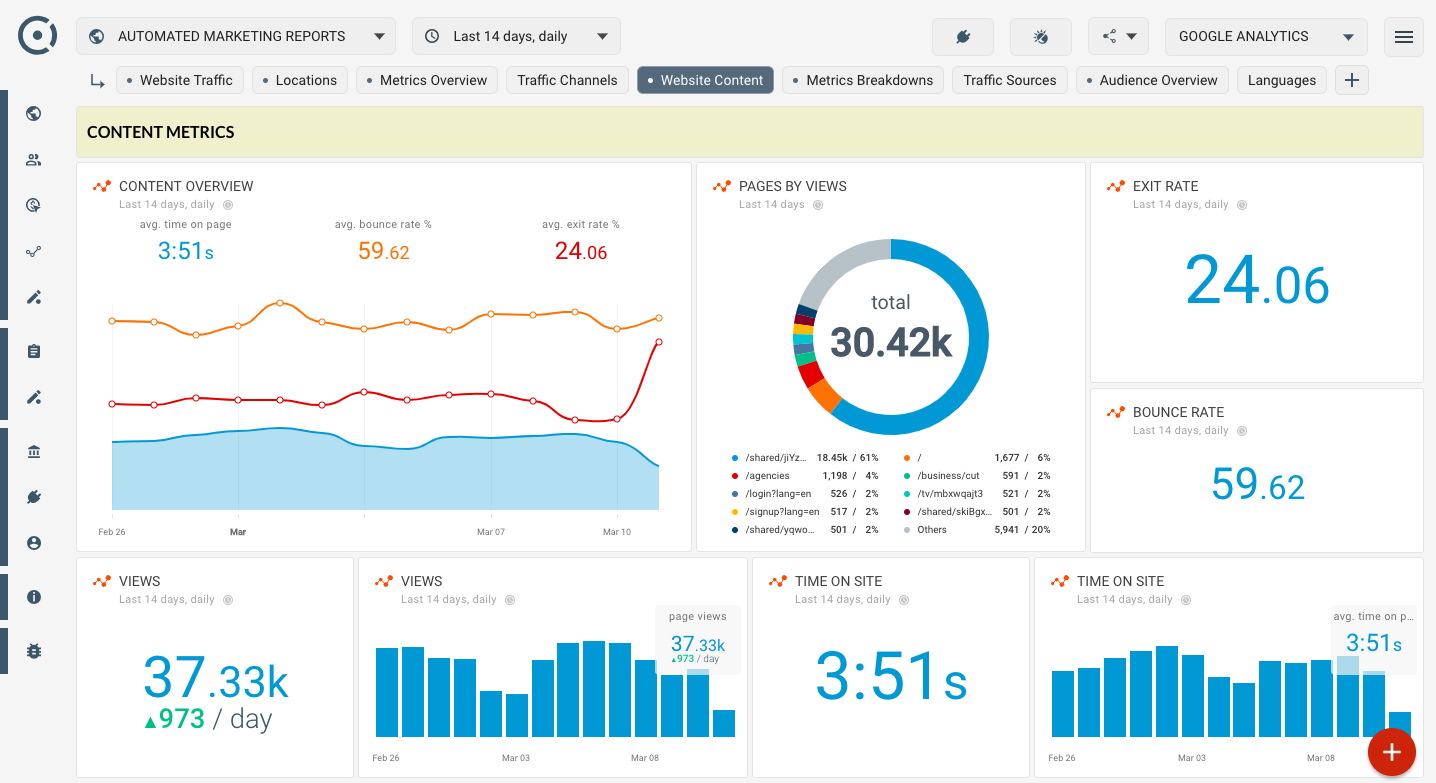
Google Analytics Content Overview
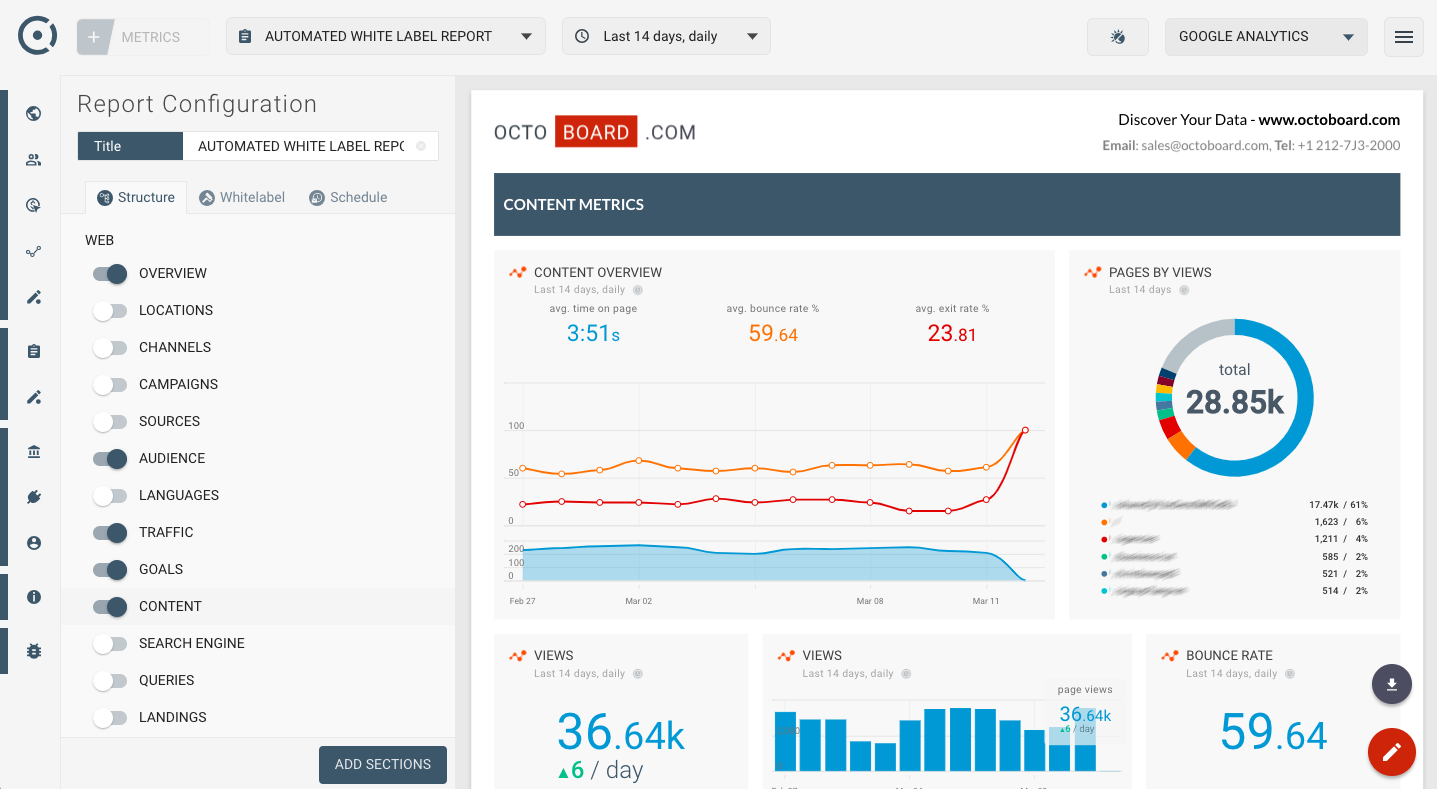
Google Analytics Content Overview (Report)
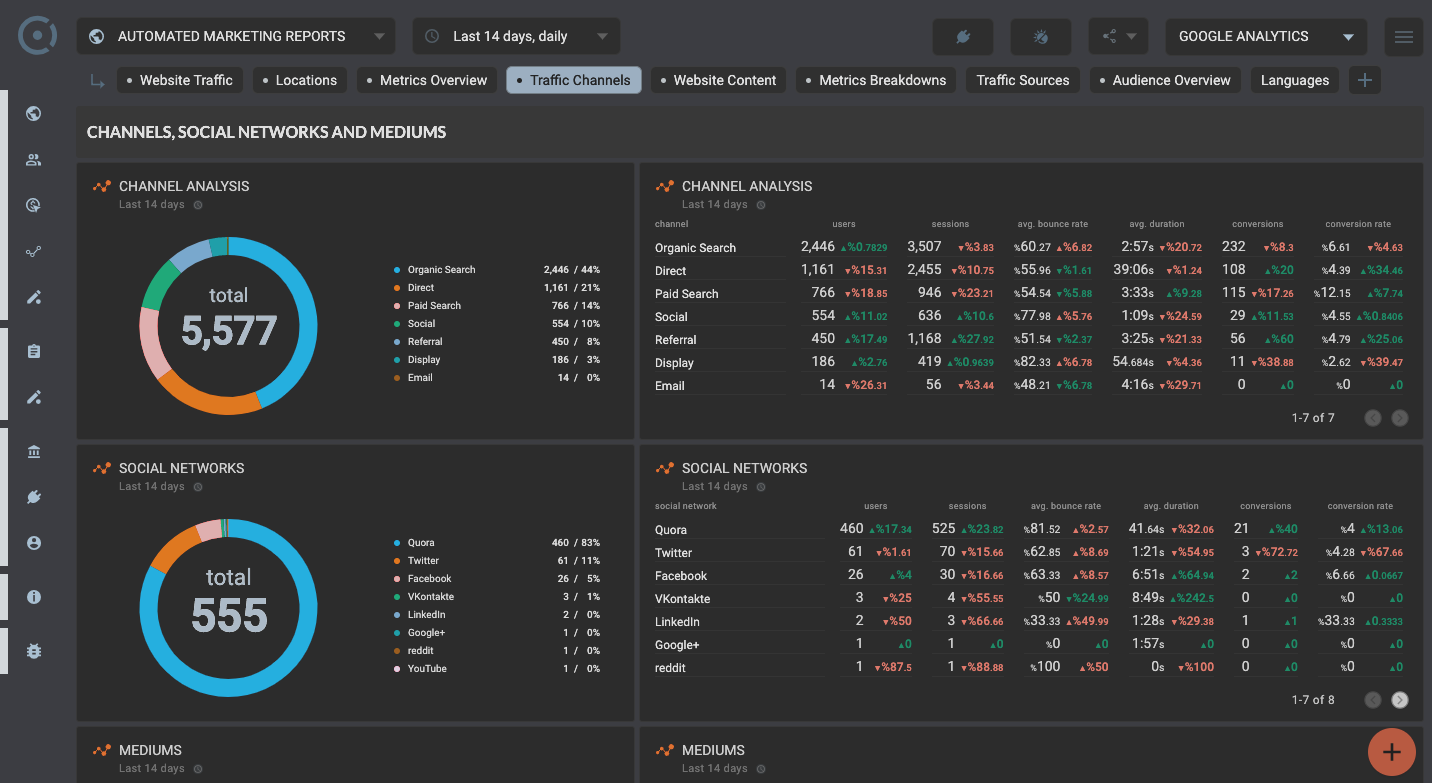
Google Analytics Channels Overview
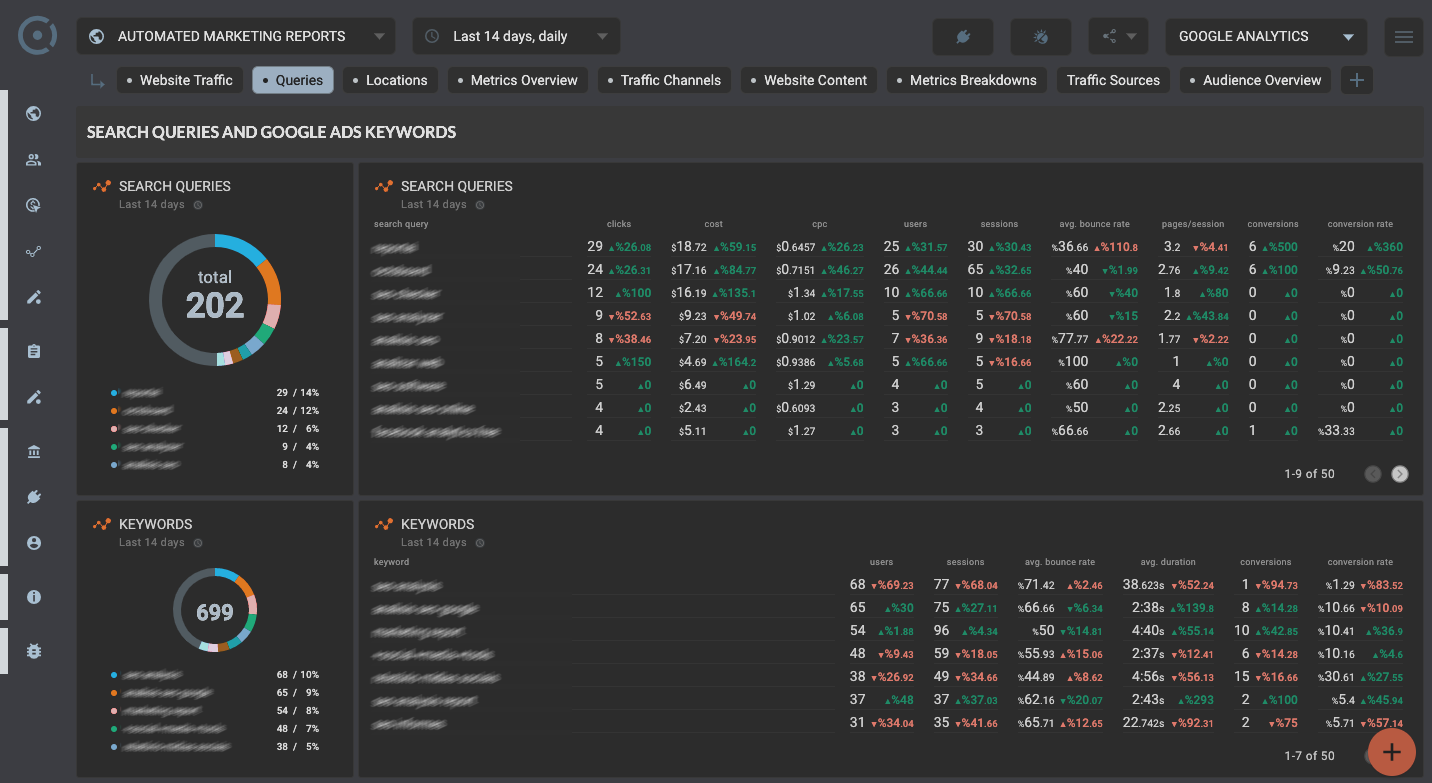
Google Analytics Queries and Keywords
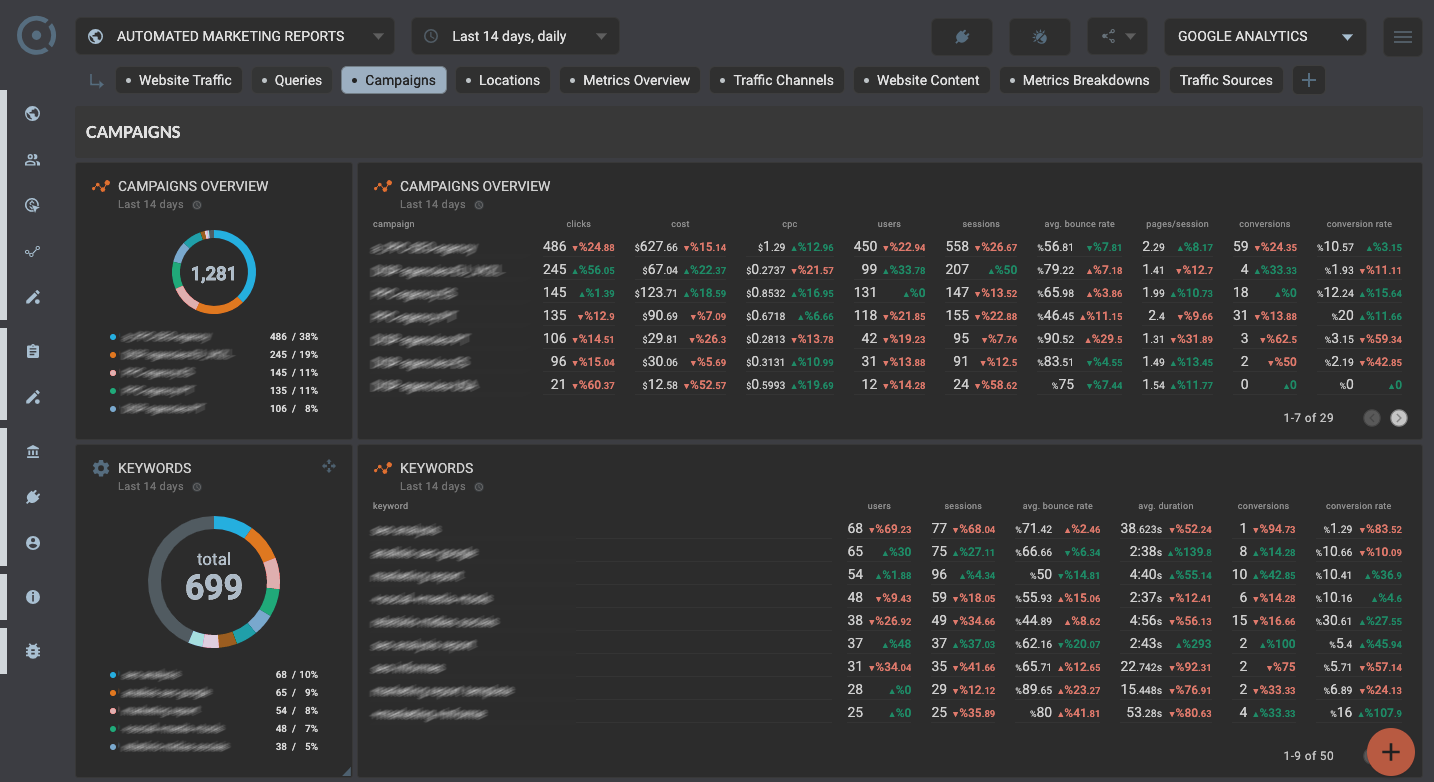
Google Analytics Campaigns details

Google Analytics Sources and Referrals
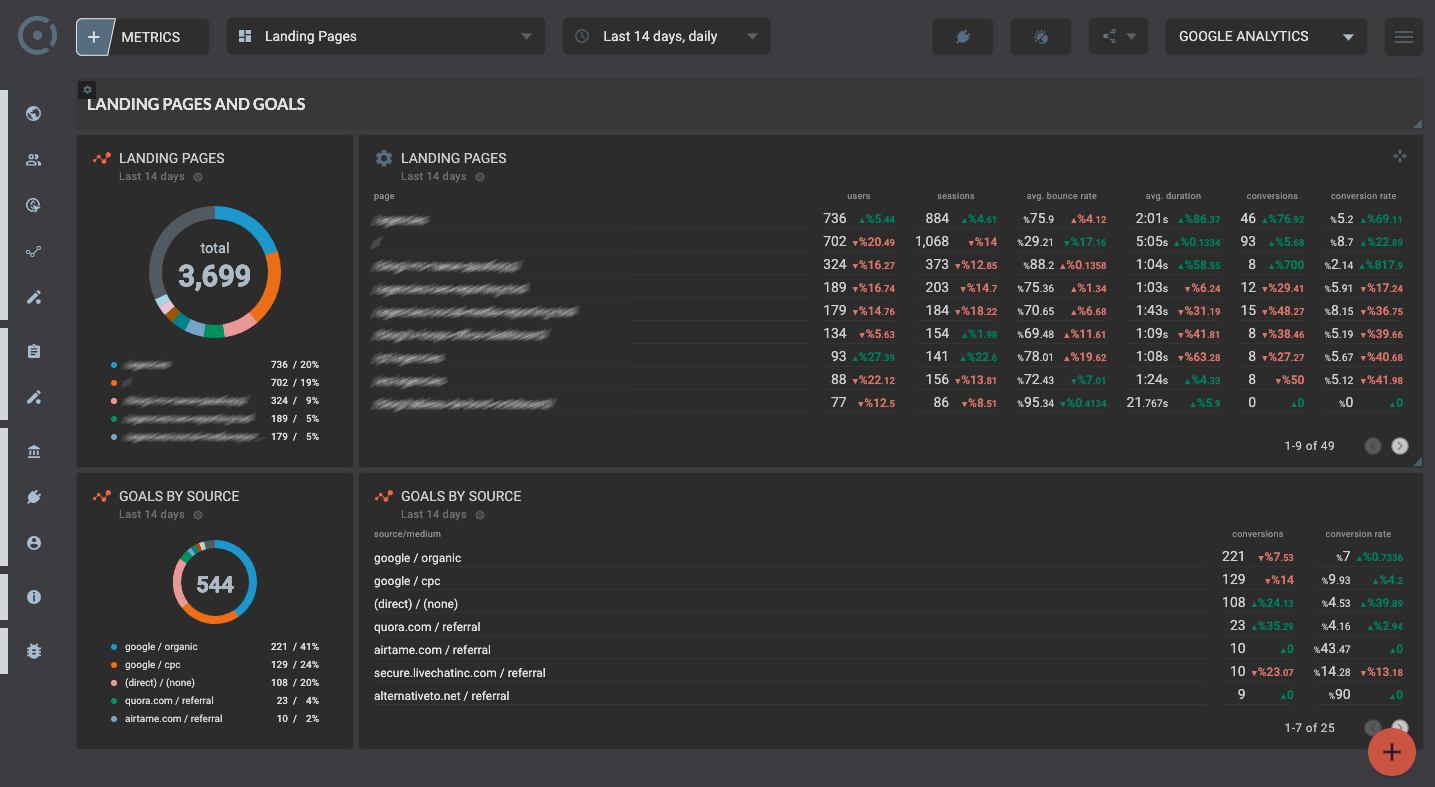
Google Analytics Landing Pages

Google Analytics Location details
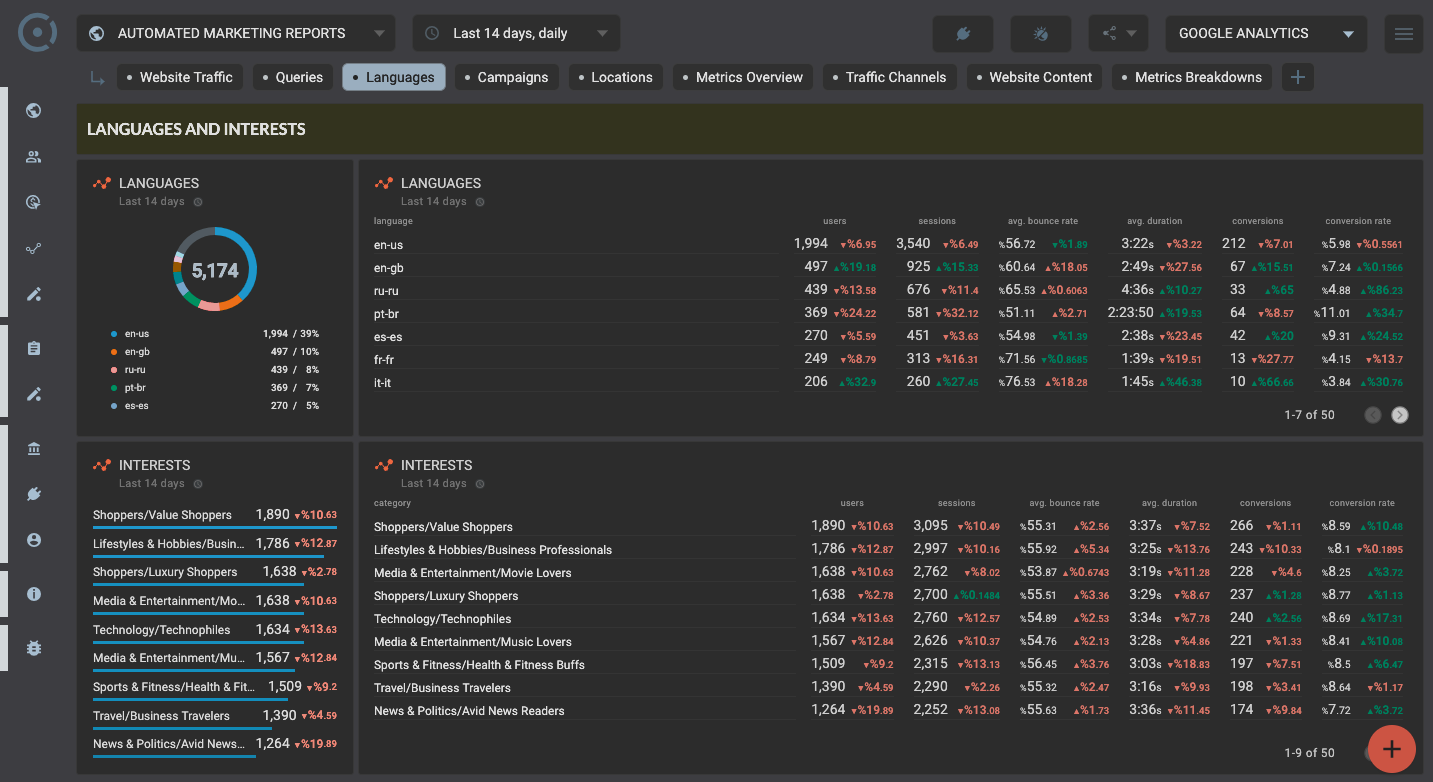
Google Analytics Languages and Interests
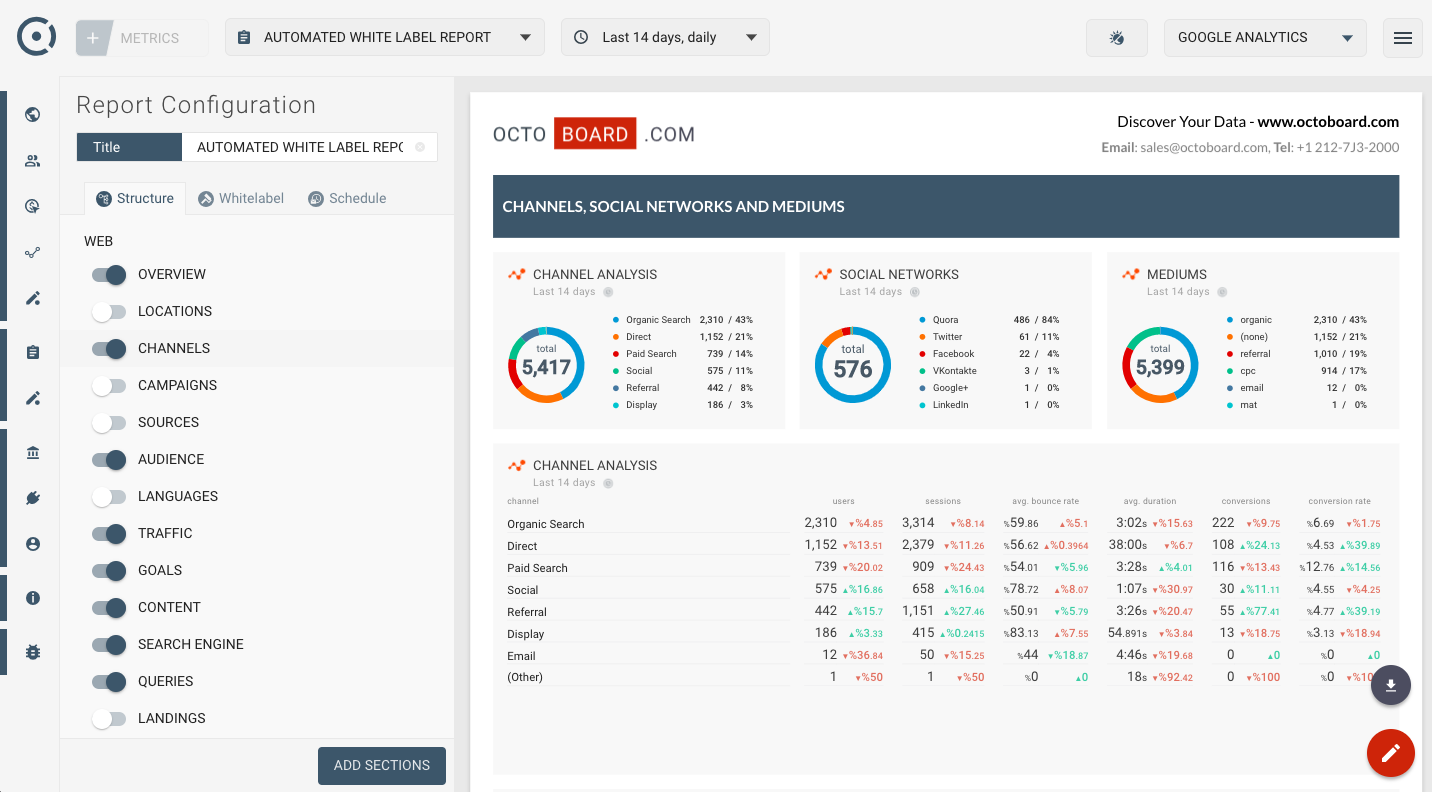
Google Analytics Channels Overview (report)
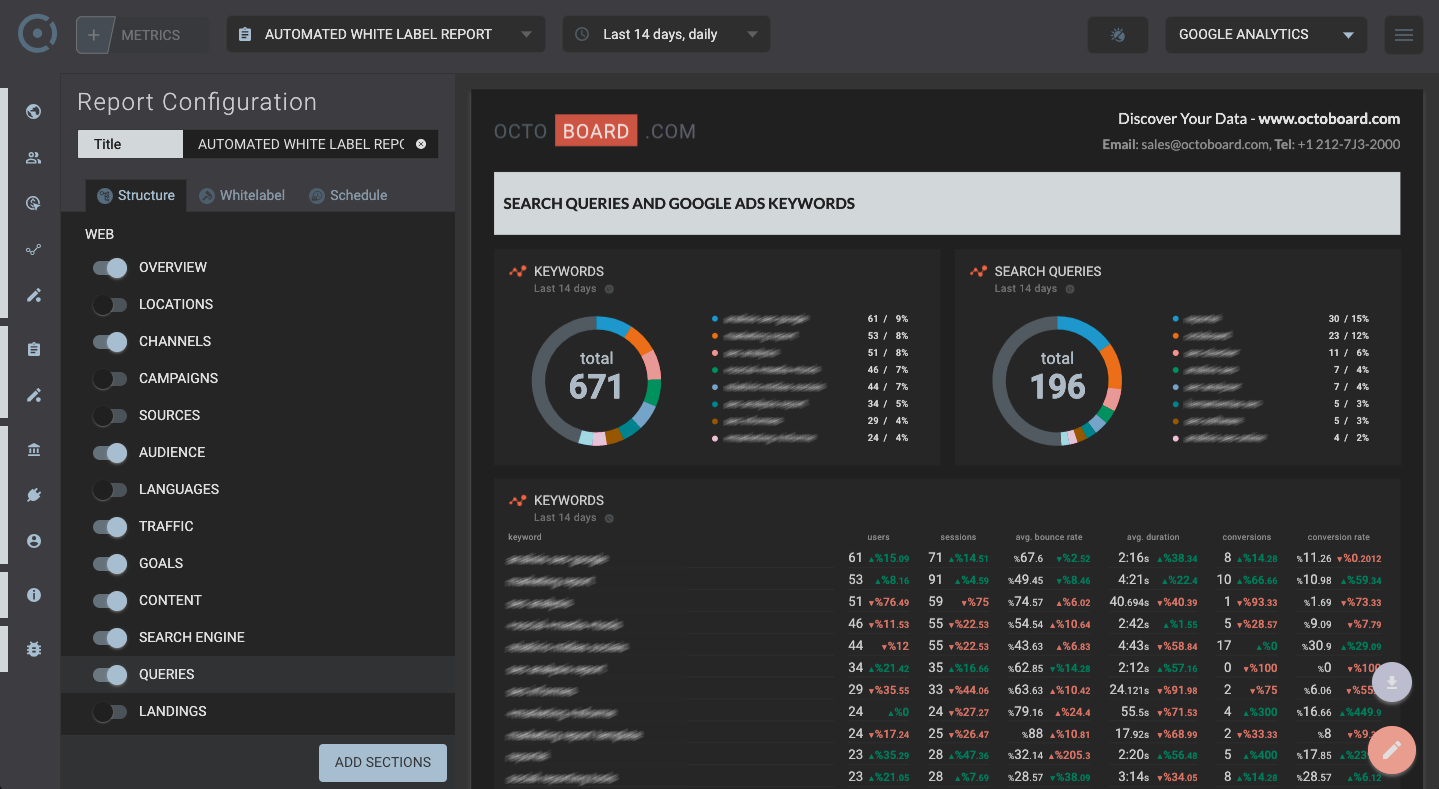
Google Analytics Queries and Keywords (report)
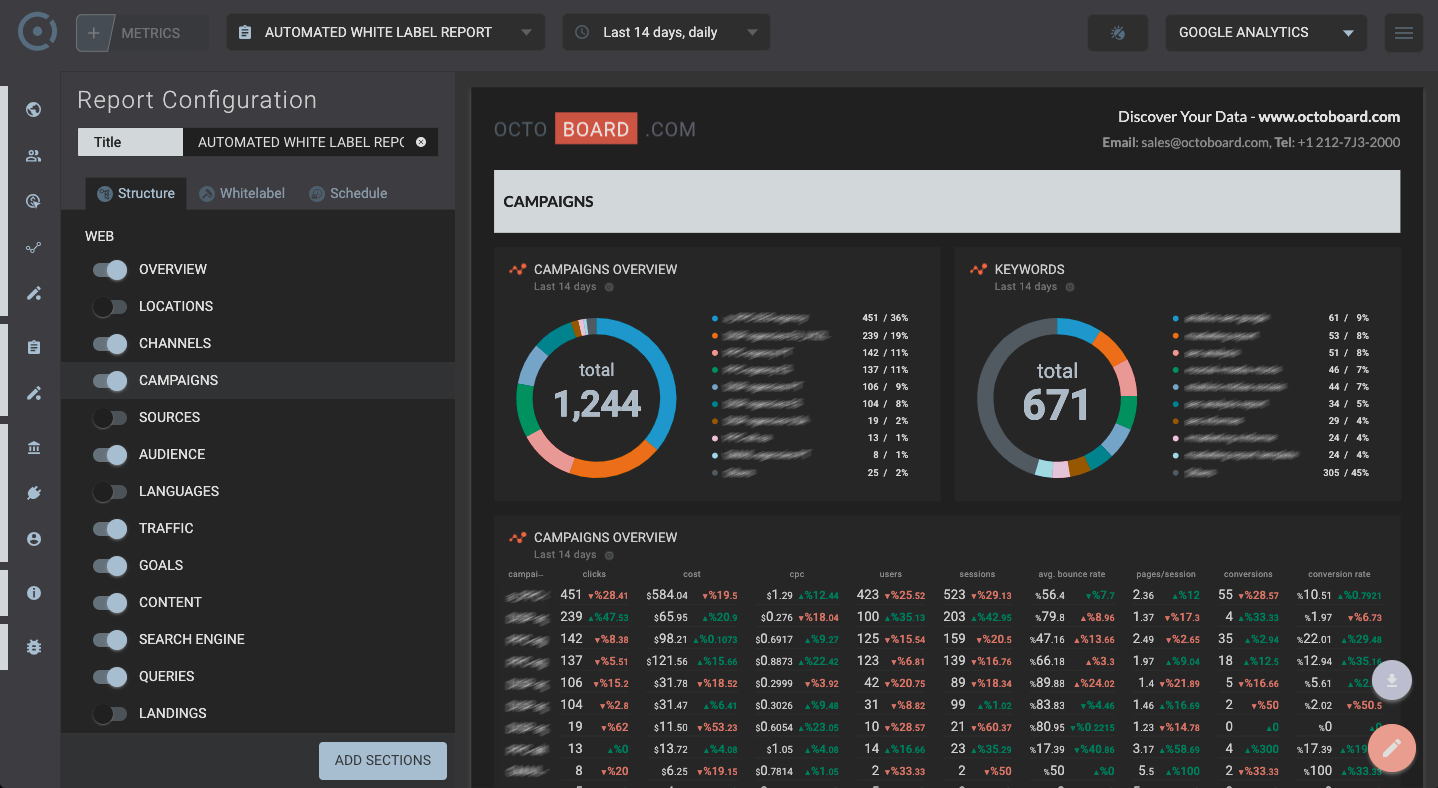
Google Analytics Campaigns details (report)
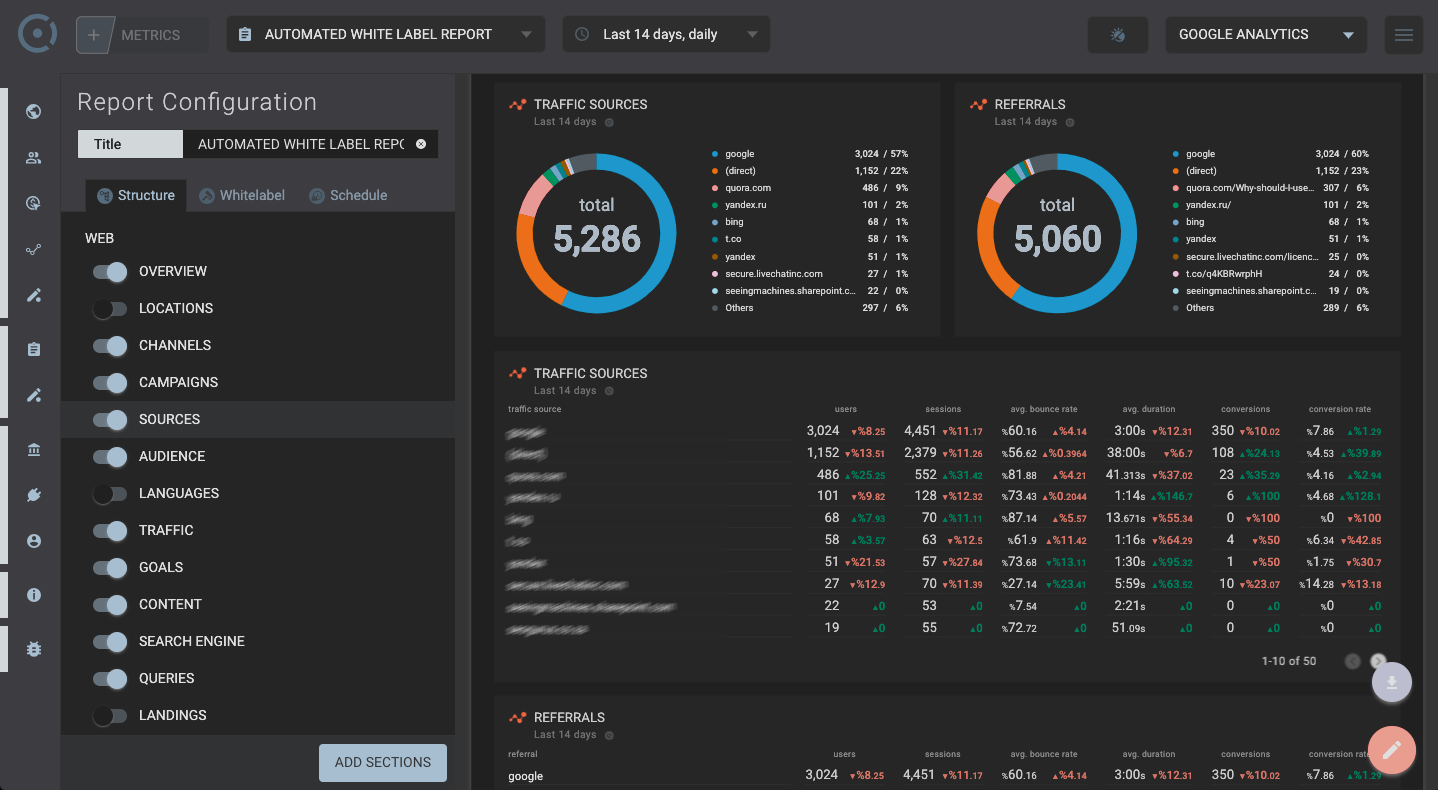
Google Analytics Sources and Referrals (report)
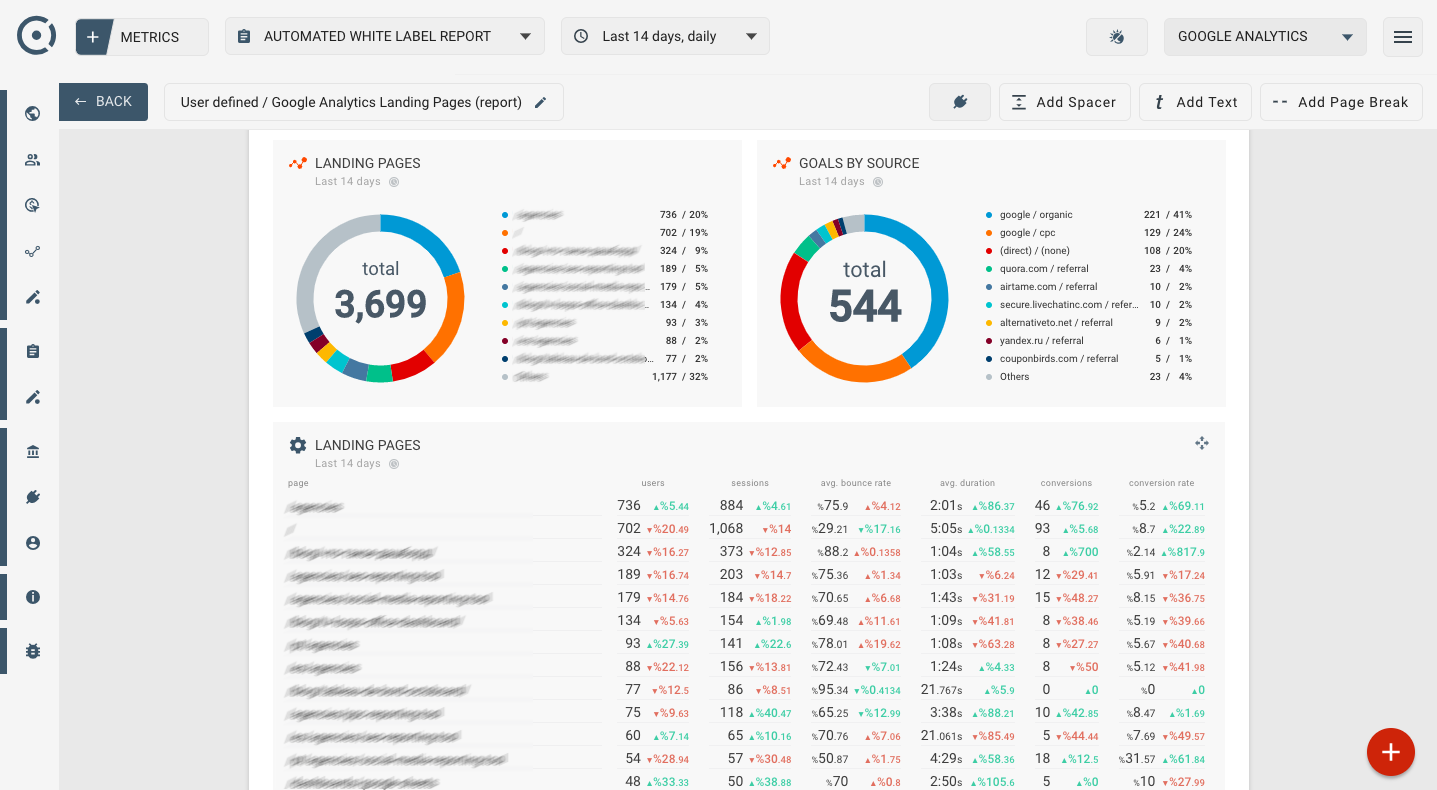
Google Analytics Landing Pages (report)
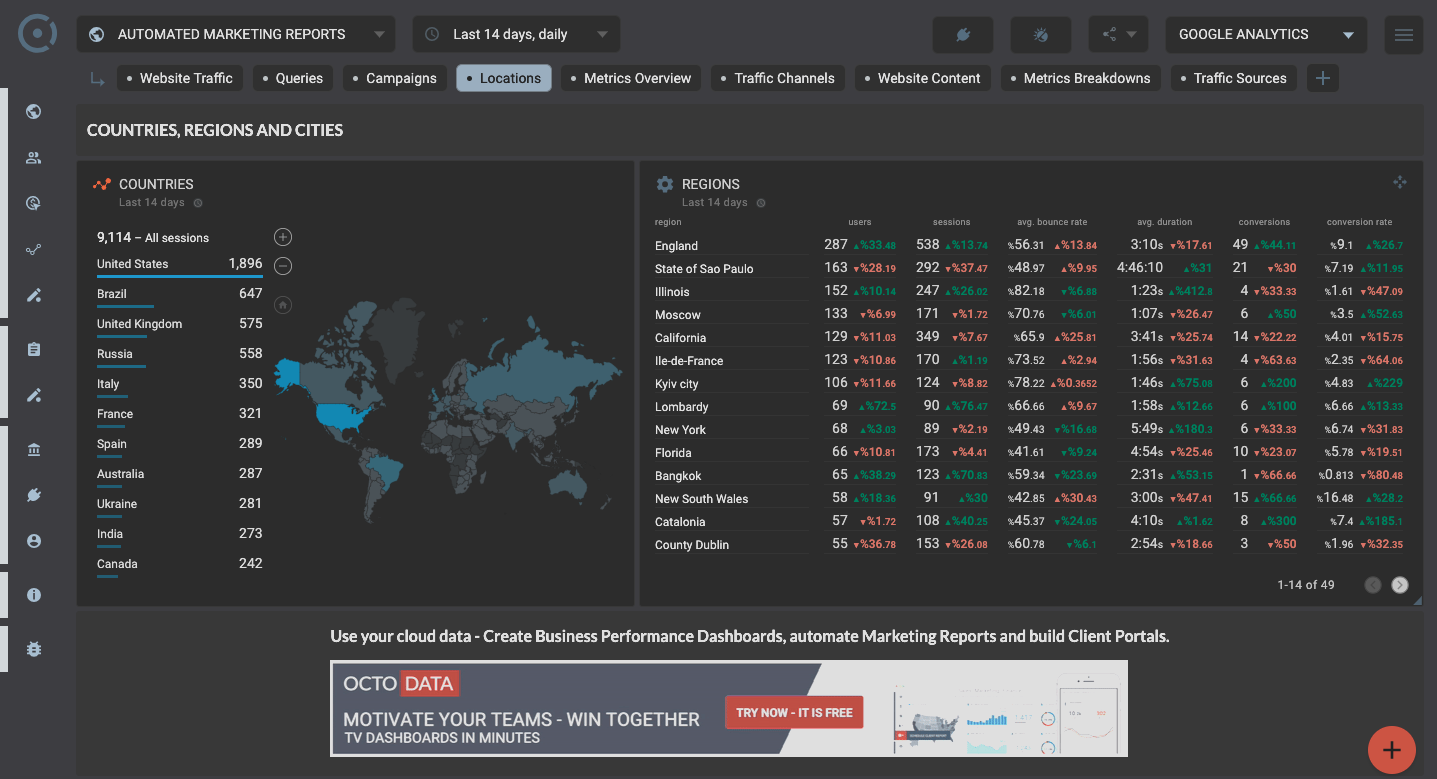
Google Analytics Location details (report)
Google Analytics Languages and Interests (report)
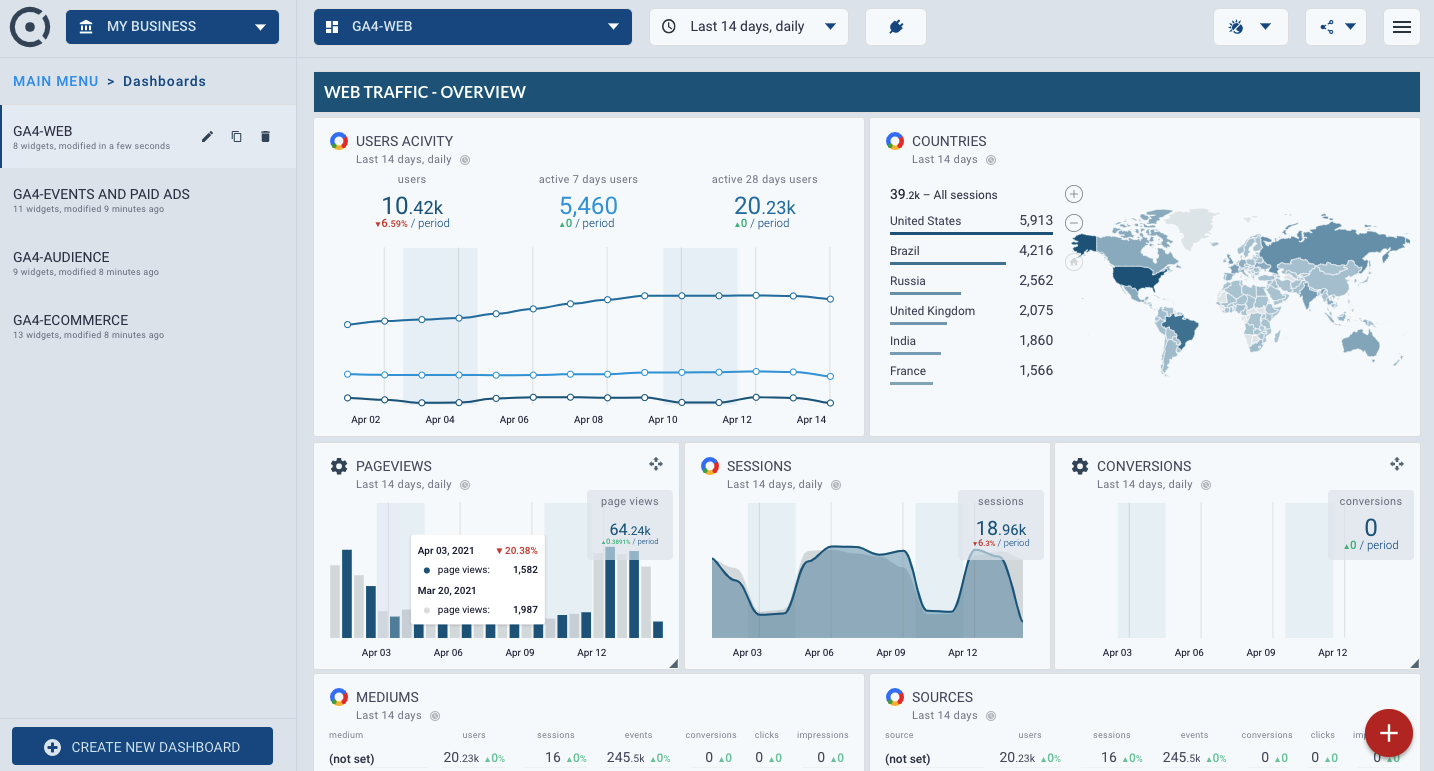
Google Analytics 4 traffic
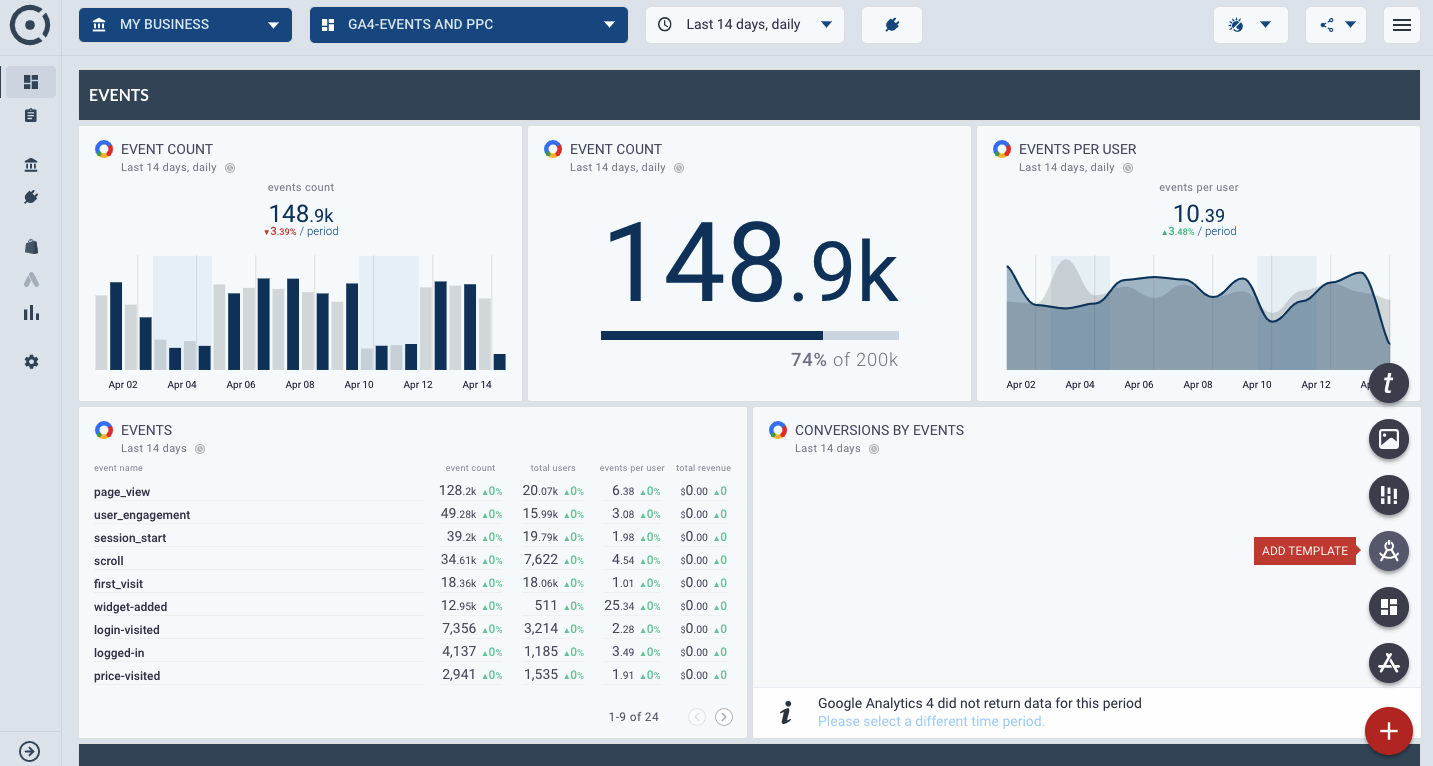
Google Analytics 4 PPC dashboard
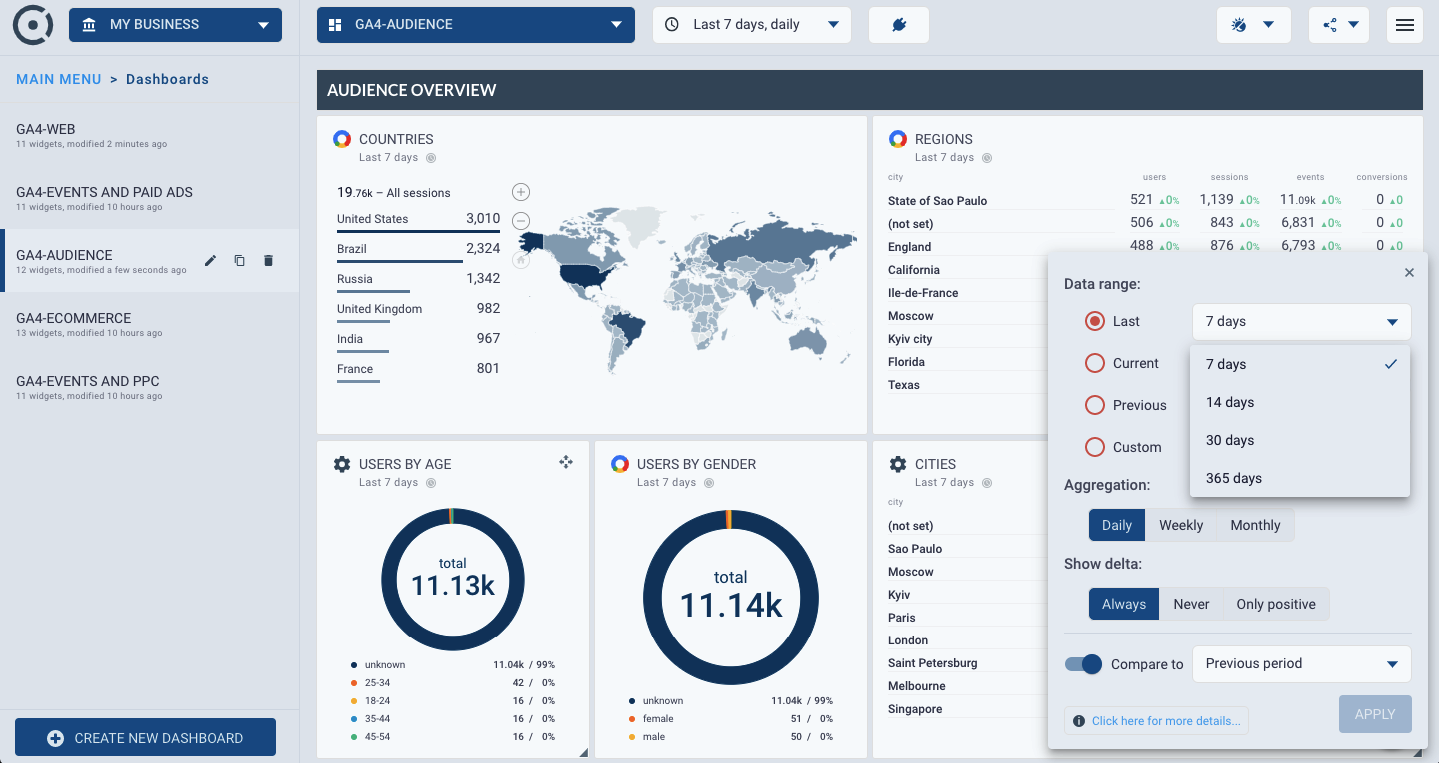
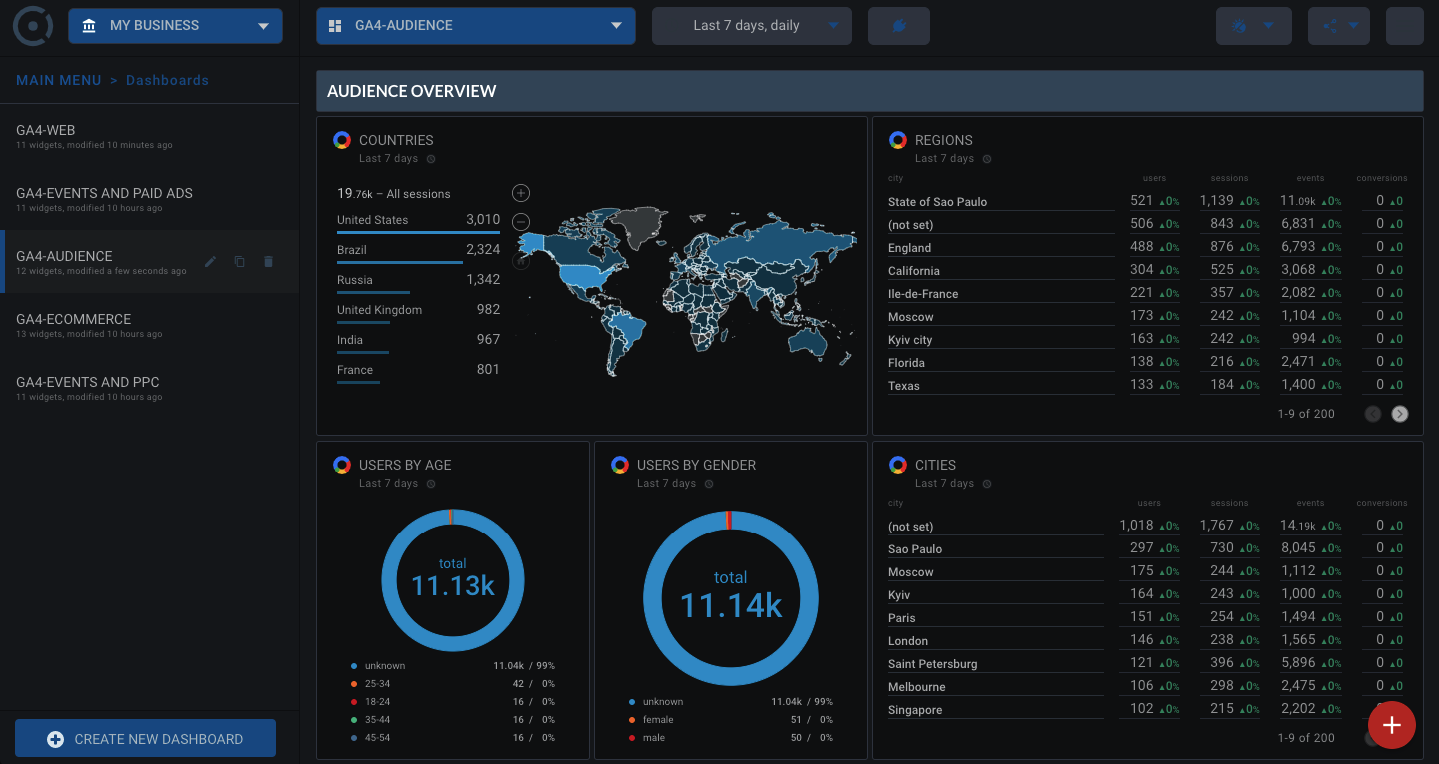
Google Analytics 4 audience dashboard
Google Analytics 4 E-commerce dashboard
GA4 traffic (Report)
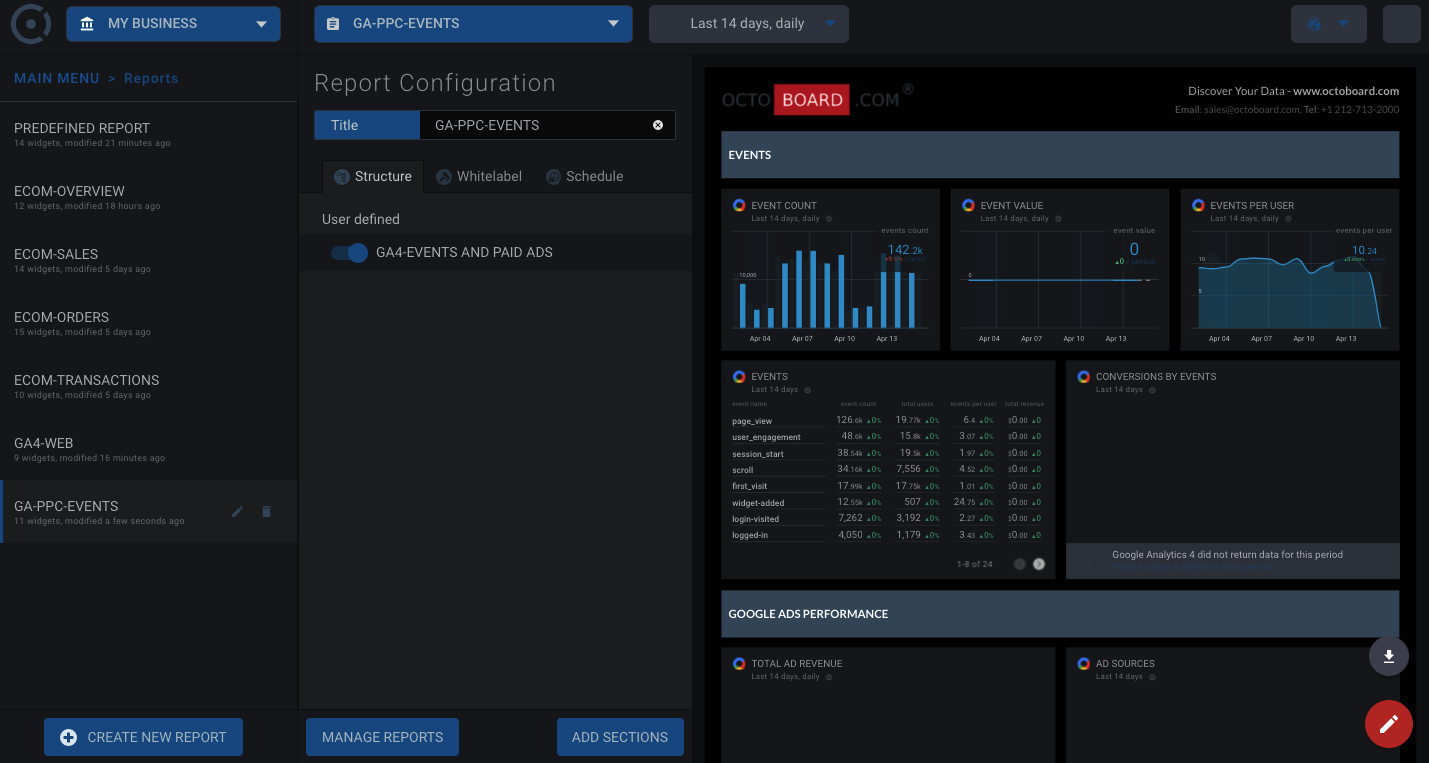
GA4 PPC dashboard (Report)
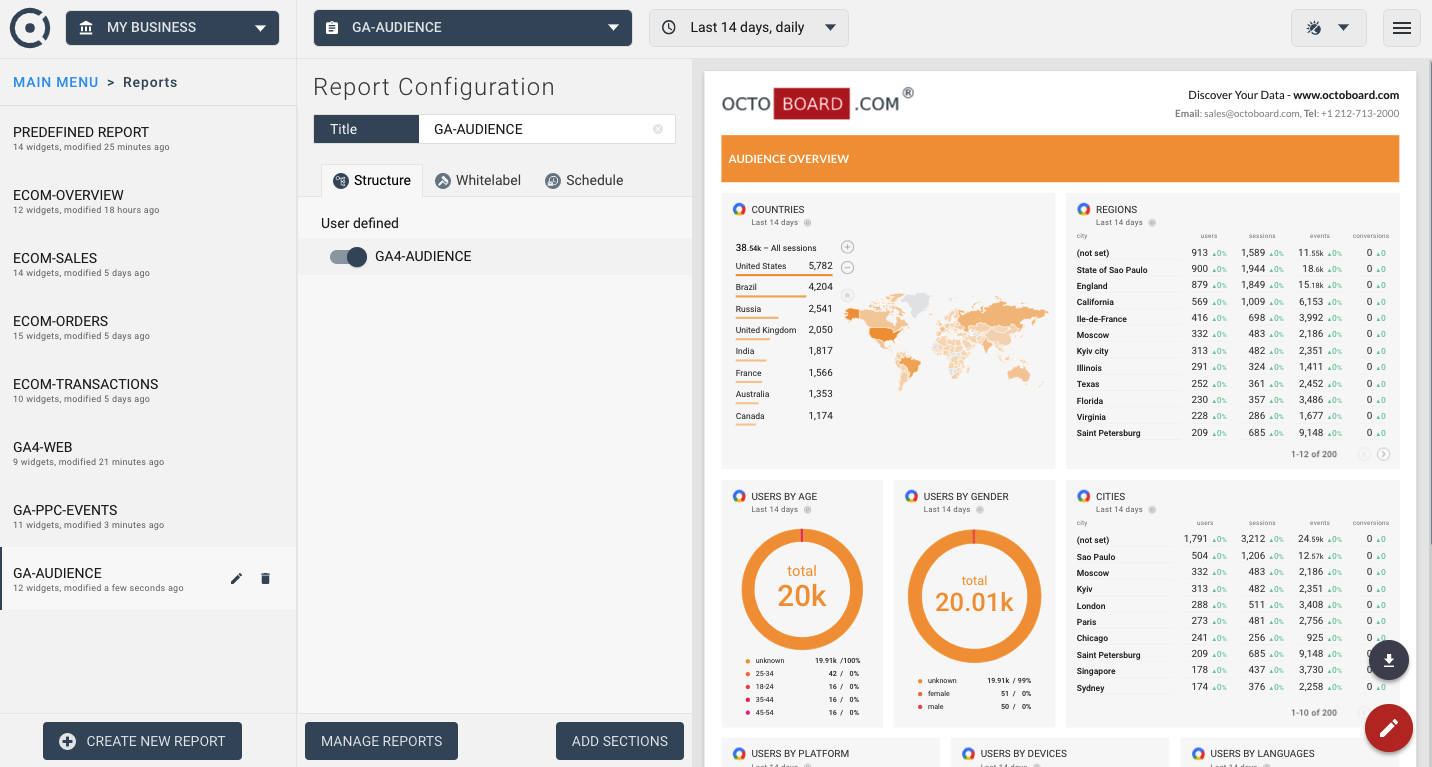
GA4 audience dashboard (Report)
GA4 E-commerce dashboard (Report)
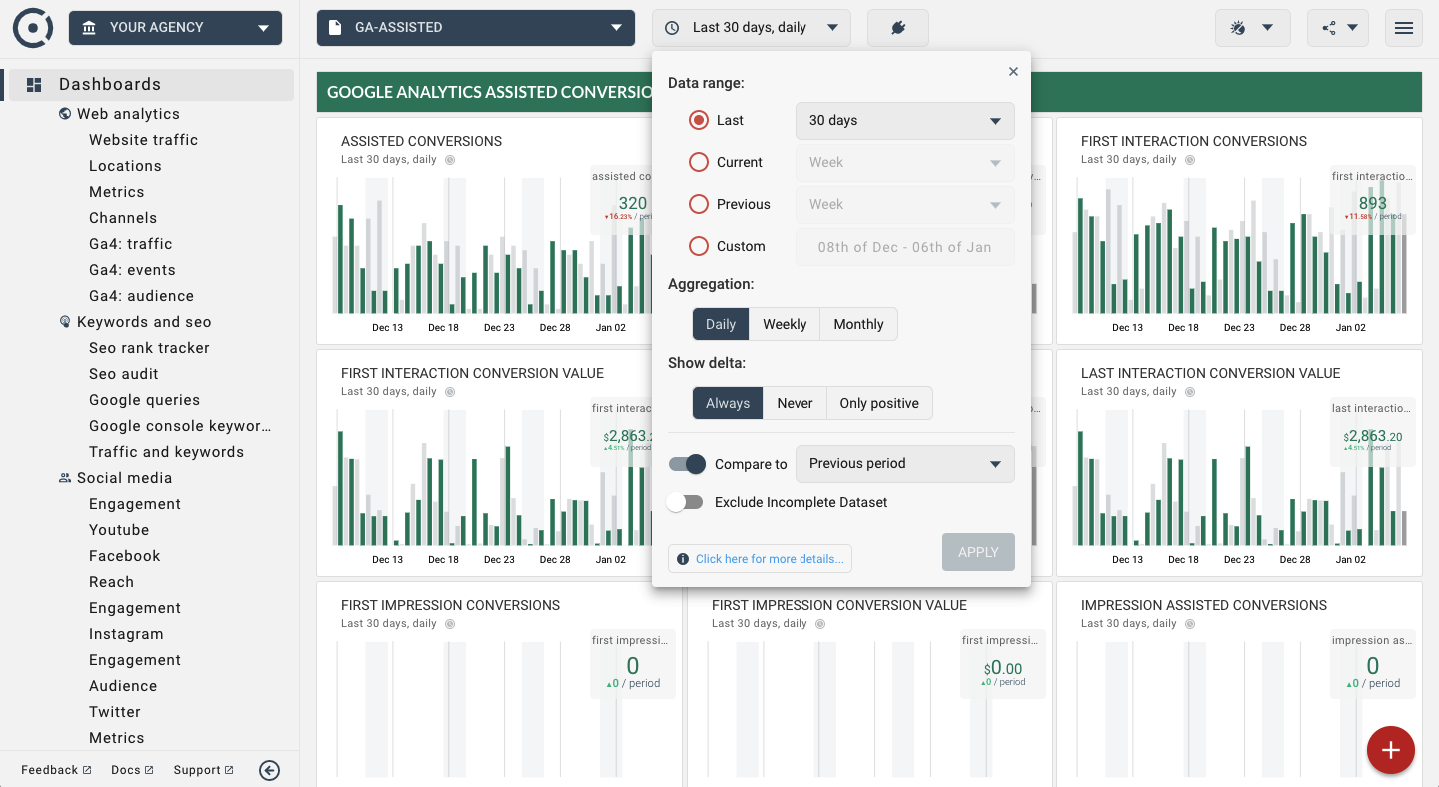
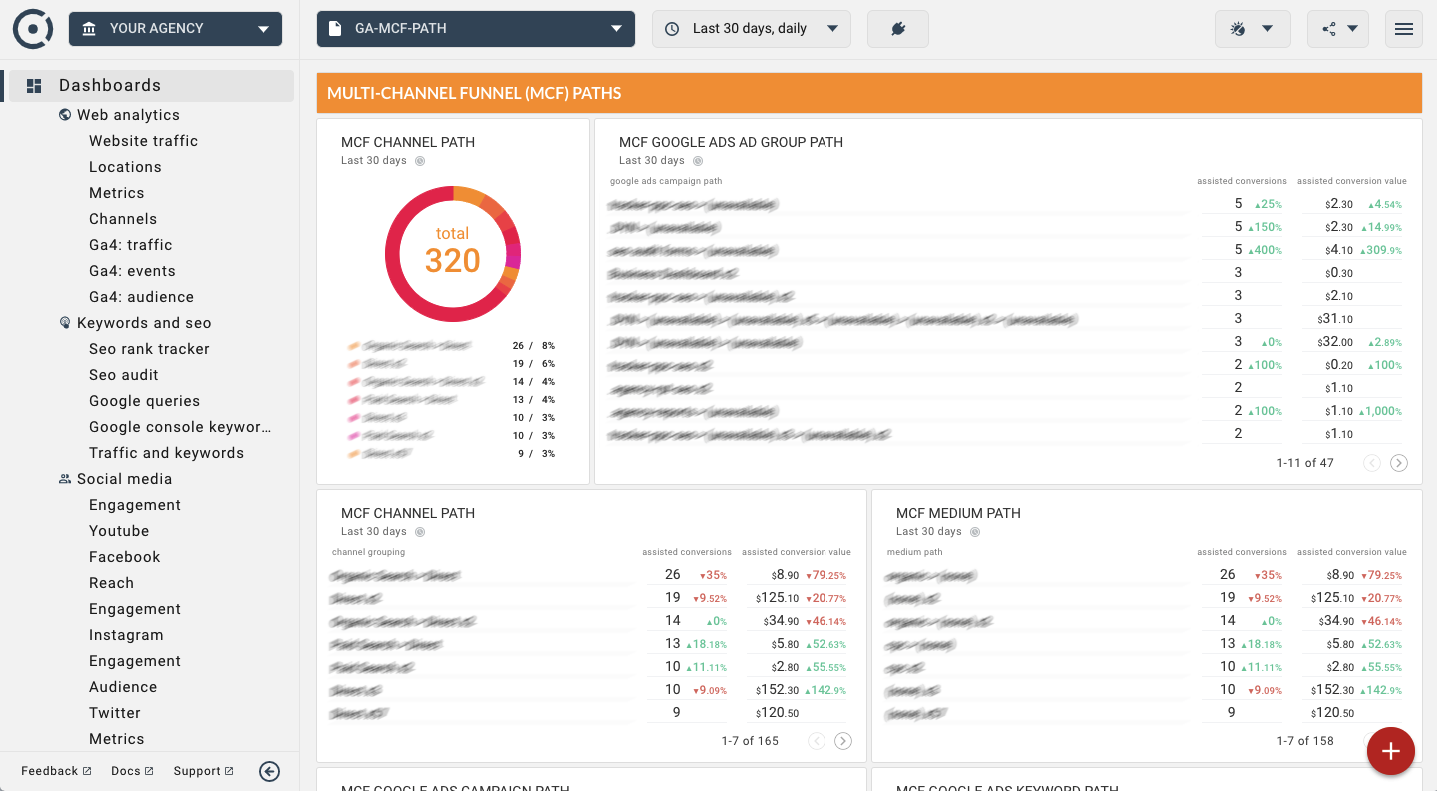
Google Analytics Assisted Conversions
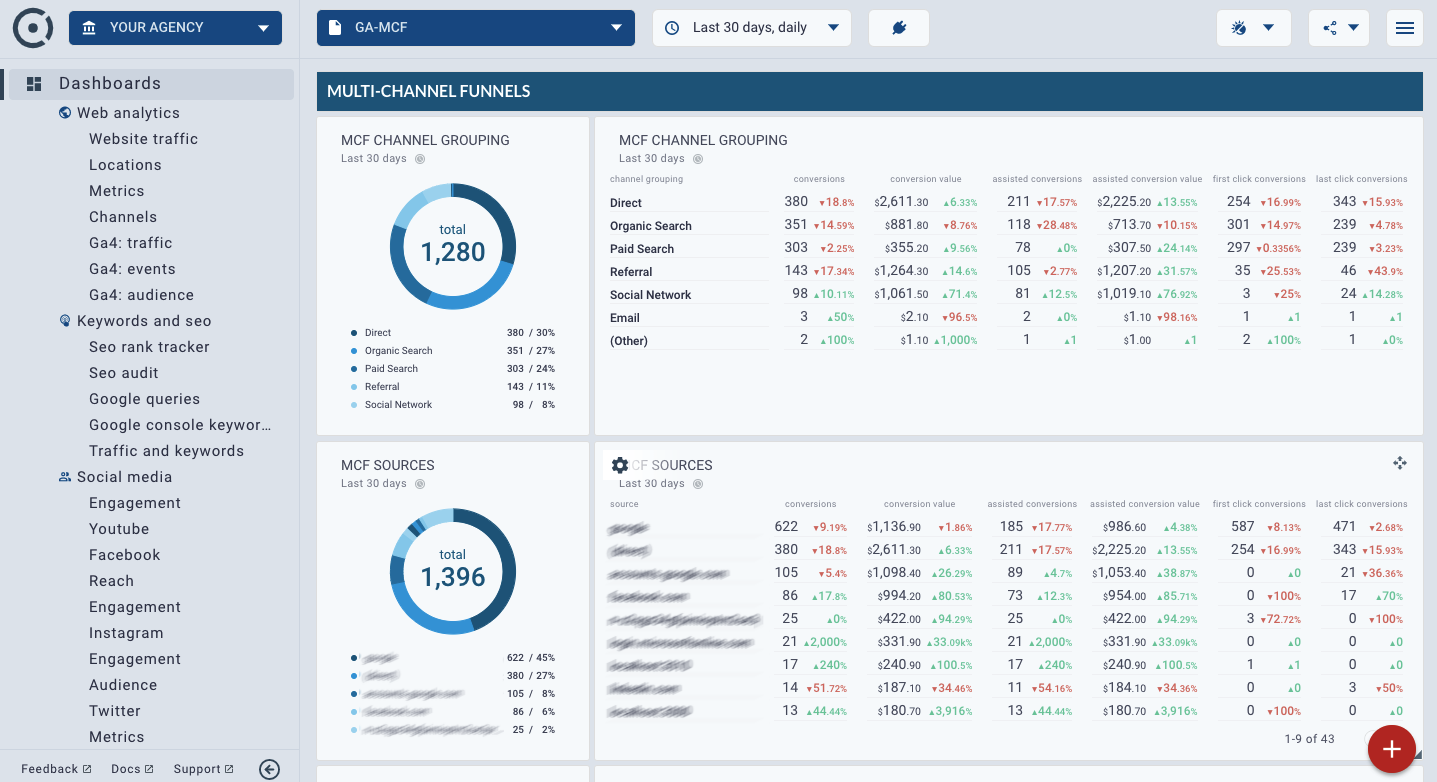
Google Analytics Multi-Channel Funnels