How to create mashup widgets?
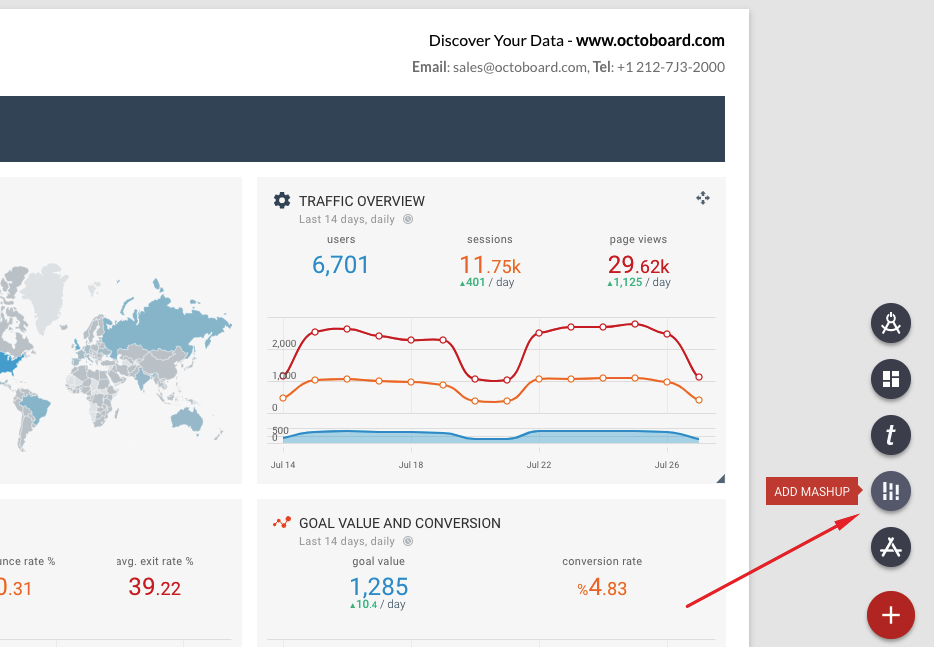
Data mashup is a special type of widgets - graph or chart - that can combine data from any data source. For example, you can use mashups to display your total paid advertising spend by combining ad cost data from Google Ads, Facebook Ads and other PPC platforms. Here is a sample "Total Ad Spend" mashup:

Start by using ADD MASHUP button at the bottom right corner of your screen. You can use mashups in dashboards and reports. In this example, we are working with a report.
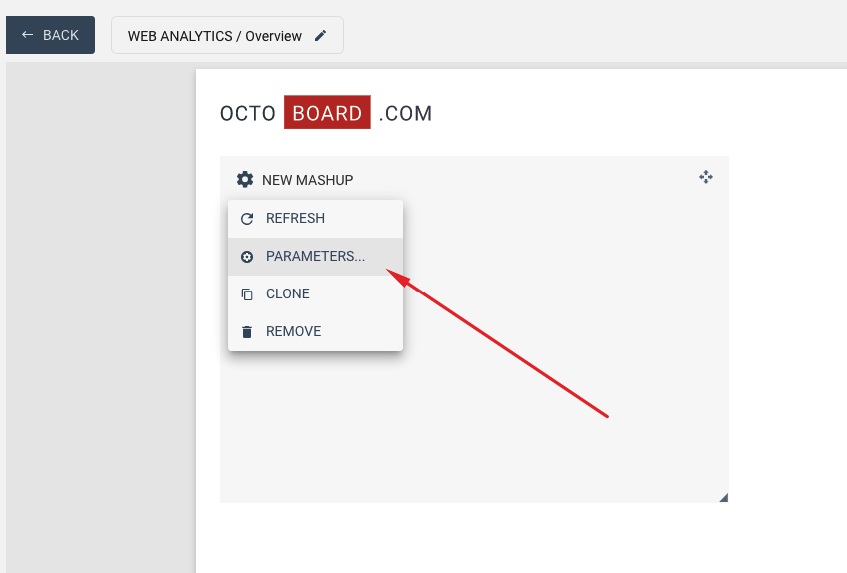
After you have clicked ADD MASHUP, you will enter MASHUP CONFIGURATION panel. A new empty mashup widget will be created in your report. In the configuration panel you can now start adding new data sources and metrics to the mashup graph.

You can always modify an existing mashup widget (or any widget) by using PARAMETERS menu item shown (see image below):
In the configuration panel, click ADD METRIC button to start adding metrics. In this example we change mashup widget name to "TOTAL AD SPEND" and combine Google Ads or Bing Ads costs.
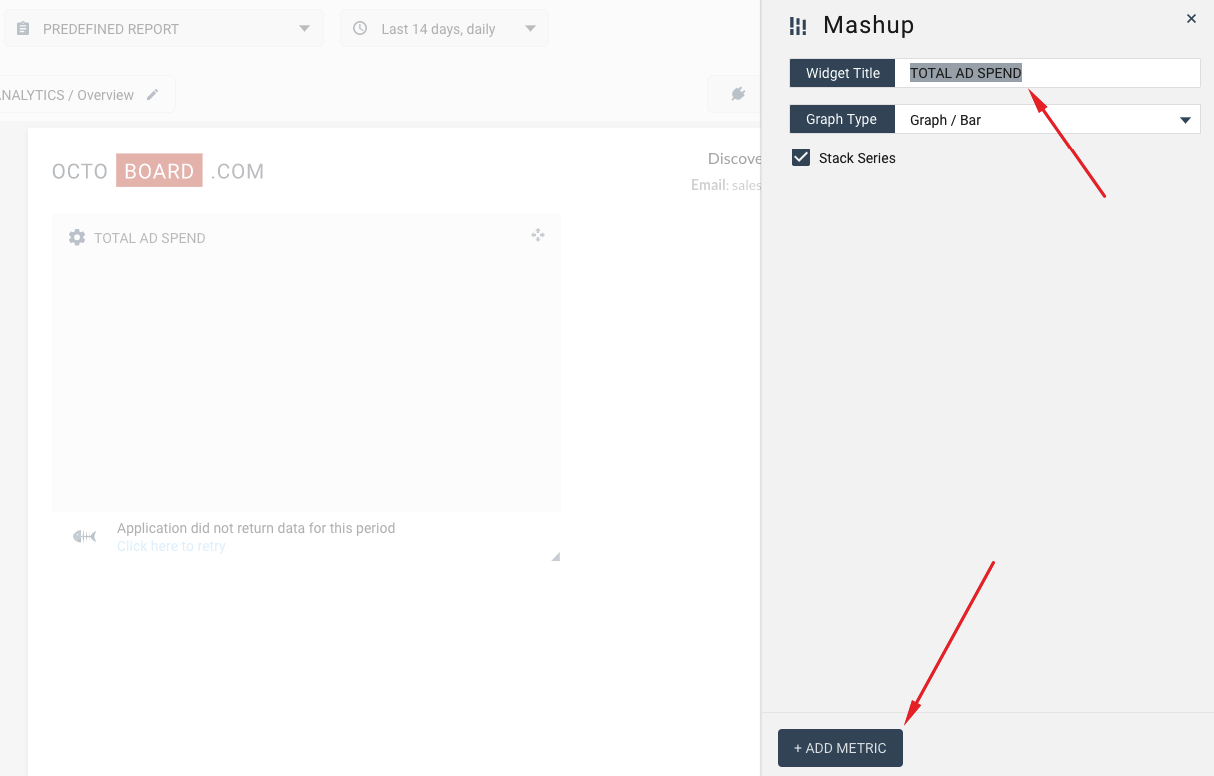
Once you click ADD METRIC, you will invoke CONNECTION WIZARD. Follow simple steps to first add Google Ads and Cost metric to our graph.
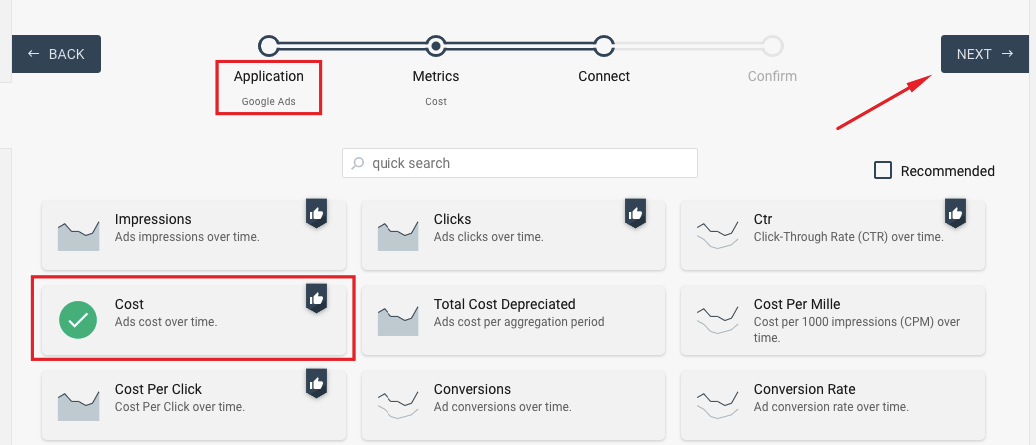
Once you have added your Google Ads Cost metric, you will have a historical graph in your mashup with just one data series that shows Google Ads spend over time. It will look something like this:
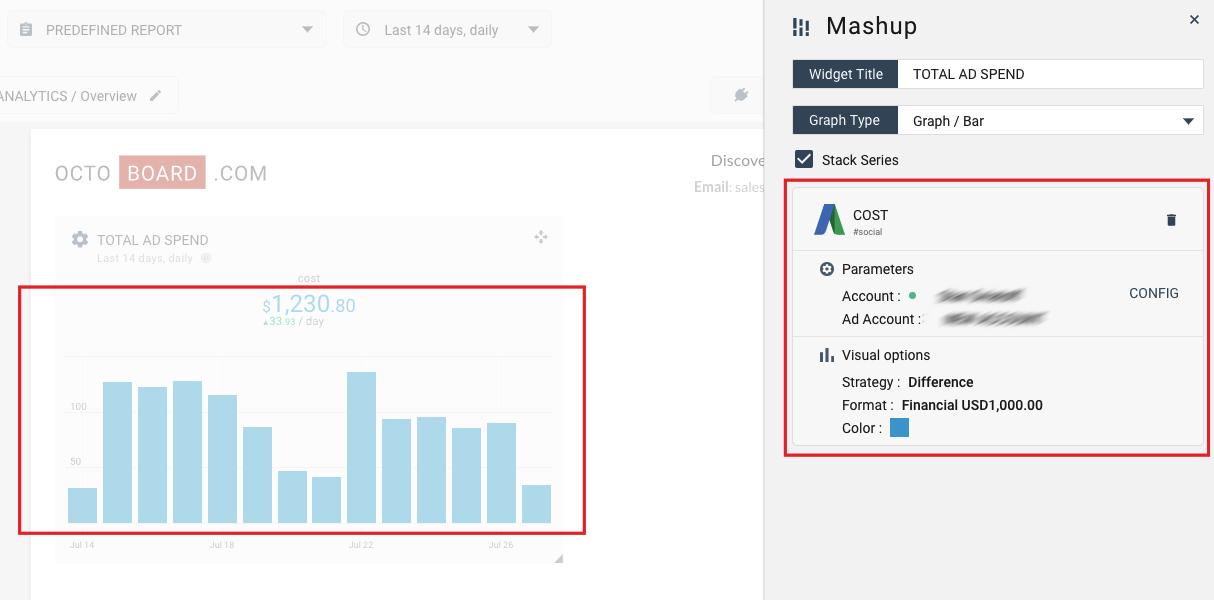
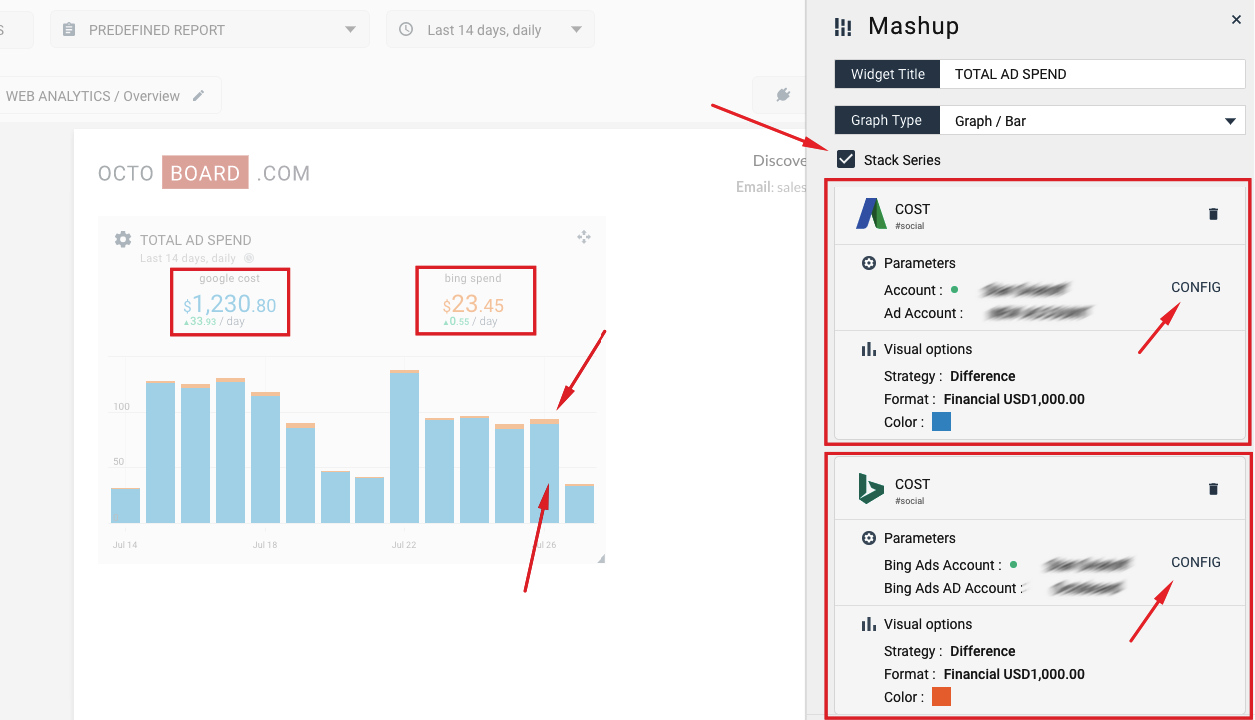
You can now click ADD METRIC again and add Bing Ads Cost by using the same wizard. Once Bing Ads is added, your new widget will look similar to the image below. You can change color of the Bing and Google data series, change data type (financial, numeric, percentage), change visualisation type from stacked to non-stacked and set new currency.
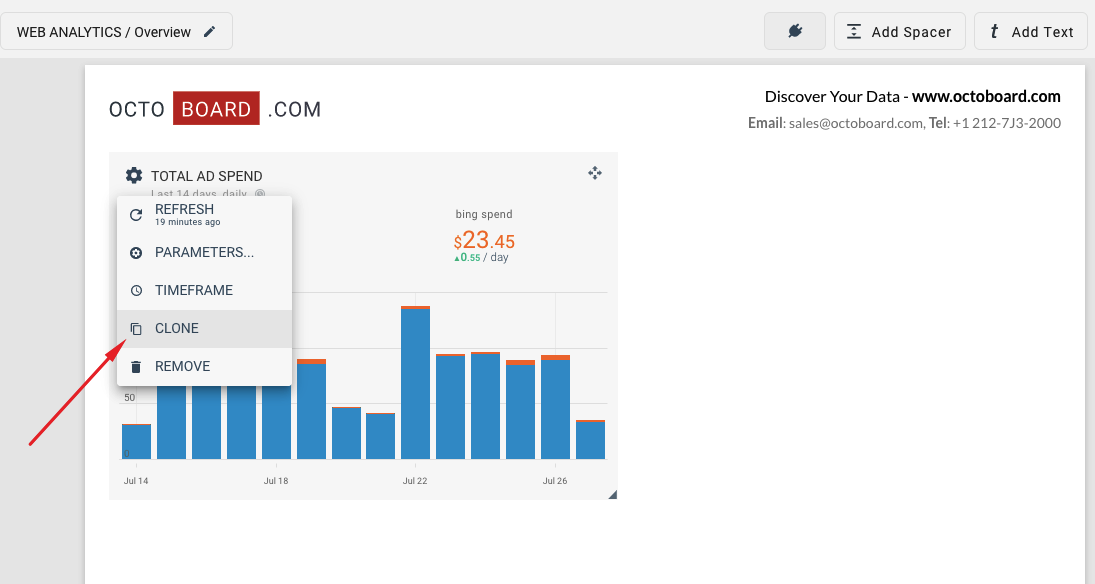
Once you are finished with the mashup widget, you can clone it (create a copy of it) to the same dashboard or even to another client within Octoboard. To create a clone, use widget's menu as shown here:
In this example, we create a copy of the widget and change it's type to PIE CHART. The two new mashups are shown side-by-side in the following image:
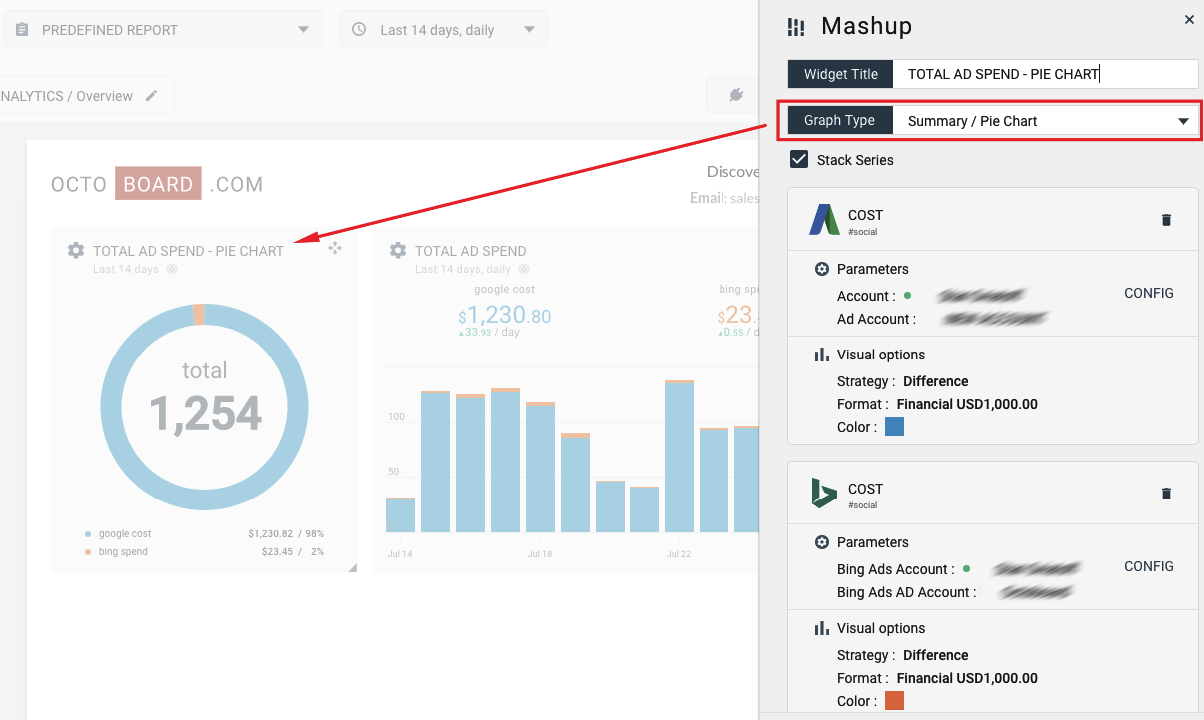
This completes our quick tutorial on creating mashup widgets. You can use the same steps to add up to 5 data series from any data source to any historical data chart or a pie chart mashup widget.