How to display historical data in Octoboard?
Octoboard collects historical data and monitors changes automatically. The platform can compare current values to previous month, quarter or year provided it is made available to us by cloud applications.
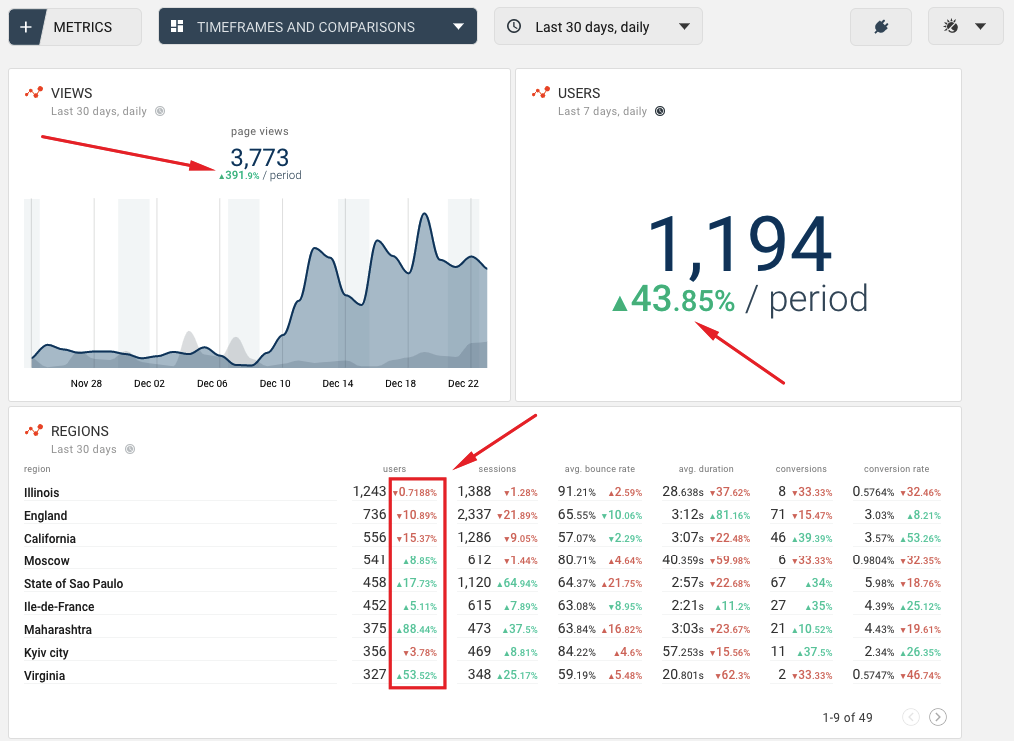
Here is an example of data comparisons displayed in graphs and in numeric widgets in a report:
Historical data changes (or delta) is displayed in table widgets, graphs and numeric widgets. The following image shows delta values displayed as percentages:
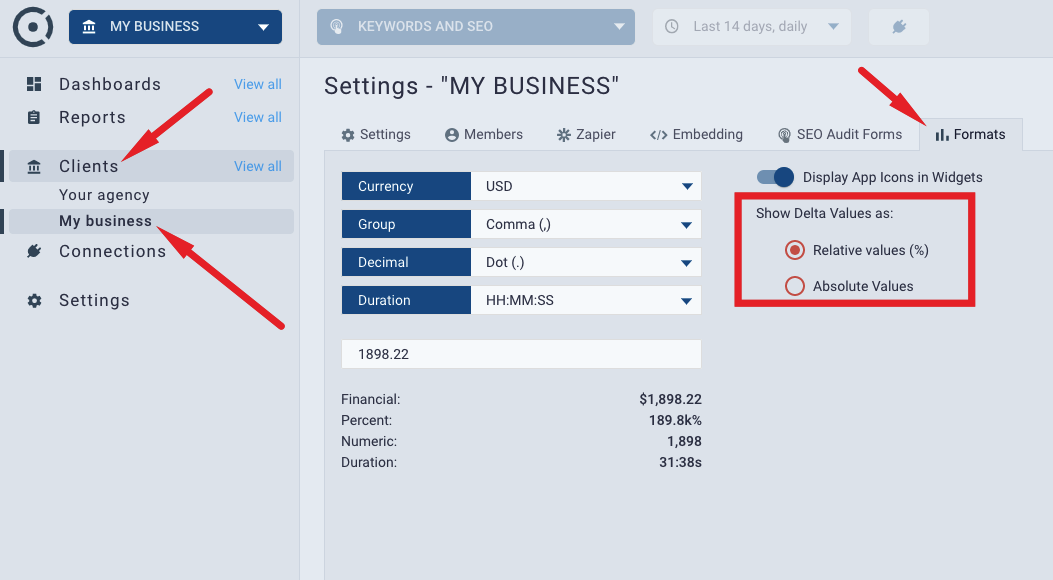
Historical changes in Facebook Ads and Google Ads reports can be shown in Relative (percentage) or Absolute values. You can change this setting per client. To do so, select "MANAGE CLIENTS..." menu item in the TOP-RIGHT menu, select the client (or team) in the list and go to "Formats" Tab. See image below for details:
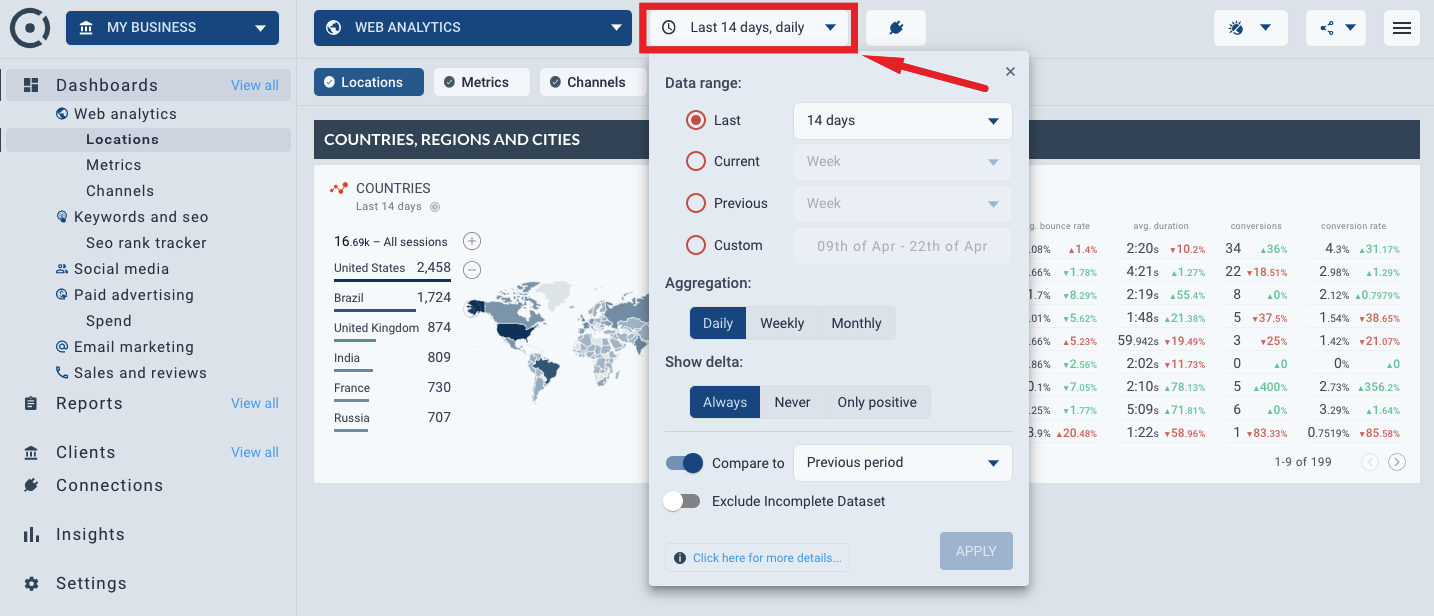
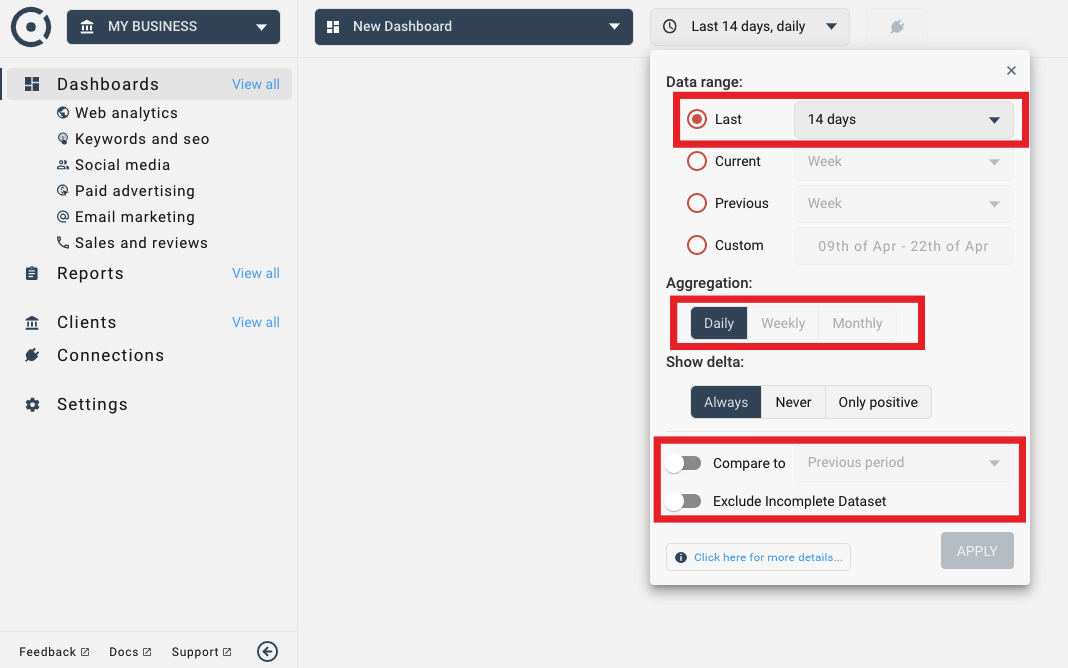
To configure how data is compared in Facebook Ads, Google Ads and other cloud platforms, you can change the following parameters: (a) TimeFrame, (b) Data Aggregation (daily, weekly or monthly) and (c) Data Comparison switch setting. These parameters can be set for entire dashboard or report as well as for individual widgets. To modify the settings for an entire dashboard, select the TimeFrame dropdown control at the top of the screen:
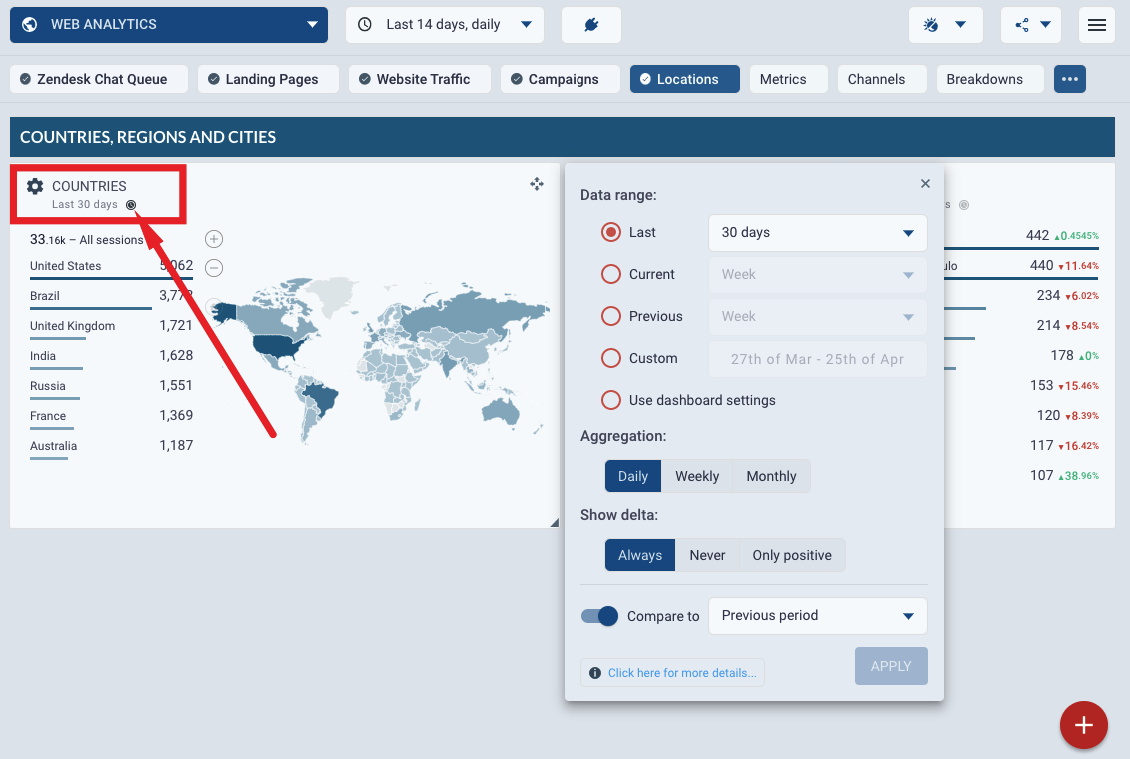
Any changes made in the dropdown control will affect entire dashboard or report. You can override these settings at the widget level. To do so, click the timeframe title at the top-left corner of any widget as shown on the following image:
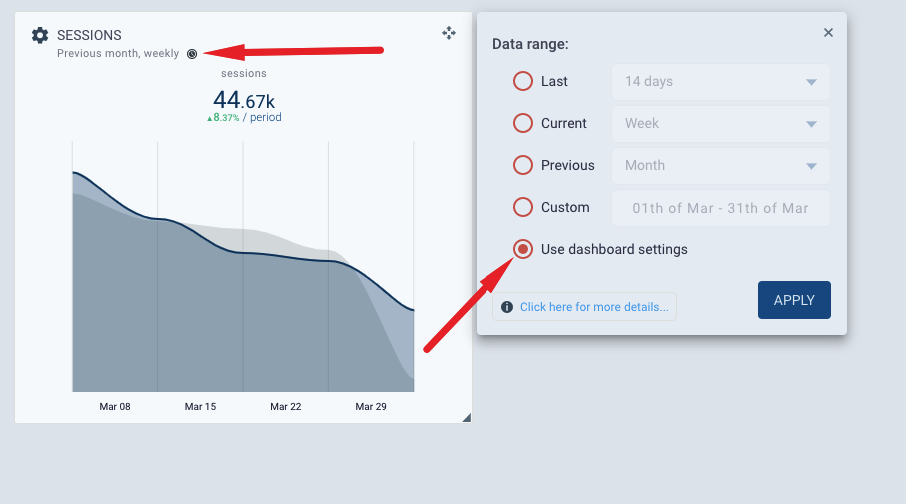
If the widget has its time frame changed, the time frame label will have an icon highlighted. You can discard widget timeframe configuration by selecting "Use dashboard settings" menu item show on the image below:
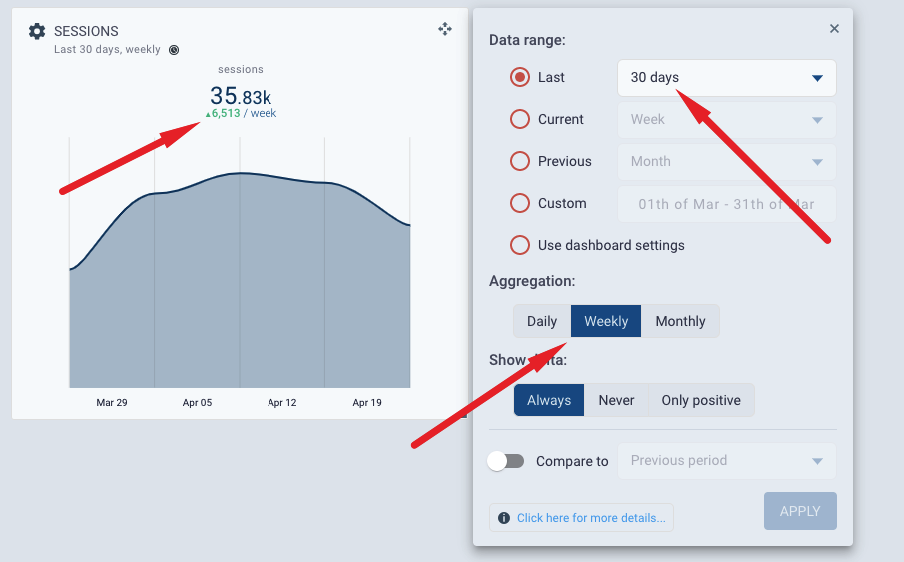
Delta values (historical changes) meaning changes depending on the "Compare to Previous Period" switch and on the Aggregation Period in the TimeFrame dropdown. If the switch is OFF, delta shows data change for the last aggregation period (last day, last week, last month). In this case, the widget is configured to show data for last 30 days. Delta displays change during the last week since the Time Frame aggregation is set to "Weekly":
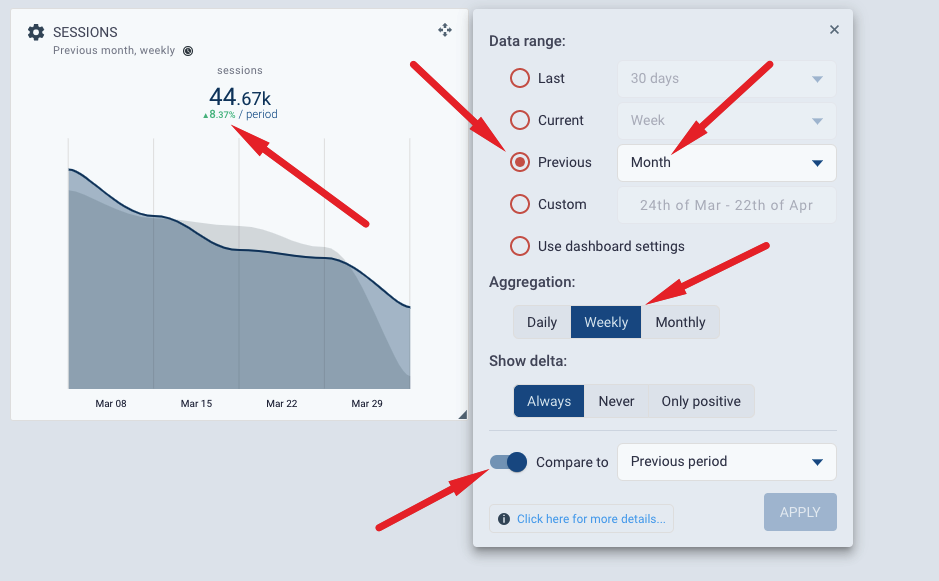
If the switch is ON, the delta shows the change for the entire widget period. In this case, the widget is configured to show data for previous month. The delta displays the change for the whole period (previous month) compared to the month before that:
Here is an example of what the timeframe menu looks like during the trial. Disabled menu items will be enabled after you purchase any paid subscription:
By default, if comparison switch is turned ON, you will compare currently selected timeframe to the time period immediately preceding it. With our new release, you can now select to compare data to the same period of time a calendar quarter ago (QoQ) or a calendar year ago (YoY).
QoQ and YoY comparison options will become available if the following conditions are satisfied:
- You are a paid customer of Octoboard. This feature is not available during trial.
- You are connected to a cloud platform that reports enough historical data to Octoboard via API.
- You have selected a calendar period in your dashboard or report ("Current month", "Current Quarter" and similar).
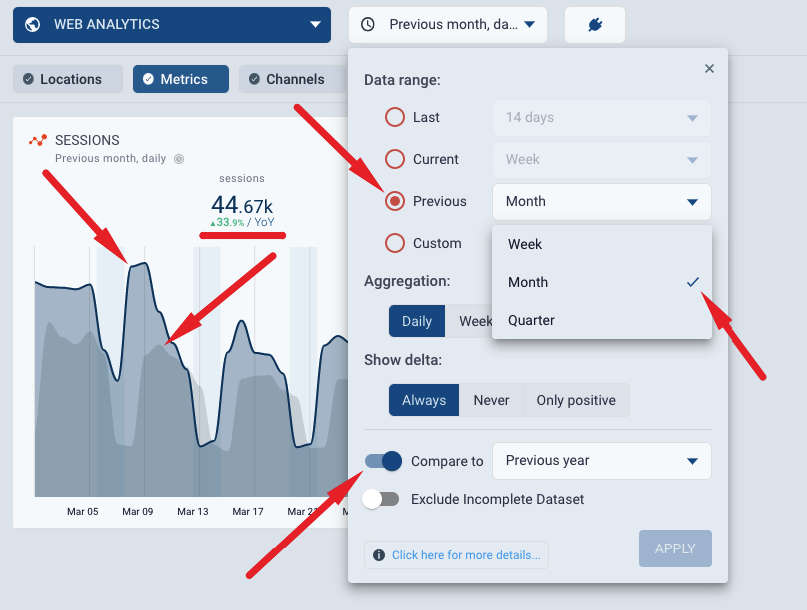
You can select QoQ and YoY comparisons by using the TimeFrame dropdown control for the whole dashboard, report or for individual widgets. The following image shows how to compare previous month data to the same month a year ago (previous month YoY comparison):
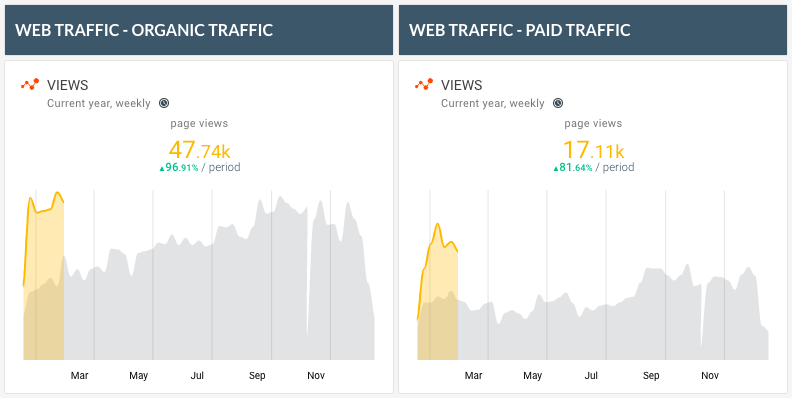
Here is another example of website traffic comparison. Current year (up to "today") compared to the same period of last year (YoY comparison). Graph on the left shows Organic traffic, graph on the right shows Paid traffic.
Please note, that QoQ and YoY comparisons only work for "calendar" periods. For example, it is possible to compare "Previous month" to data for the same month a quarter ago. It is not possible to do the same for "Last 7 days", for example, since "7 days" does not represent a calendar month or year and is does not always show time frame belonging to the same calendar period (month, quarter or year).
For more information on how much historical data is stored and on data frequency updates in Octoboard, please read this Knowledge Base post.
It would be unfair to show low or negative deltas if current period (day, week, month) is not yet over. "Exclude Incomplete Datasets" switch is available in the TimeFrame dropdown. It makes sure that the latest aggregation period (day, week, month) is excluded from comparison if it is not complete. For instance, if you select "Last 30 days, weekly" timeframe, the current incomplete week will be excluded from calculations for the current and previous data periods.
In addition to 11 standard time frames such as "Last 7 days", "Previous month" and others, you can configure custom timeframes. Here is example of a custom timeframe configuration:
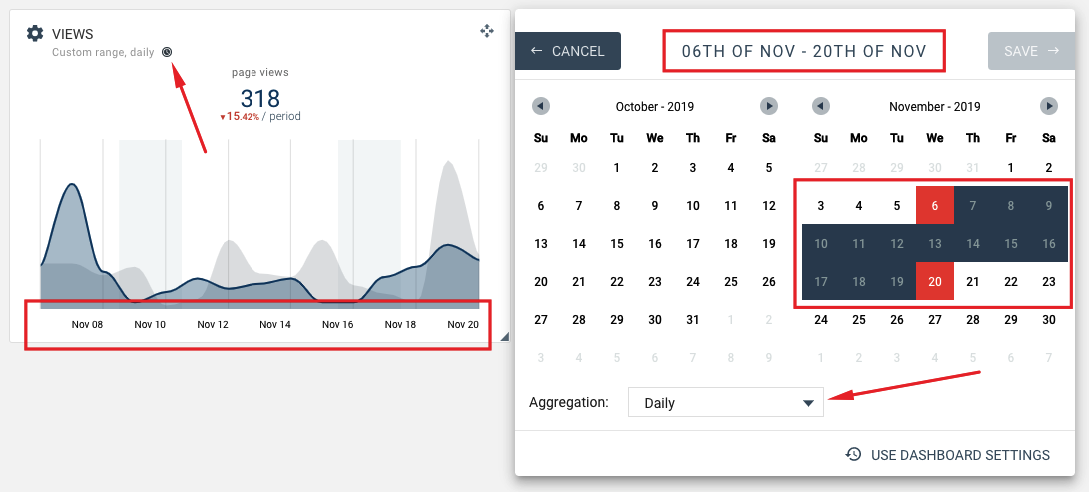
You can compare you custom period to the previous period as usual. The only difference is that custom time frames do not move forward with time. For example, if you select 15 days in November as your custom period, it will always display data for selected 15 days in November without shifting the dates forward as time goes by.