Automated Youtube Social Media Reporting Tool for Marketing Teams and Clients
Build automated social media reports for your marketing teams and clients using Youtube data.

YOUTUBE REPORTING
Youtube video and channel popularity and engagement metrics.

The power of video marketing is undeniable. As YouTube continues to dominate as the leading video-sharing platform, businesses and marketing teams must harness the potential of this platform to achieve growth, brand visibility, and a competitive edge. The key to unlocking this potential lies in the effective tracking and analysis of performance metrics. That's where the importance of a data analytics platform like Octoboard comes into play.
- Why Software Platforms/SaaS are Essential for Marketing Teams

Online businesses and marketing teams operate in an environment where data is king. With vast amounts of data generated daily, the challenge lies not just in collecting this data, but in interpreting and acting upon it. SaaS products:
Save Time: Manual data collection and report generation are time-consuming. Automated platforms expedite this process.
Provide Accuracy: Automated systems reduce the risk of human errors.
Offer Scalability: As your business grows, so do your data needs. Platforms can scale accordingly.
Deliver Insights: Beyond mere data collection, these platforms provide actionable insights for strategic decisions.
- The Merits of Octoboard for YouTube Reporting
Octoboard's automated data analytics platform stands out in delivering accurate and comprehensive YouTube reports. Let's delve deeper into some of the metrics that this platform tracks:
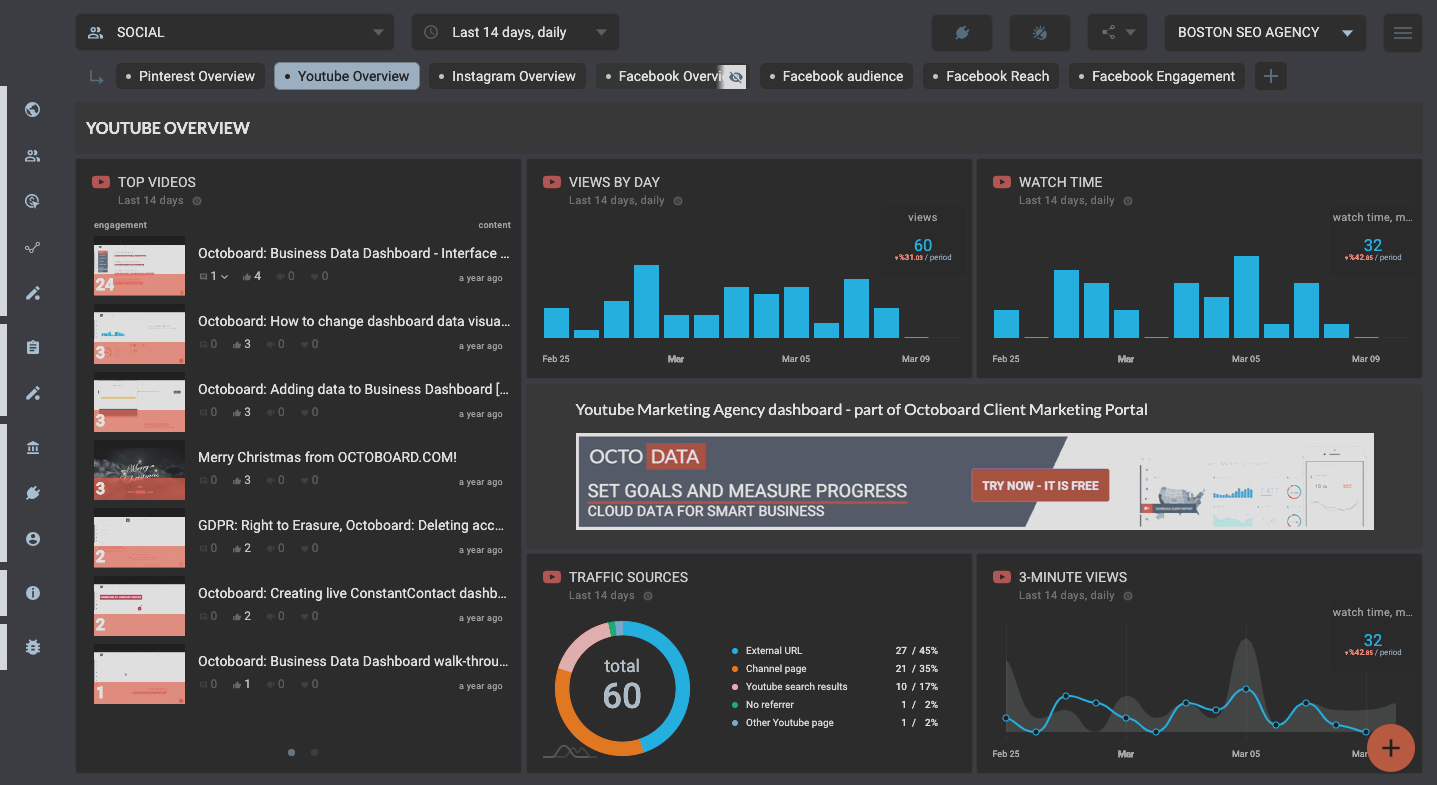
- LATEST VIDEOS and TOP VIDEOS
Track your most recent content and identify the videos that are trending. This helps strategists to understand what content resonates with viewers.
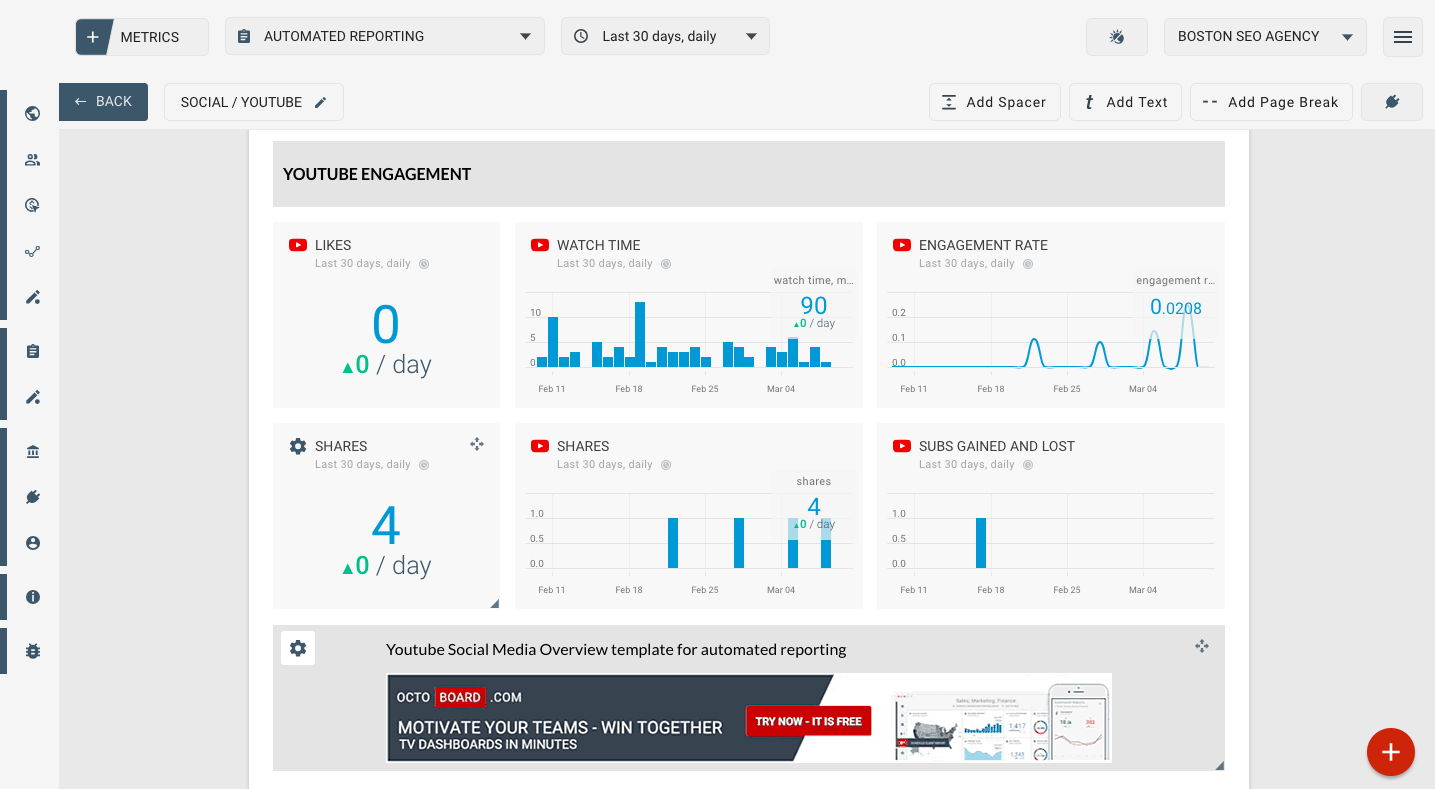
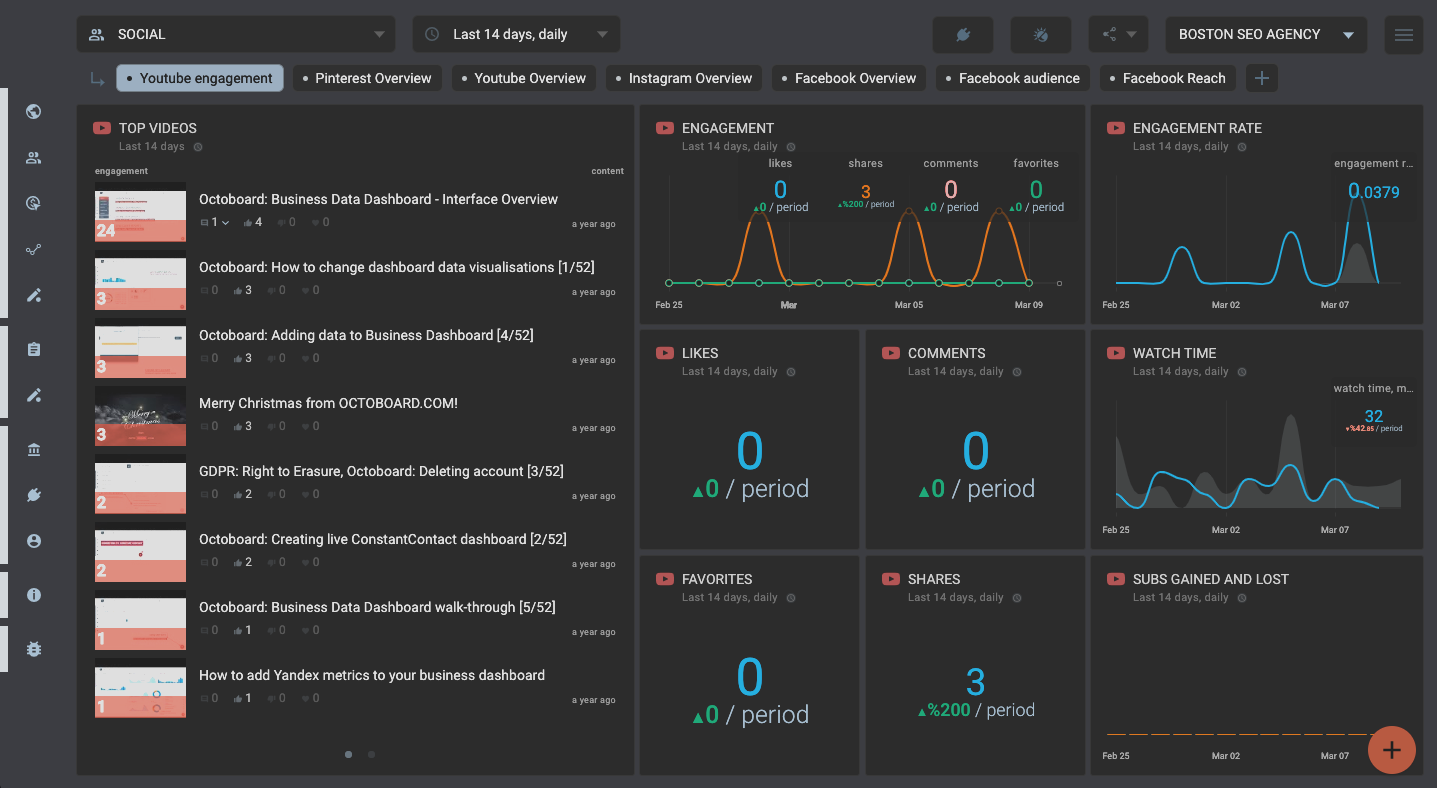
- ENGAGEMENT and ENGAGEMENT RATE
These metrics reveal the depth of interaction between viewers and your content. High engagement indicates that your content is impactful and relevant.
- TOTAL SUBSCRIBERS and SUBSCRIBERS (Gains and Losses)
Monitoring subscriber growth offers insights into channel health. Rapidly increasing subscribers signify positive content reception, while a decline might indicate a need for strategy reassessment.
- VIDEO VIEWS and WATCH TIME
Video views gauge popularity, while watch time measures retention. Both are crucial in understanding the effectiveness of your video content.
- VIEWS BY DAY, TOTAL VIEWS, and UNIQUE VIEWERS
These metrics provide a snapshot of channel activity and audience reach, essential for tweaking release schedules and content types.
- VIEWS BY COUNTRY
Understand your global reach and identify potential markets for targeted content.
- TRAFFIC SOURCES
Determine which platforms or sources are driving the most viewers to your videos. This can guide promotional strategies.
- AGE AND GENDER
This demographic data assists in tailoring content to suit your primary audience.
- VIEW DURATION
Short view durations might indicate that viewers are skipping or losing interest, highlighting areas for improvement.
- COMMENTS, FAVORITES, LIKES, and SHARES
These metrics provide direct feedback from your audience, indicating video reception and potential virality.
- The Bottom Line
Automating YouTube reporting is not just a convenience; it's a strategic necessity. By leveraging the power of platforms like Octoboard, businesses can make informed decisions, refine their content strategy, and optimize engagement. With accurate and insightful metrics at their fingertips, marketing teams are better equipped to navigate the dynamic landscape of YouTube and harness its full potential for growth.
- Youtube channel and videos popularity
- Youtube traffic sources
- Your audience metrics (age, gender, location)
Automated data reports enabled by Octoboard software
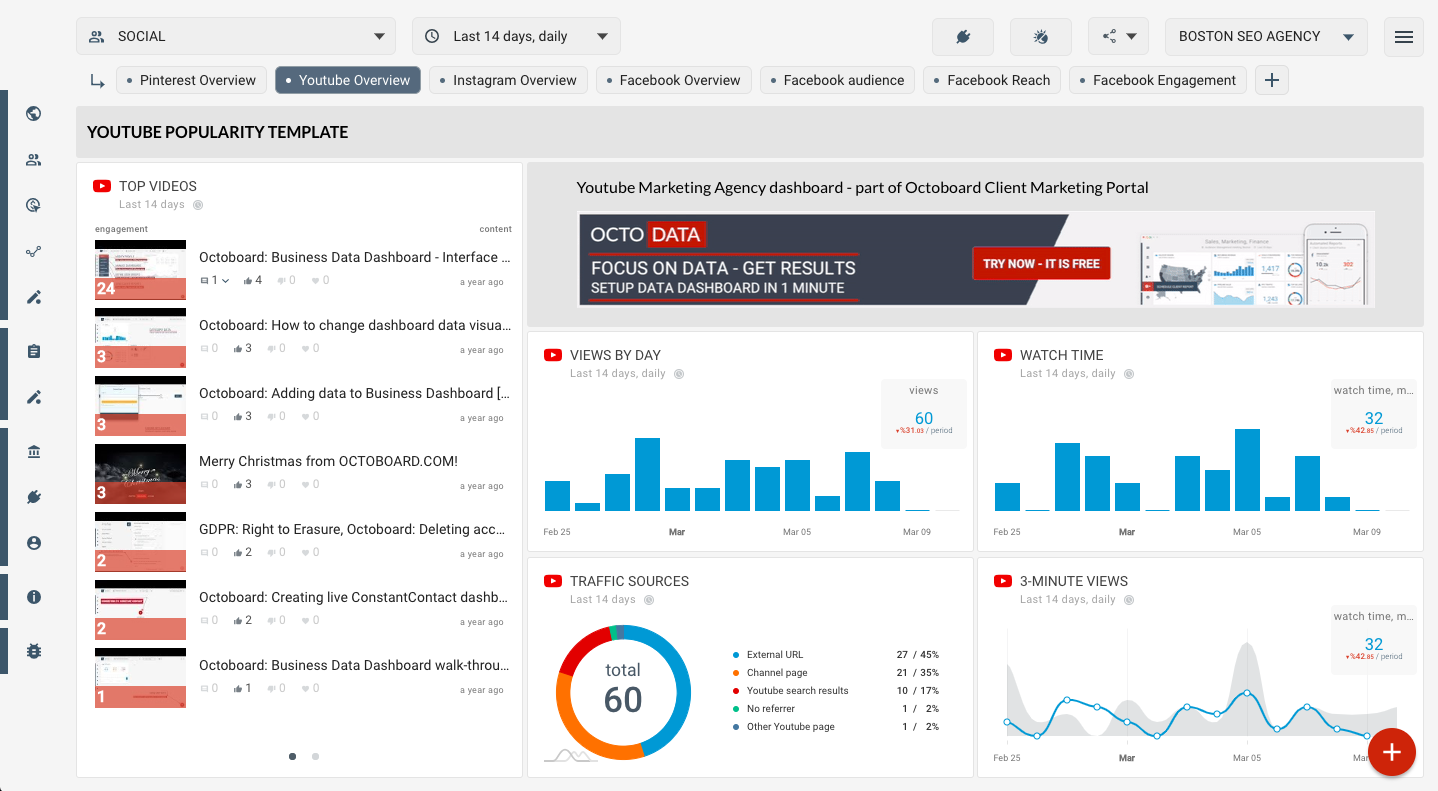
Youtube Overview
Youtube Engagement
YouTube Overview

Youtube Engagement