Mastering Cross-Channel PPC Advertising Analytics: Top Metrics for Google Ads, Facebook Ads, Tiktok, Snapchat, Criteo reporting

Paid advertising analytics platforms play a key role in helping marketers track, analyze, and optimize their campaigns efficiently. These platforms provide insights into ad performance metrics like click-through rates, conversion rates, and return on ad spend. By analyzing this data, marketers can understand campaign effectiveness, make informed decisions, and allocate budgets wisely.
- Benefits of Paid Advertising Analytics Platforms
- Benefits of Cross-Channel Reporting for PPC Advertising
- Understanding the Key Platforms for PPC Advertising
- Essential Google Ads Performance Metrics
- Key Metrics for Optimizing Facebook Ads
- Tips for Optimizing TikTok Ads Campaigns with Analytics
- Tracking Performance on Snapchat Ad Spend
- Optimizing Criteo Metrics for Better Retargeting Results
- Challenges of Inconsistent Metrics Across Platforms
- Streamlining PPC Advertising Analytics with Uniform and Normalized Reports
- Creating a Unified Dashboard for Cross-Channel PPC Analytics
- Key Metrics for Accurate Performance Tracking
- Benefits of Conversion Tracking
- Best Practices for Building Actionable PPC Reports
- Future Trends in PPC Advertising Analytics and Reporting
One main advantage of using paid advertising analytics platforms is the ability to monitor campaign performance across multiple channels. With businesses running campaigns on various platforms simultaneously, it can be challenging to get a holistic view without the right tools. These platforms consolidate data from different sources into a central dashboard, enabling marketers to analyze metrics comprehensively.
Another benefit is the customization of reports to generate actionable insights. Marketers can focus on specific metrics like impressions, clicks, and conversions to gain a deeper understanding of campaign performance. These customizable reports help identify trends, optimize campaigns in real-time, and maximize ROI.
Paid advertising analytics platforms also offer advanced features such as conversion tracking, audience segmentation, and A/B testing. Conversion tracking helps monitor user actions post-click, aiding in assessing campaign effectiveness. Audience segmentation allows the creation of more personalized ads by dividing the target audience into specific groups based on demographics or behaviors. A/B testing helps in testing different ad variations to identify high-performing elements.
Paid advertising analytics platforms empower marketers to track, analyze, and optimize campaigns effectively. Through features like conversion tracking, audience segmentation, and A/B testing, marketers can create more targeted campaigns, driving better results and maximizing ROI.
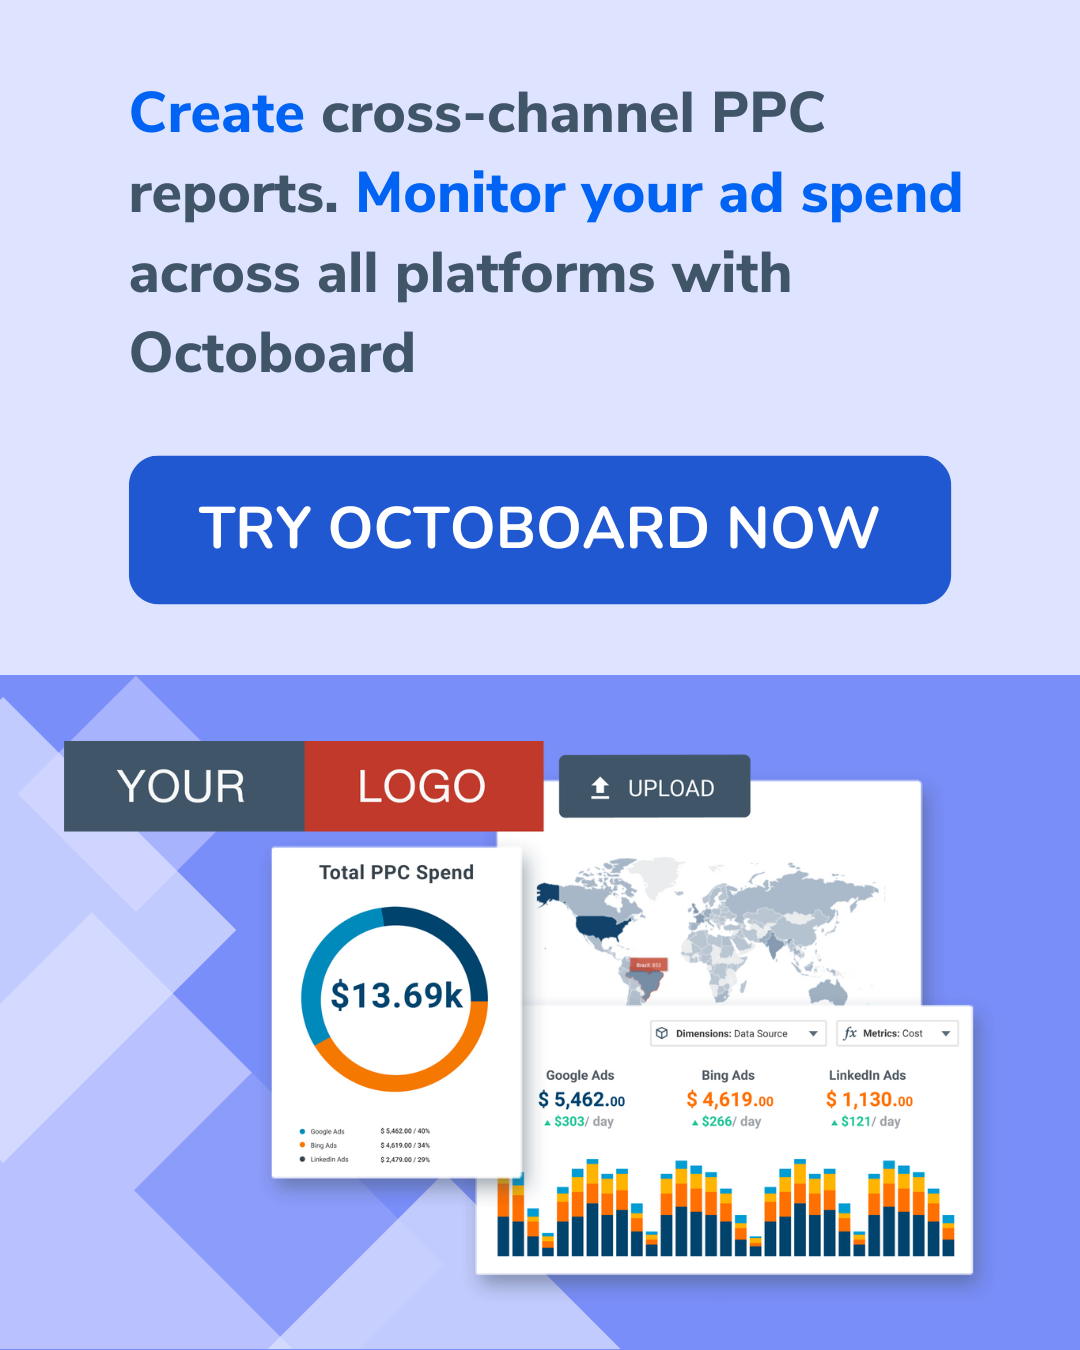
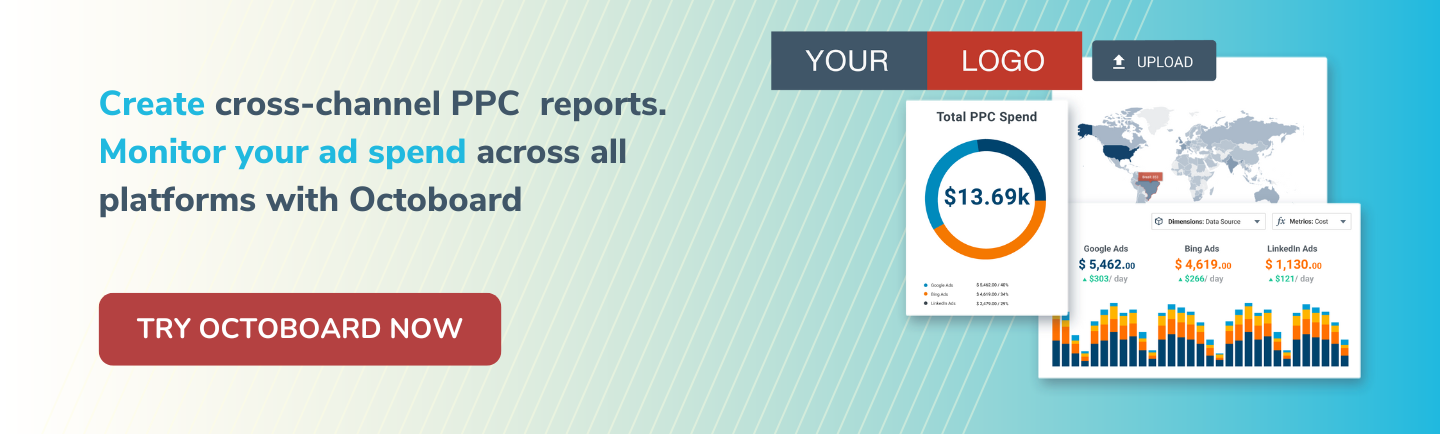
You can try building your first automated paid advertising reports by visiting Octoboard’s PPC reporting product
Cross-channel reporting consolidates data from various advertising platforms into a single dashboard for comprehensive analysis. This integrated approach allows marketers to compare campaign performance across different channels, optimize budget allocation, and leverage cross-channel synergies. By understanding user behavior across various touchpoints, marketers can create cohesive marketing campaigns that deliver consistent messaging and improve results.
By gaining insights into the customer journey from awareness to conversion, marketers can identify touchpoints that contribute most to purchase decisions. This comprehensive view enables marketers to optimize the customer experience, address conversion funnel issues, and tailor messaging to specific audience segments. Additionally, cross-channel reporting helps attribute conversions accurately, allowing marketers to evaluate campaign effectiveness and make data-driven decisions to maximize ROI.
Overall, cross-channel reporting is a valuable tool for enhancing the impact of PPC advertising campaigns. By integrating data from multiple channels, marketers can gain a holistic view of their campaigns, identify trends, optimize performance, and drive better results. This approach empowers marketers to make informed decisions, strategically allocate resources, and create personalized experiences for their target audience.
Pay-per-click (PPC) advertising has become a crucial aspect of digital marketing strategies for businesses looking to drive targeted traffic to their websites and increase conversions. With numerous platforms available to run PPC campaigns, it is essential for marketers to understand the key platforms and their unique features to make informed decisions and optimize campaign performance.
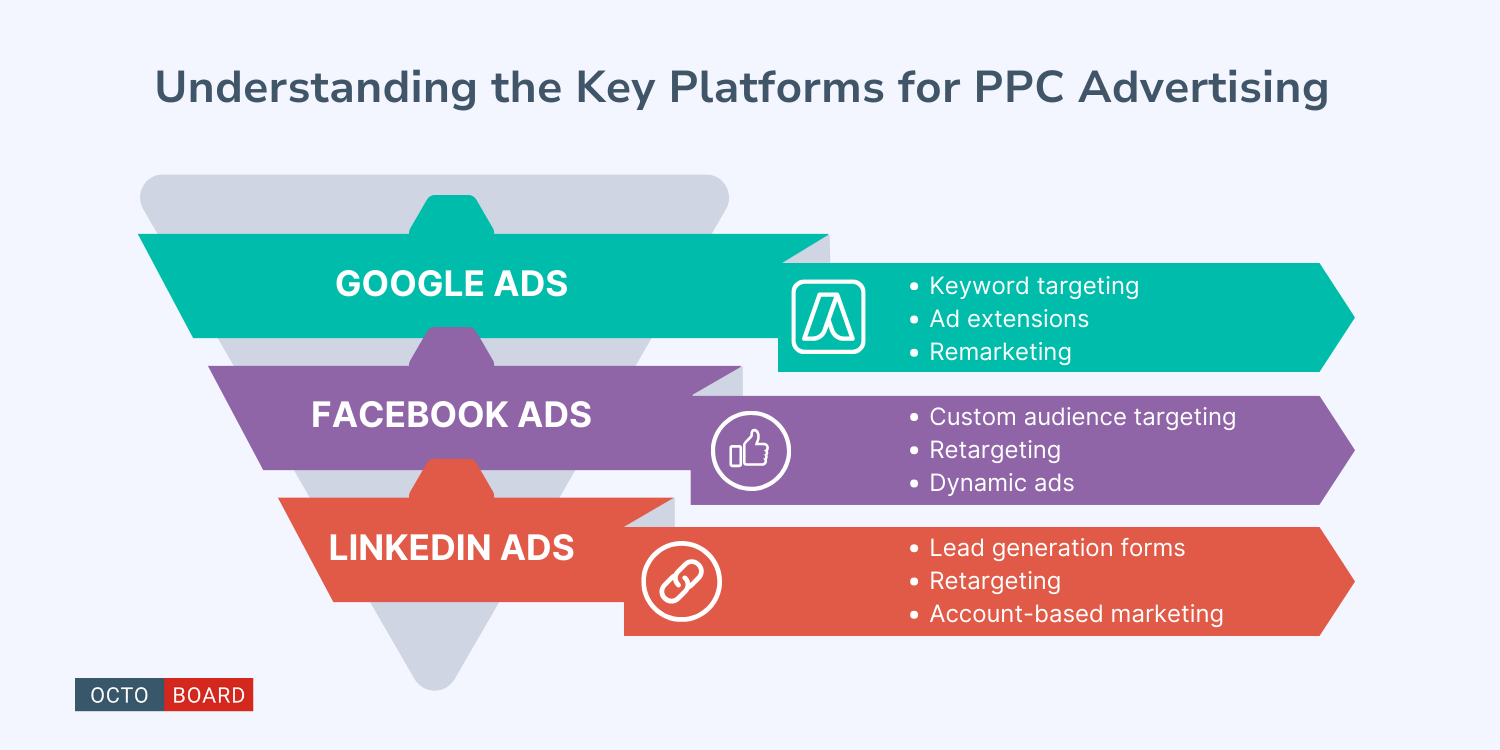
Google Ads
Google Ads, formerly known as Google AdWords, is the most popular and widely used platform for PPC advertising. It allows advertisers to create text, display, video, and shopping ads that appear on Google's search results pages and partner websites. Google Ads offers robust targeting options, including keywords, demographics, location, and devices, to help advertisers reach their target audience effectively.
Key Features:
- Keyword targeting: Advertisers can bid on specific keywords relevant to their business to trigger their ads when users search for those terms on Google.
- Ad extensions: Google Ads allows the addition of extensions like sitelinks, callouts, and call extensions to provide additional information and encourage users to take action.
- Remarketing: Advertisers can retarget website visitors with personalized ads to drive conversions and increase ROI.
Facebook Ads
With over 2.8 billion monthly active users, Facebook is a powerful platform for reaching a broad audience with targeted ads. Facebook Ads offer a variety of ad formats, such as image, video, carousel, and slideshow ads, to engage users and drive conversions. The platform's robust targeting options allow advertisers to reach specific demographics, interests, and behaviors to maximize ad performance.
Key Features:
- Custom audience targeting: Advertisers can create custom audiences based on factors like website visitors, email subscribers, and lookalike audiences to target users most likely to convert.
- Retargeting: Facebook Ads enables advertisers to retarget users who have interacted with their brand across various touchpoints, increasing the chances of conversion.
- Dynamic ads: Facebook's dynamic ads automatically show personalized product recommendations to users based on their browsing behavior, driving sales and revenue.
LinkedIn Ads
LinkedIn is the go-to platform for reaching a professional audience with targeted ads that drive leads and conversions. LinkedIn Ads offer various ad formats, including sponsored content, sponsored InMail, and text ads, to engage users and meet specific campaign objectives. The platform's targeting options enable advertisers to reach users based on job title, industry, company size, and more, making it ideal for B2B marketing.
Key Features:
- Lead generation forms: LinkedIn Ads allow advertisers to collect leads directly within the platform using pre-filled forms, streamlining the lead generation process.
- Retargeting: LinkedIn offers retargeting options to reach users who have engaged with a business's content or visited their website, increasing the chances of conversion.
- Account-based marketing: LinkedIn's account-based marketing (ABM) features enable advertisers to target specific companies or decision-makers with tailored ads that drive engagement and conversions.
Understanding the key platforms for PPC advertising is essential for marketers to effectively reach their target audience, drive conversions, and maximize ROI. By leveraging the unique features and targeting options of platforms like Google Ads, Facebook Ads, Instagram Ads, LinkedIn Ads, and Twitter Ads, businesses can create engaging and relevant ads that resonate with users and deliver measurable results.
Google Ads is a powerful platform for paid advertising, offering various targeting options and ad formats to reach specific audiences. Tracking key metrics is crucial to understand campaign performance and optimize strategies effectively.
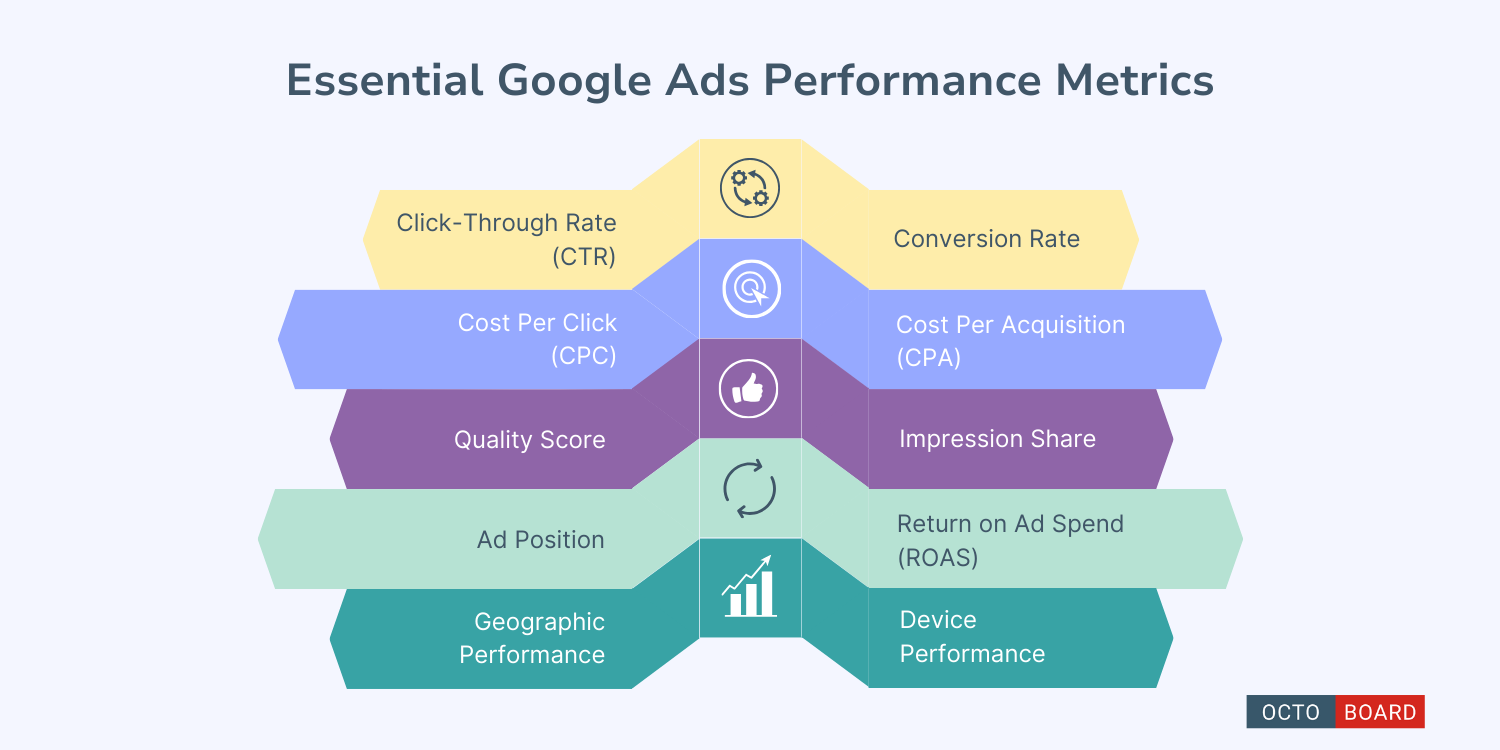
- Click-Through Rate (CTR): Percentage of users who click on your ad after seeing it. A high CTR indicates relevance and engagement.
- Conversion Rate: Percentage of users who complete a desired action after clicking on your ad.
- Cost Per Click (CPC): Average amount paid per ad click. Monitoring CPC ensures efficient budget management.
- Cost Per Acquisition (CPA): Cost to acquire a new customer or lead through ad campaigns.
- Quality Score: Google’s assessment of ad quality based on factors like relevance and expected CTR.
- Impression Share: Percentage of times your ad was shown out of total available impressions.
- Ad Position: Rank of your ad on search results. Higher positions lead to more clicks and conversions.
- Return on Ad Spend (ROAS): Revenue generated for every ad dollar spent.
- Geographic Performance: Analyze ad performance by location to target regions effectively.
- Device Performance: Monitor ad performance on different devices (desktop, mobile, tablet) to optimize campaigns for specific user behaviors.
By tracking these metrics and analyzing performance data regularly, valuable insights into the effectiveness of Google Ads campaigns can be gained to optimize advertising strategies for better results.
Tracking and analyzing key metrics is essential for maximizing the effectiveness of your Facebook Ads campaigns. By focusing on specific metrics, advertisers can make data-driven decisions to improve targeting, engagement, and overall campaign performance.
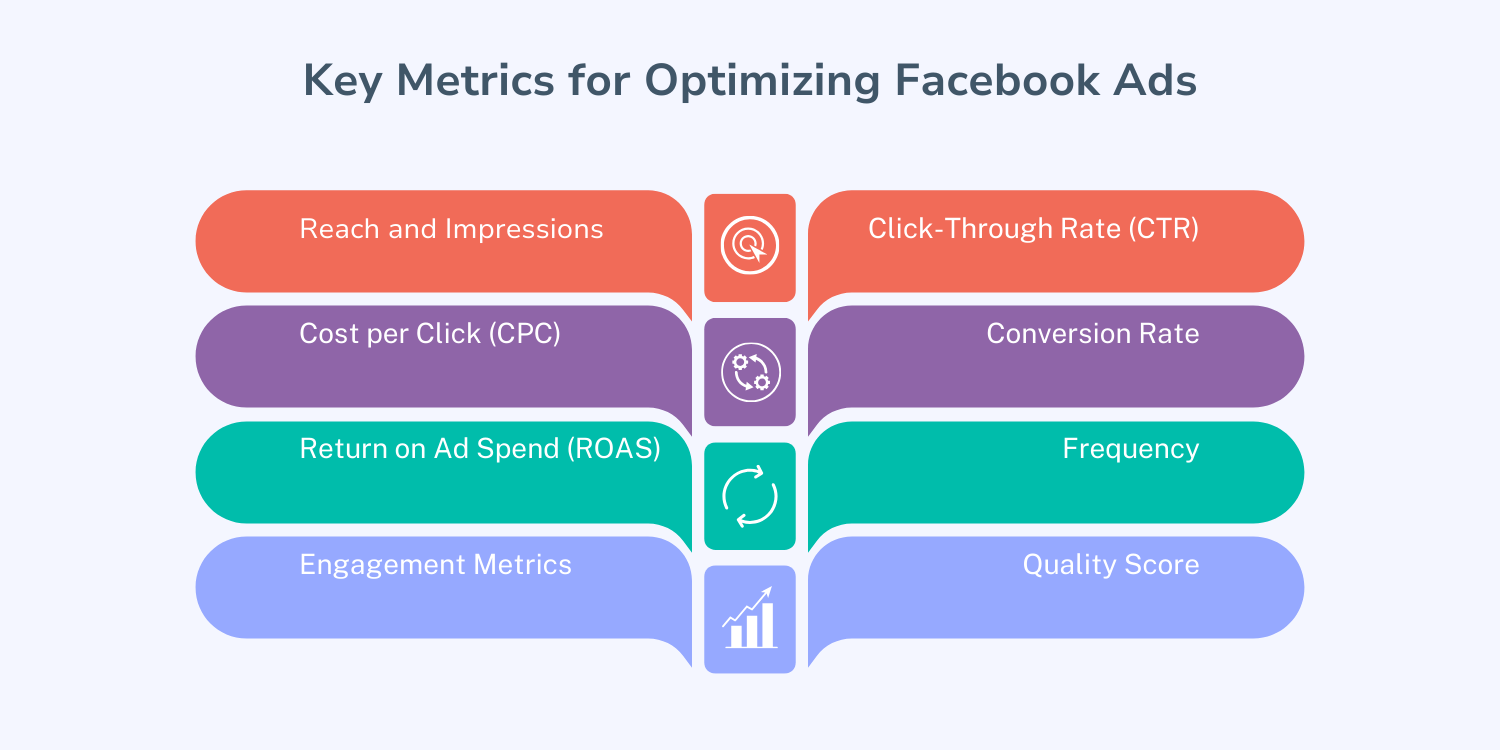
- Reach and Impressions: These metrics help gauge ad visibility and audience size. Reach measures unique users seeing the ad, while Impressions show display frequency.
- Click-Through Rate (CTR): This percentage measures user engagement by tracking ad clicks relative to impressions. Higher CTR suggests ad relevance and audience connection.
- Cost per Click (CPC): CPC indicates the cost of each click. Lower CPC implies efficient ad spend and budget optimization.
- Conversion Rate: This metric evaluates user actions post-ad click, like purchases or sign-ups. Analyzing this rate aids in understanding campaign effectiveness.
- Return on Ad Spend (ROAS): ROAS calculates revenue against ad spend to determine campaign profitability. Higher ROAS signifies positive ROI.
- Frequency: This metric shows how often an ad is displayed to the same user. Balancing frequency helps prevent ad fatigue and maintain engagement levels.
- Engagement Metrics: Likes, comments, and shares reflect ad interaction. High engagement rates boost brand visibility and customer loyalty.
- Quality Score: Facebook rates ad quality based on relevance and user experience. A higher score can lower costs and improve ad placement.
By continuously monitoring and optimizing these key metrics, advertisers can enhance ad performance, increase conversions, and maximize ROI on their Facebook Ads campaigns. Data-driven decision-making based on these metrics is crucial for achieving advertising goals and staying competitive in the digital marketing landscape.
Understanding the key metrics is crucial to track and measure TikTok ads performance. Key metrics include Click-through Rate (CTR), Impressions, Engagement Rate, Conversion Rate, Cost Per Click (CPC), and Return on Ad Spend (ROAS).
Leverage TikTok analytics tools and third-party platforms for comprehensive insights into ad performance. Analyze views, clicks, and engagement rates to understand campaign effectiveness.
Implement A/B testing to determine effective ad variations by testing different creatives, targeting options, or ad formats. Refine ad strategies based on test results to drive better performance.
Track conversions and ROI to measure campaign effectiveness. Set up conversion tracking to attribute actions to specific ads and identify high-performing ads driving valuable actions like purchases or sign-ups.
By optimizing TikTok ads campaigns with analytics, businesses can reach their target audience more effectively, refine targeting and creative strategies, and maximize ROI. Through data-driven decisions and continuous optimization, advertisers can harness the power of TikTok advertising to engage with an active audience and achieve advertising goals.
Tracking performance on Snapchat is crucial to understanding the effectiveness of your ad campaigns. By analyzing key metrics such as impressions, swipe up rate, conversion rate, click-through rate, cost-per-click, return on ad spend, audience demographics, app installs, and downloads, advertisers can make data-driven decisions to optimize their ad spend effectively.
Impressions measure how many times your ad is displayed, providing insights into the reach of your ad. The swipe up rate indicates user engagement, with a higher rate showing a stronger connection with the audience. Conversion rate determines the percentage of users taking a desired action, like making a purchase or signing up, after seeing the ad. Click-through rate reflects the percentage of users clicking on the ad, indicating relevance and engagement.
Cost-per-click helps evaluate the value of each click, while return on ad spend measures revenue generated compared to ad expenses. Knowing audience demographics allows for tailoring ads to specific target markets, improving personalization and relevance. Tracking app installs and downloads is vital for campaigns aimed at increasing app engagement.
Utilizing Snapchat Ads Manager can provide detailed insights into ad performance, audience engagement, and campaign metrics in real-time. By leveraging these analytics tools, advertisers can monitor and optimize their campaigns effectively.
Monitoring key performance metrics on Snapchat is essential for maximizing ad spend efficiency and reaching advertising goals. Analyzing data and making informed decisions based on these insights can significantly improve ad campaign performance and drive better results on the platform.
Criteo offers valuable metrics for enhancing retargeting campaigns. One key metric is the click-through rate (CTR), indicating ad engagement. Monitoring CTR helps in optimizing ad creatives and audience targeting. Another important metric is the conversion rate, measuring the percentage of users taking desired actions. By analyzing conversion rates, advertisers can identify effective ad creatives and audience segments for better campaign performance.
Return on ad spend (ROAS) is crucial for assessing campaign profitability. Calculating ROAS helps in determining the effectiveness of retargeting strategies. Evaluating the cost per acquisition (CPA) is essential for understanding the efficiency of acquiring new customers through advertising. Lowering the CPA through optimization can drive higher profits.
Criteo also provides insights on audience behavior with engagement rate and time on site metrics. Understanding user interactions with ads and websites helps in tailoring retargeting campaigns to meet user expectations. Analyzing engagement data allows for optimizing ad creatives and targeting criteria to enhance campaign performance.
To maximize retargeting effectiveness, advertisers should regularly analyze key metrics and test different strategies. By refining ad creatives, audience targeting, and optimization tactics, better results can be achieved. Leveraging Criteo metrics for retargeting success requires a data-driven approach and continual optimization to improve campaign performance and ROI.
Check out these Octoboard platform features can be used to build PPC reports:
In the world of digital advertising, businesses often utilize multiple platforms to reach their target audience and drive conversions. From Google Ads to Facebook, TikTok, Snapchat, and Criteo, each platform offers unique targeting options and ad formats to help advertisers achieve their marketing goals. However, one of the biggest challenges that advertisers face when running campaigns across multiple platforms is the inconsistency in metrics and reporting.
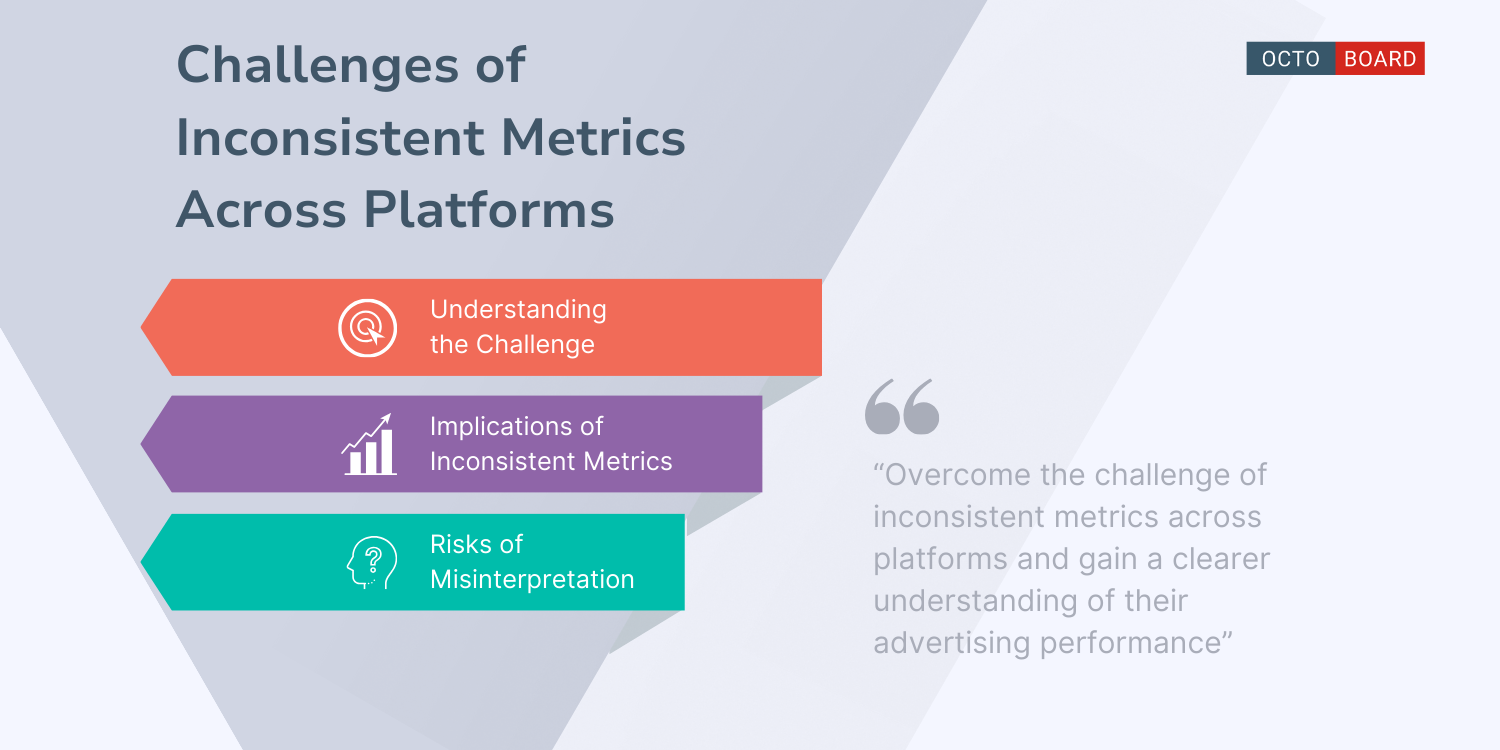
Understanding the Challenge
Each advertising platform has its own set of metrics and terminology to measure advertising performance. For example, Google Ads uses metrics like Click-Through Rate (CTR), Average Cost-Per-Click (CPC), and Conversion Rate, while Facebook Ads commonly track metrics such as Cost-Per-Result, Relevance Score, and Cost-Per-Click (CPC). This disparity in metrics can make it difficult for advertisers to compare performance accurately across platforms and make informed decisions about where to allocate their budget for the best results.
Implications of Inconsistent Metrics
The inconsistency in metrics across platforms can lead to confusion and a lack of clarity when analyzing the overall performance of advertising campaigns. Without a standardized way to measure and track key performance indicators, advertisers may struggle to identify which campaigns are most effective in driving conversions and which ones need optimization.
Furthermore, inconsistent metrics can also make it challenging to create unified reports that provide a holistic view of advertising performance. Advertisers may spend valuable time manually aggregating data from multiple platforms and trying to reconcile differences in terminology and measurement methods, rather than focusing on optimizing their campaigns for better results.
Risks of Misinterpretation
Misinterpretation of metrics due to inconsistency across platforms can have serious consequences for advertisers. For instance, if one platform reports higher engagement rates than another, advertisers may mistakenly allocate more budget to the underperforming platform, leading to wasted ad spend and missed opportunities for growth.
Moreover, inaccurate or misleading metrics can also impact decision-making processes and strategic planning. Advertisers rely on data to make informed decisions about ad creatives, targeting options, and budget allocation. If the data from different platforms are not consistent or reliable, advertisers may end up making decisions based on flawed information, resulting in suboptimal campaign performance.
Overcoming the Challenge
To address the challenge of inconsistent metrics across platforms, advertisers can take several proactive steps to ensure that they are accurately measuring and evaluating the performance of their advertising campaigns:
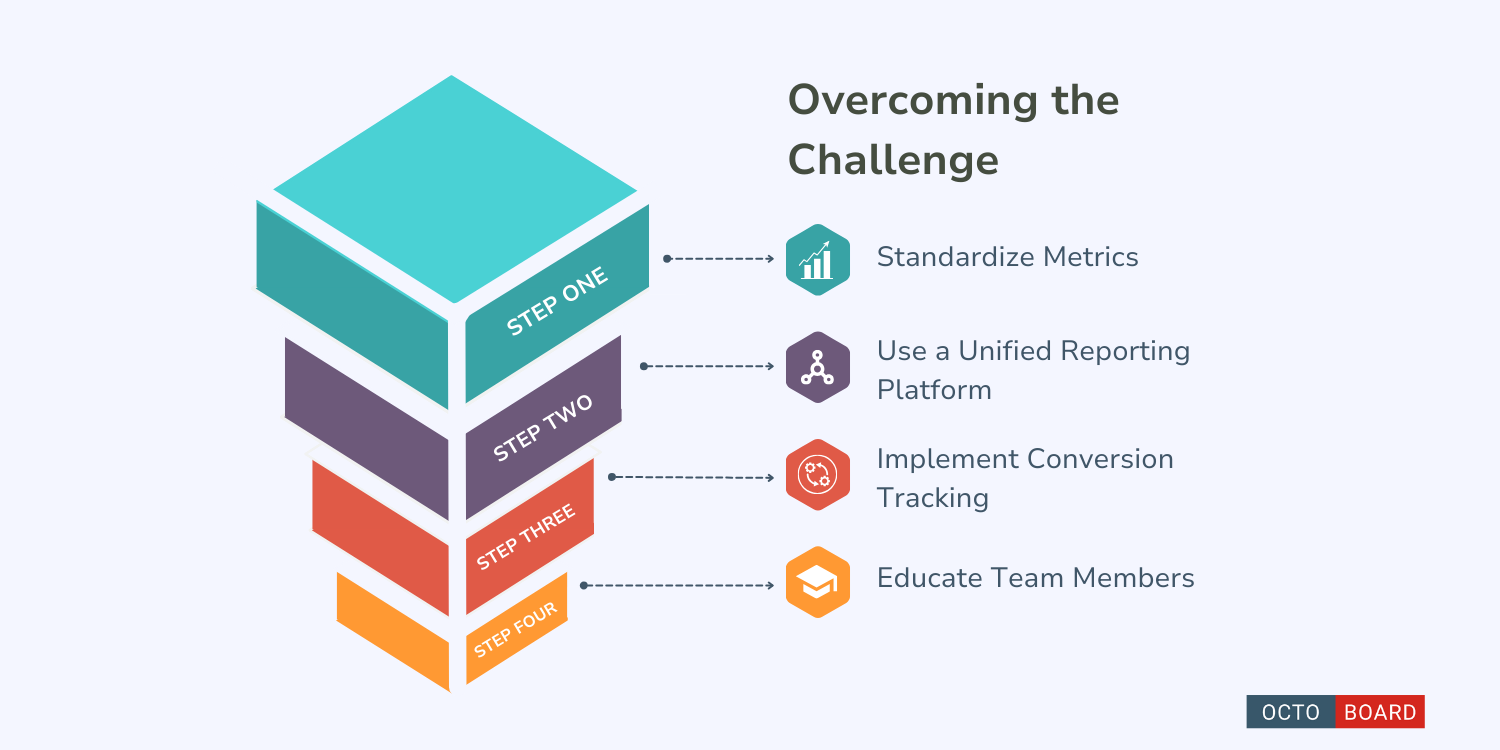
- Standardize Metrics: Establish a set of standardized metrics that are consistent across all advertising platforms to facilitate easier comparison and analysis of performance data.
- Use a Unified Reporting Platform: Invest in a cross-channel reporting tool that can aggregate data from multiple platforms and present it in a unified dashboard for easy analysis and decision-making.
- Implement Conversion Tracking: Set up conversion tracking on all advertising platforms to accurately measure and attribute conversions back to specific campaigns, ads, and keywords.
- Educate Team Members: Provide training and resources to team members responsible for analyzing advertising performance to ensure they understand how metrics are measured and reported across different platforms.
By taking these steps, advertisers can overcome the challenge of inconsistent metrics across platforms and gain a clearer understanding of their advertising performance to make strategic decisions that drive results.
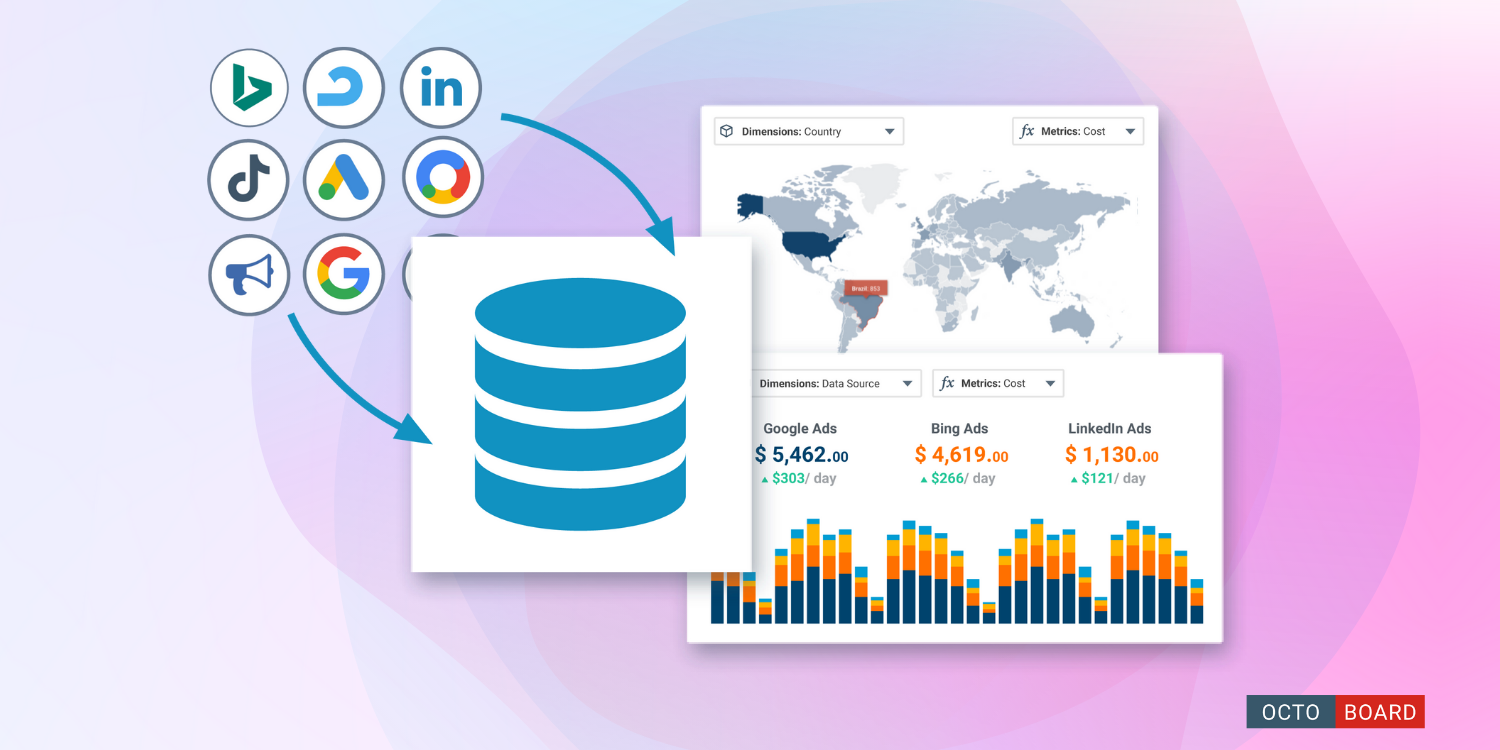
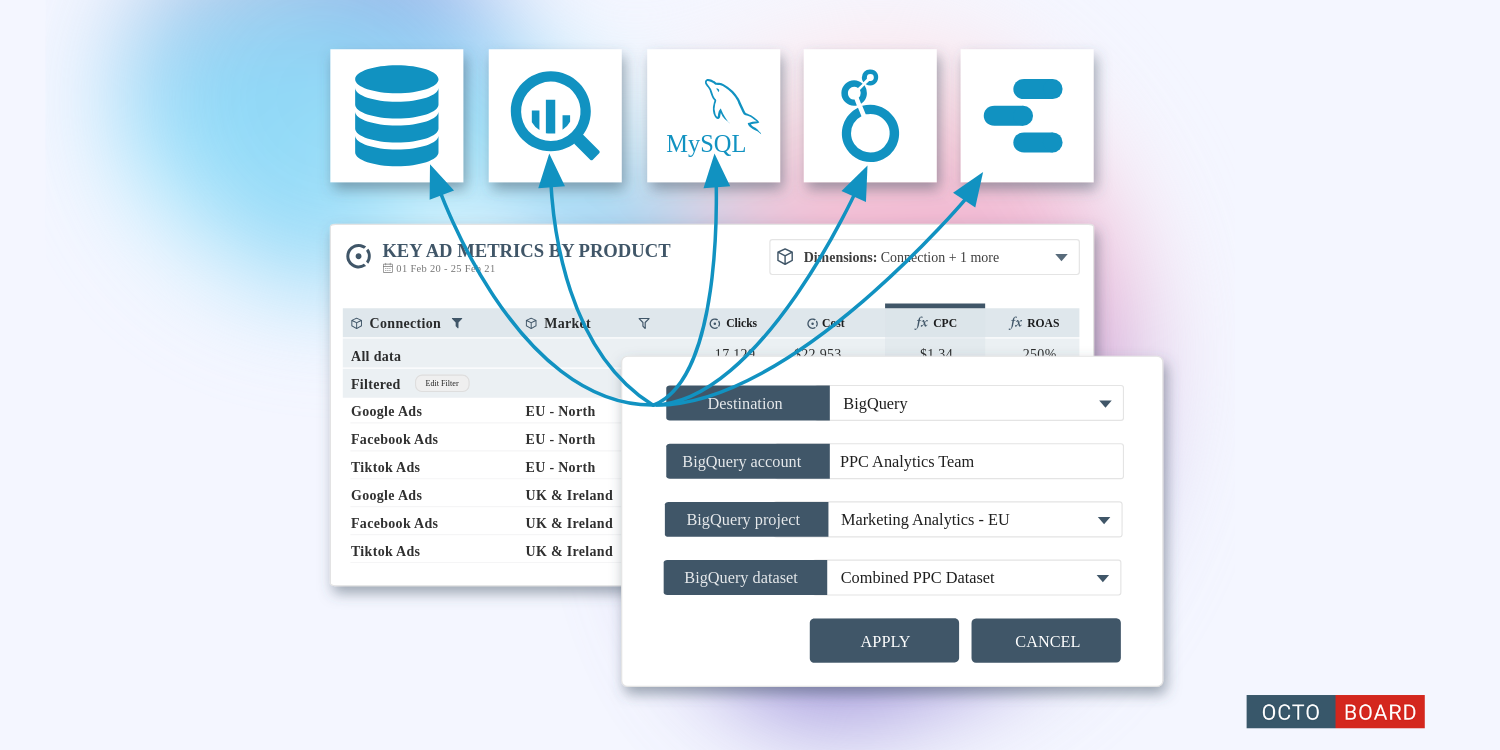
Octoboard automatically retrieves records from multiple PPC systems, normalises data and builds cross-channel PPC Analytics reports. For more details, visit this Octoboard product page that covers multi-channel PPC reports.
In digital marketing, having accurate data is essential for informed decision-making. However, the inconsistency in reporting metrics across different advertising platforms poses a challenge for marketers. Varying terminology and metrics make it hard to compare campaign performance accurately. The lack of uniformity leads to confusion and can impact the effectiveness of marketing strategies.
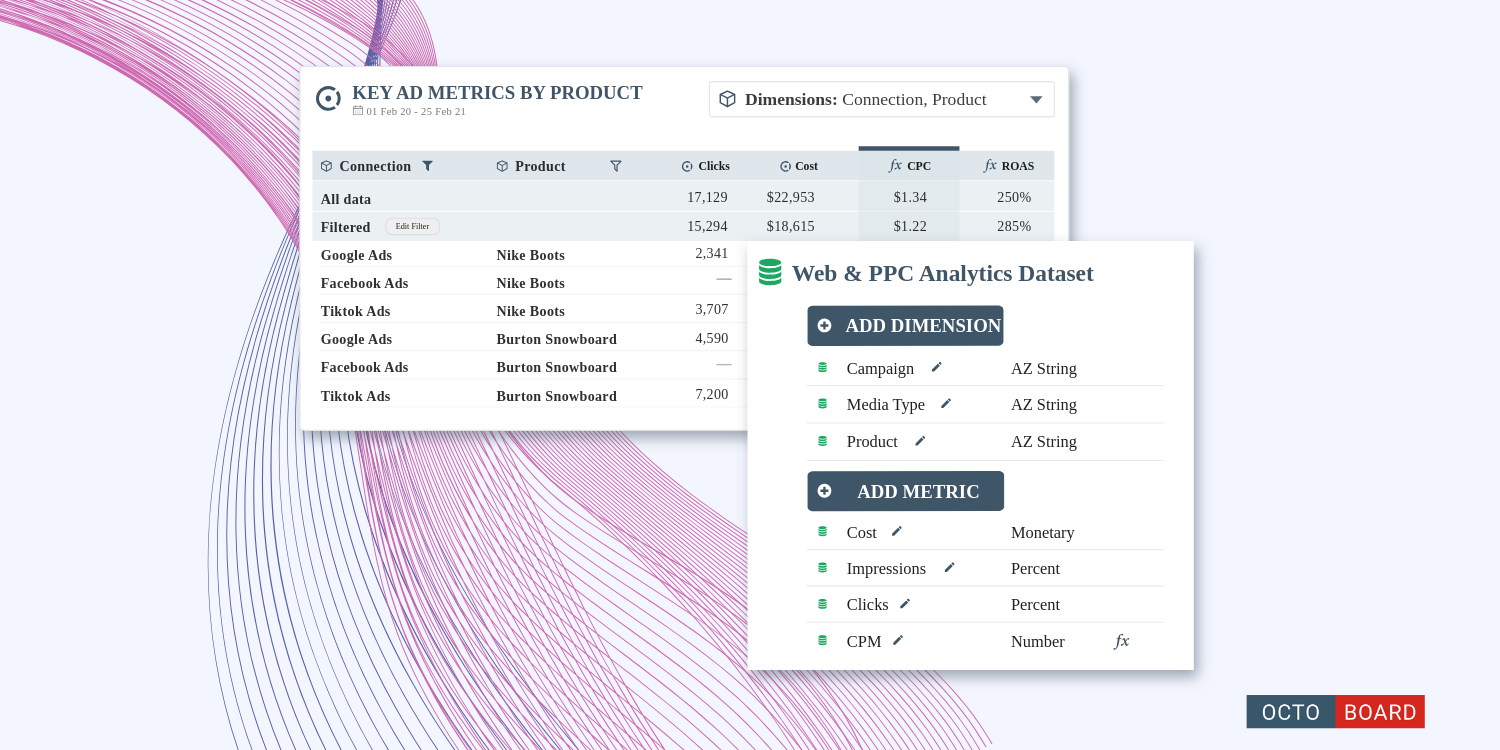
Uniform and normalized reports standardize metrics across platforms. This alignment allows for easier comparison of key performance indicators like Clicks, Impressions, Conversions, and Costs. By translating and mapping metrics from various platforms to a common set of KPIs, marketers can streamline the analysis process and gain a cohesive view of campaign performance.
Creating uniform reports involves aligning comparable metrics from different platforms. Normalizing data helps eliminate discrepancies caused by variations in data collection methods and attribution models. This process ensures data accuracy and enables marketers to make data-driven decisions based on reliable and consistent information.
Uniform and normalized reports provide a comprehensive understanding of overall advertising efforts. By consolidating data from multiple channels into a single report, marketers can easily track performance, identify trends, and optimize campaigns effectively. These reports also facilitate collaboration and communication among team members and stakeholders by presenting a clear view of campaign performance.
The importance of uniform and normalized reports in PPC advertising analytics cannot be overstated. By standardizing metrics and normalizing data from various sources, marketers can overcome the challenges of inconsistent reporting and achieve a unified view of campaign performance that drives success in digital advertising.
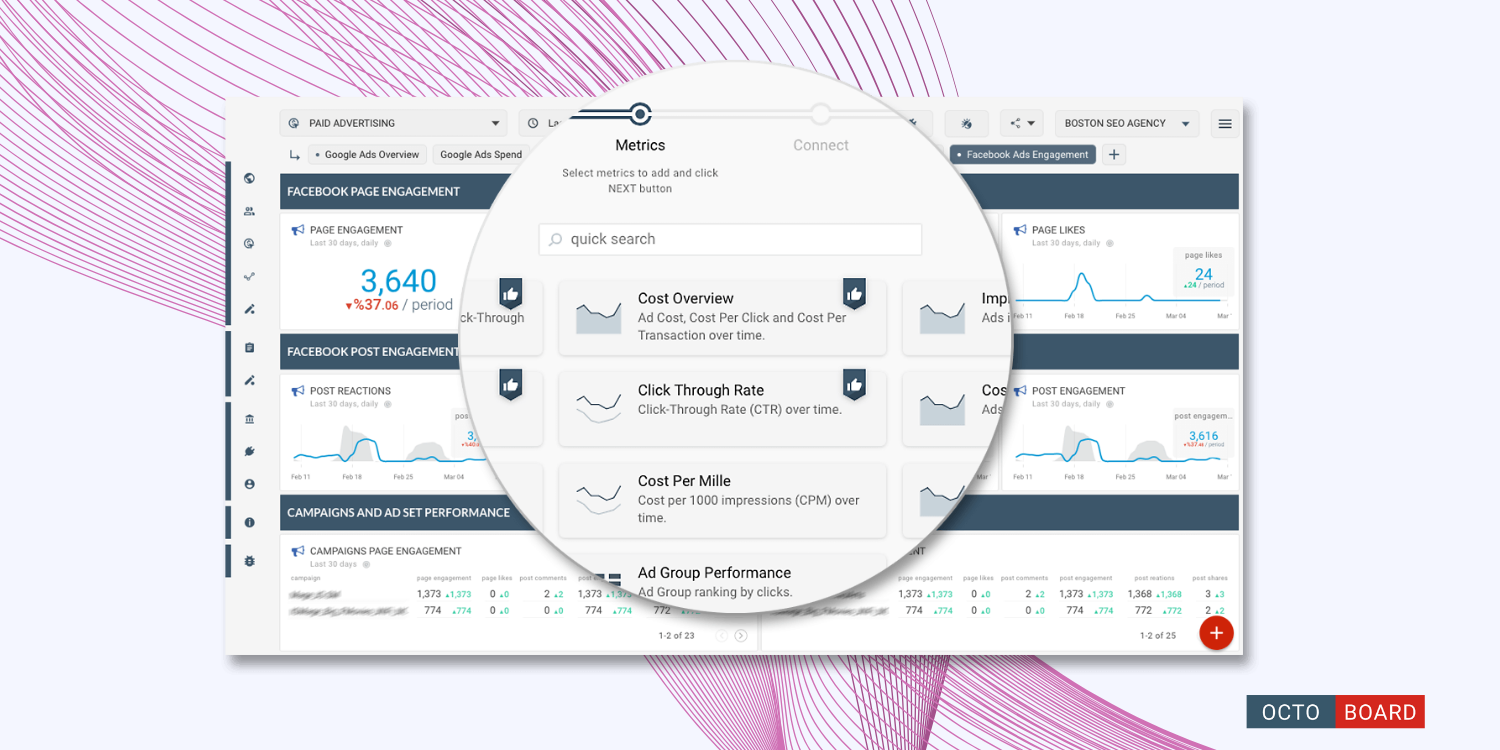
A unified dashboard consolidates data from multiple PPC advertising platforms for a comprehensive view of your campaigns. It helps in optimizing strategies and making informed decisions. By integrating data from various channels, marketers can compare key metrics, track campaign performance, and allocate budgets effectively for maximizing ROI.
Steps to Create a Unified Dashboard:
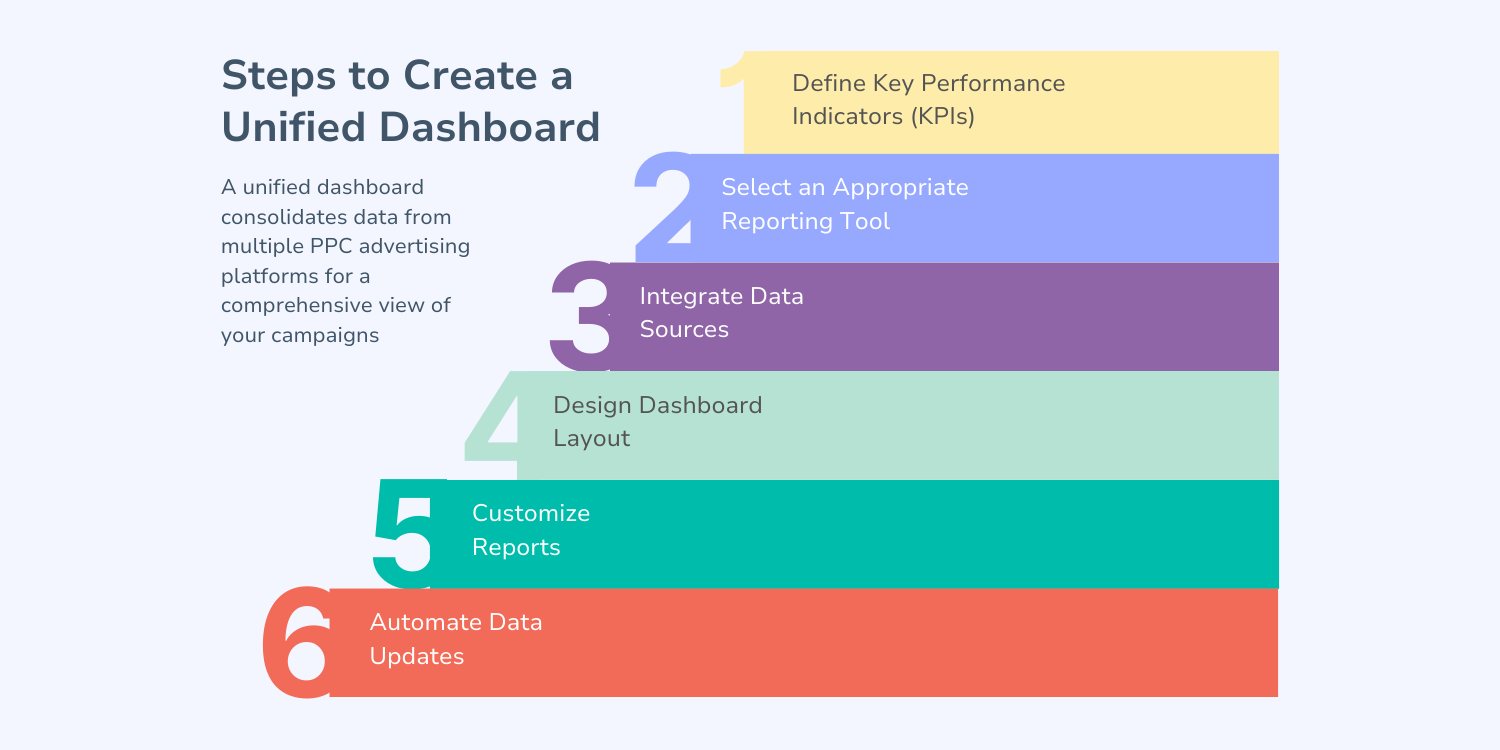
- Define Key Performance Indicators (KPIs): Identify essential metrics aligned with your goals like CTR, conversion rate, CPA, and ROAS to measure campaign success effectively.
- Select an Appropriate Reporting Tool: Choose a user-friendly tool providing integration with multiple advertising platforms and offering robust visualization options.
- Integrate Data Sources: Connect your PPC accounts from different platforms to the reporting tool to pull in data automatically using APIs or direct integrations.
- Design Dashboard Layout: Arrange KPIs, metrics, and visualizations logically using charts, graphs, and tables for easy interpretation.
- Customize Reports: Tailor reports with custom widgets, filters, and segmentation to analyze data by dimensions like campaign, ad group, and audience segment.
- Automate Data Updates: Set up automated data refresh schedules to keep your dashboard up-to-date. Regularly monitor data accuracy to avoid reporting errors.
Best Practices for Unified Dashboard Reporting:
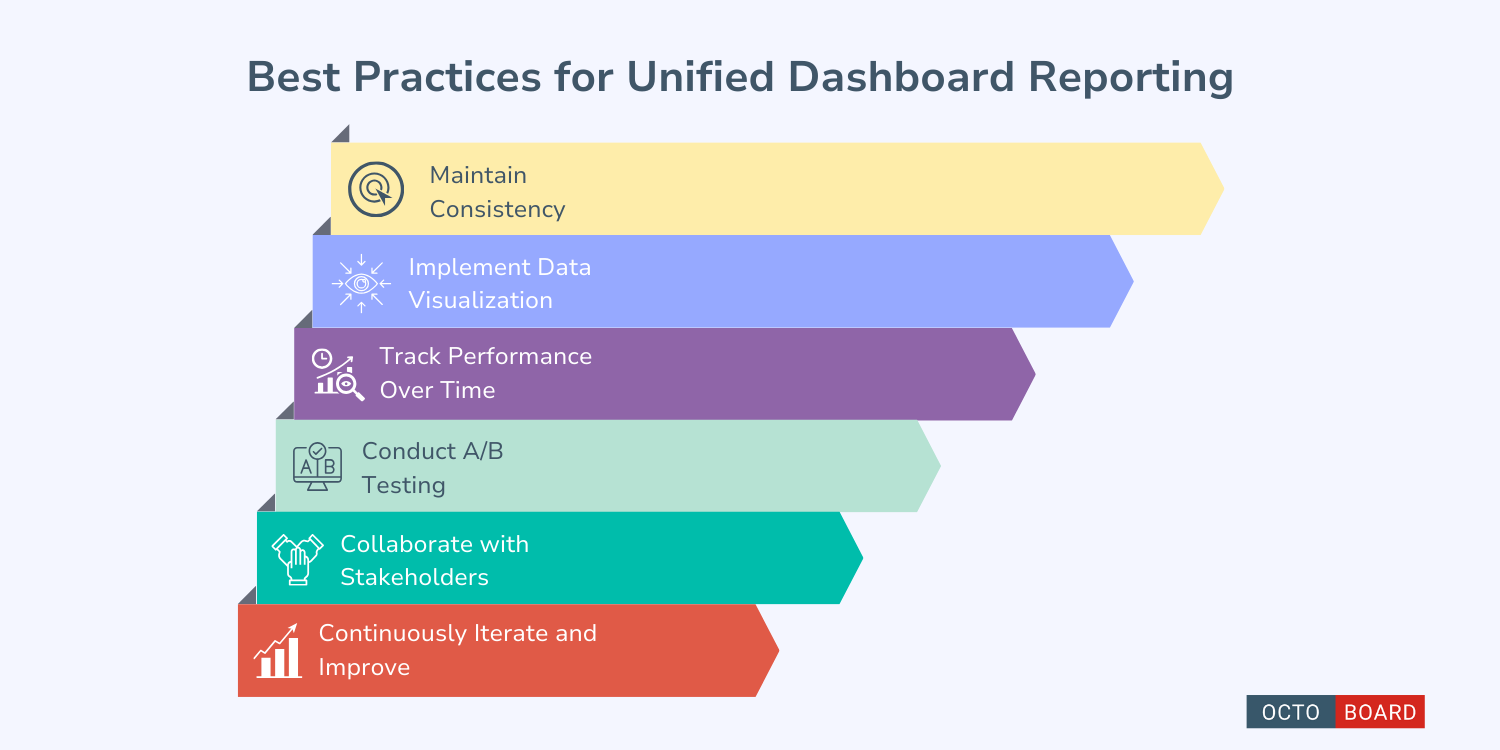
- Maintain Consistency: Use consistent naming conventions, metrics, and data formats across all channels.
- Implement Data Visualization: Utilize charts and graphs to present data in a visually engaging and easily comprehensible manner.
- Track Performance Over Time: Monitor changes in metrics to identify trends and areas for improvement.
- Conduct A/B Testing: Test different strategies across channels to optimize campaigns effectively.
- Collaborate with Stakeholders: Share dashboards for transparency and alignment on advertising goals.
- Continuously Iterate and Improve: Regularly review metrics, analyze campaign impact, and refine strategies based on data-driven insights.
Implementing a unified dashboard for cross-channel PPC analytics can transform your advertising strategy, optimize campaigns effectively, and drive better results across various platforms. Leveraging data-driven decision-making and unified reporting tools can propel your business towards success in the digital landscape.
Tracking key metrics is essential for effective performance tracking in PPC advertising campaigns. By monitoring the right metrics, marketers can gain valuable insights into the success of their campaigns, identify areas for improvement, and make data-driven decisions to optimize performance and drive better results. In this article, we will explore the key metrics that are crucial for accurate performance tracking in PPC advertising.
Click-Through Rate (CTR)
Click-Through Rate (CTR) measures the percentage of people who clicked on your ad after seeing it. A high CTR indicates that your ad is relevant and engaging to your target audience. Monitoring CTR can help you assess the effectiveness of your ad copy, creative, and targeting strategies. A low CTR may indicate that your ad is not resonating with your audience, prompting you to make adjustments to improve performance.
Conversion Rate
Conversion Rate is the percentage of clicks that result in a desired action, such as a purchase, sign-up, or download. Monitoring conversion rate is crucial for measuring the effectiveness of your campaigns in achieving your marketing objectives. A high conversion rate indicates that your ads are driving valuable actions, while a low conversion rate may signal that there are issues with your landing page, offer, or targeting.
Cost Per Click (CPC)
Cost Per Click (CPC) is the amount you pay each time someone clicks on your ad. Monitoring CPC is important for assessing the efficiency of your ad spend and budget allocation. A low CPC indicates that you are getting good value for your advertising budget, while a high CPC may require you to optimize your bidding strategy or target more cost-effective keywords.
Return on Ad Spend (ROAS)
Return on Ad Spend (ROAS) measures the revenue generated for every dollar spent on advertising. Calculating ROAS can help you evaluate the profitability of your campaigns and make informed decisions about where to allocate your budget for maximum impact. A high ROAS indicates that your campaigns are generating a strong return on investment, while a low ROAS may prompt you to refine your targeting or creative to improve performance.
Quality Score
Quality Score is a metric used by platforms like Google Ads to evaluate the relevance and quality of your ads, keywords, and landing pages. A high Quality Score can lead to lower CPCs and higher ad placements, ultimately driving better performance and ROI. Monitoring Quality Score can help you identify areas for optimization and improve the overall effectiveness of your campaigns.
Impressions
Impressions represent the number of times your ads have been displayed to users. Monitoring impressions can help you gauge the reach and visibility of your campaigns and track changes in ad exposure over time. Increasing impressions may indicate that your targeting is working well, while a decline in impressions could signal issues with your bidding strategy or ad relevance.
Cost Per Acquisition (CPA)
Cost Per Acquisition (CPA) measures the average cost of acquiring a customer through your advertising efforts. Monitoring CPA is crucial for assessing the efficiency of your campaigns in driving valuable actions and generating revenue. A low CPA indicates that you are acquiring customers at a reasonable cost, while a high CPA may require you to refine your targeting or messaging to improve performance.
Ad Position
Ad Position refers to the placement of your ads on the search engine results page or website. Monitoring ad position can help you assess the visibility and competitiveness of your campaigns, as ads in higher positions tend to receive more clicks and visibility. Optimizing ad position can enhance performance and increase the likelihood of attracting qualified leads and conversions.
Cost Per Conversion
Cost Per Conversion measures the average cost of generating a desired action, such as a lead or sale, through your advertising campaigns. Monitoring cost per conversion is crucial for evaluating the efficiency of your marketing efforts and identifying opportunities to improve performance and ROI. A low cost per conversion indicates that your campaigns are generating results at a cost-effective rate, while a high cost per conversion may signal the need for optimization.
Ad Clicks
Ad Clicks represent the total number of clicks your ads have received. Monitoring ad clicks can help you assess the engagement and interaction with your ads, as well as track changes in user behavior and interest. Increasing ad clicks may indicate that your ad copy and creative are resonating with your audience, while a decline in ad clicks could signal the need for adjustments to improve performance.
Tracking key metrics is essential for accurate performance tracking in PPC advertising campaigns. By monitoring metrics such as CTR, conversion rate, CPC, ROAS, Quality Score, impressions, CPA, ad position, cost per conversion, and ad clicks, marketers can gain valuable insights into the effectiveness of their campaigns, identify areas for improvement, and make data-driven decisions to optimize performance and drive better results. By leveraging these key metrics, marketers can refine their strategies, allocate budget efficiently, and achieve their marketing objectives with greater precision and success.
Tracking conversions in PPC campaigns is key for measuring effectiveness and optimizing performance. It helps advertisers understand which ads drive valuable actions and where to allocate resources for maximum impact. By analyzing conversion data, advertisers can make informed adjustments to their campaigns to increase conversion rates.
Importance of Conversion Tracking
Conversion tracking is essential in PPC advertising to gauge the ROI of campaigns accurately. Without it, advertisers struggle to identify high-performing ads and make data-driven decisions. By tracking conversions, advertisers can optimize campaigns for specific outcomes and tweak elements like ad copy, targeting parameters, and landing pages to drive more valuable actions.
Implementation Methods
The implementation of conversion tracking varies based on the advertising platform. Google Ads requires adding a tracking code to websites or utilizing Google Tag Manager. Facebook Ads provide the Facebook Pixel tool to track actions such as purchases and sign-ups. LinkedIn and Twitter also offer conversion tracking tools that allow advertisers to monitor actions taken on their websites after users interact with their ads.
Benefits for Advertisers
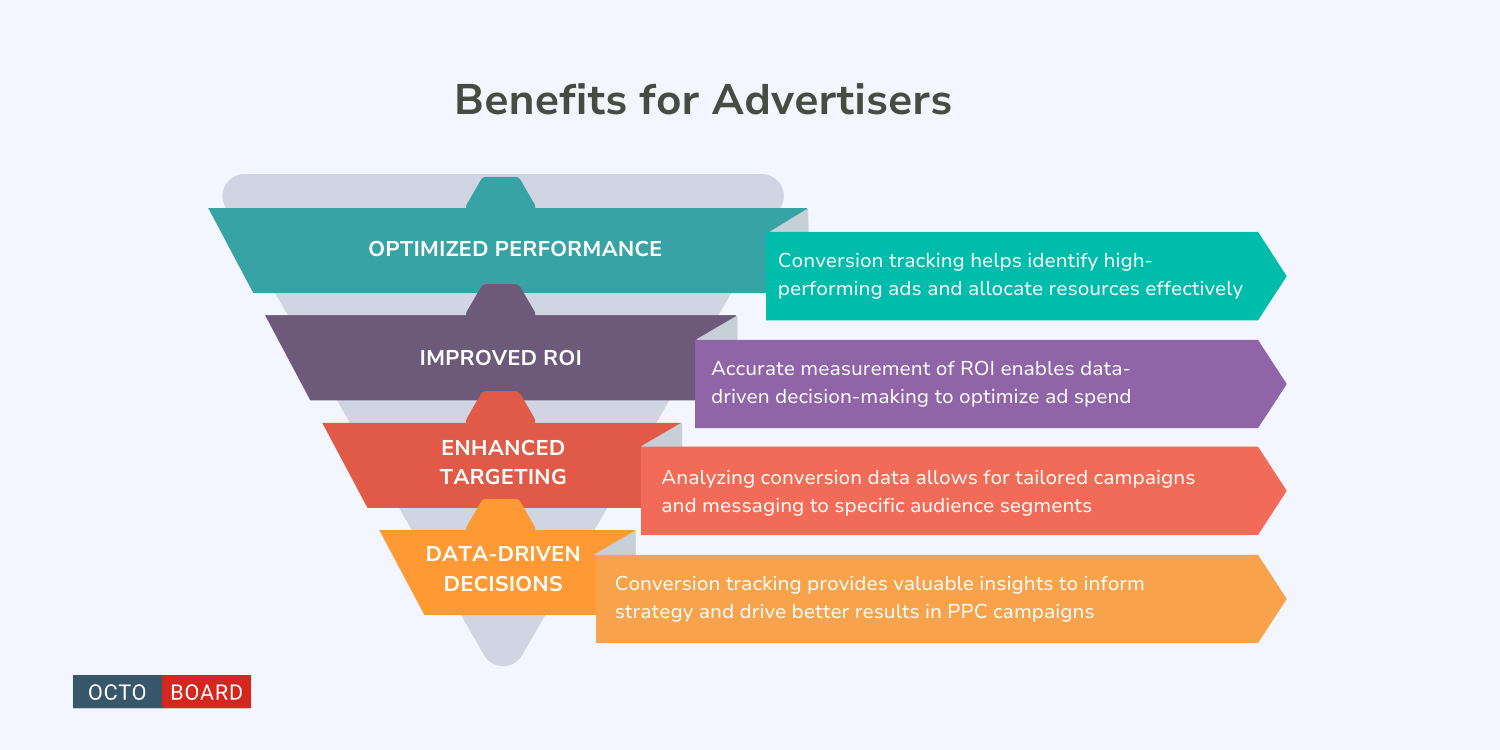
- Optimized Performance: Conversion tracking helps identify high-performing ads and allocate resources effectively.
- Improved ROI: Accurate measurement of ROI enables data-driven decision-making to optimize ad spend.
- Enhanced Targeting: Analyzing conversion data allows for tailored campaigns and messaging to specific audience segments.
- Data-Driven Decisions: Conversion tracking provides valuable insights to inform strategy and drive better results in PPC campaigns.
By implementing conversion tracking, advertisers can measure the impact of their ads, identify areas for improvement, and make informed decisions to drive valuable actions from their target audience. It enables them to maximize ROI, enhance targeting, and achieve better results in their advertising efforts.
Establish clear objectives for your PPC reports and choose relevant metrics aligned with your goals. Customize reports for different stakeholders by tailoring visualizations and level of detail. Provide insights and analysis along with raw data to help stakeholders understand performance. Compare current data with historical or industry benchmarks to track progress and identify areas for improvement.
Break down data into segments to gain granular insights into campaign performance. Automate reporting processes to save time, reduce errors, and ensure consistent delivery. Continuously monitor performance, track KPIs, and make real-time adjustments to optimize results.
Experiment with different reporting formats, visuals, and metrics to find what resonates best with your audience. Test and iterate reporting strategies based on feedback to create more effective and actionable reports. By following these best practices, marketers can drive better results and ROI from their PPC advertising efforts.
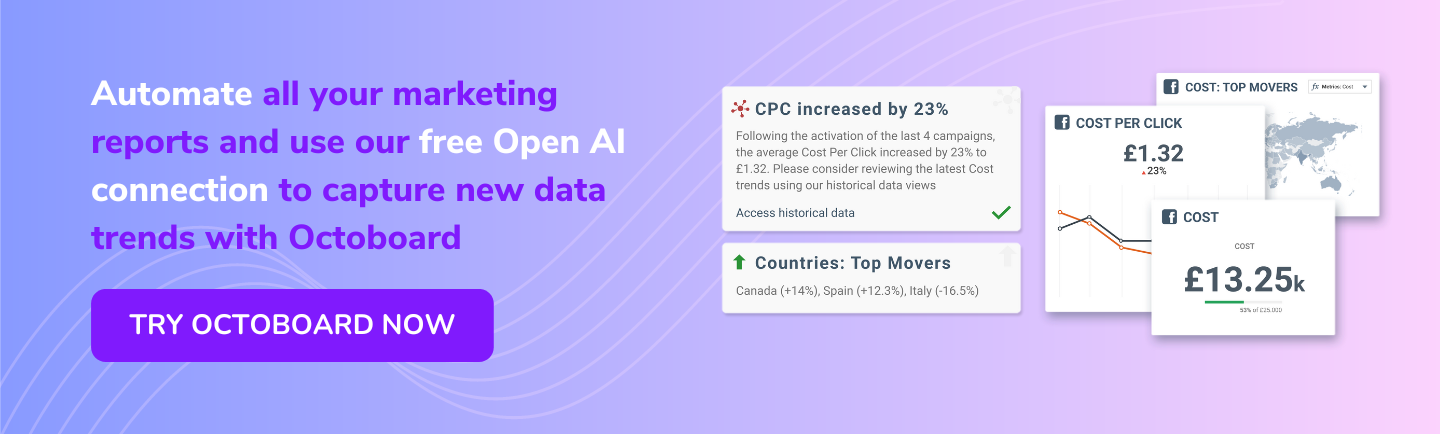
Automation and AI are reshaping PPC advertising analytics. AI tools analyze data, enabling quick decisions. Predictive analytics forecasts trends, aiding proactive adjustments for optimized campaigns. Multi-touch attribution models provide a holistic view of the customer journey. Cross-device and cross-platform tracking ensure accurate campaign measurement. Personalized ad experiences drive engagement and conversions. Enhanced data visualization tools present insights effectively. Compliance with privacy regulations is essential for data protection. Embracing these trends enhances campaign success in a competitive digital marketing landscape.
Octoboard offers ChatGPT-based trend generation features. Connect your data to Octoboard and let our AI modules analyze data “on-the-fly”, identify new trends and send AI generated insights to your email box or Slack channel retrieves records from multiple PPC systems, normalises data and builds cross-channel PPC Analytics reports. For more details, visit this Octoboard product page that covers multi-channel PPC reports.