Top mistakes to avoid when creating data dashboards

Top mistakes to avoid when creating data dashboards
In today’s data-driven world, thousands of businesses are using dashboards to manage metrics and KPIs. A data dashboard helps these companies make sense of the enormous quantity of information and turn it into actionable insights.
Metrics dashboards are powerful tools when used correctly. They save time, improve business processes and enables to quickly spot trends and issues. But sometimes, dashboards are used improperly. The mistakes that businesses make when building them seriously limit their effectiveness.
The following are 8 top mistakes commonly made by businesses compiled by Octoboard customer success team.
The presentation of the metrics should be as simple as possible so that it’s clear what it’s telling you. It should not leave any room for interpretation as to what’s happening. Organizations are generating huge amounts of data, but trying to monitor every KPI results in data overload. Too much data and non-essential or unrelated metrics make a dashboard confusing and ineffective. That’s why the first step to creating an effective data dashboard is to determine issues you are trying to solve, or what are you trying to accomplish by using a dashboard. For this it would be wise to divide all your dashboards into three categories:
Strategic Dashboards - they help business leaders monitor company progress towards goals.
Operational dashboards - they are used at the departmental level, they monitor day-to-day operations, help managers catch problems as they occur.
Analytical dashboards - they provide insights into data collected over time.
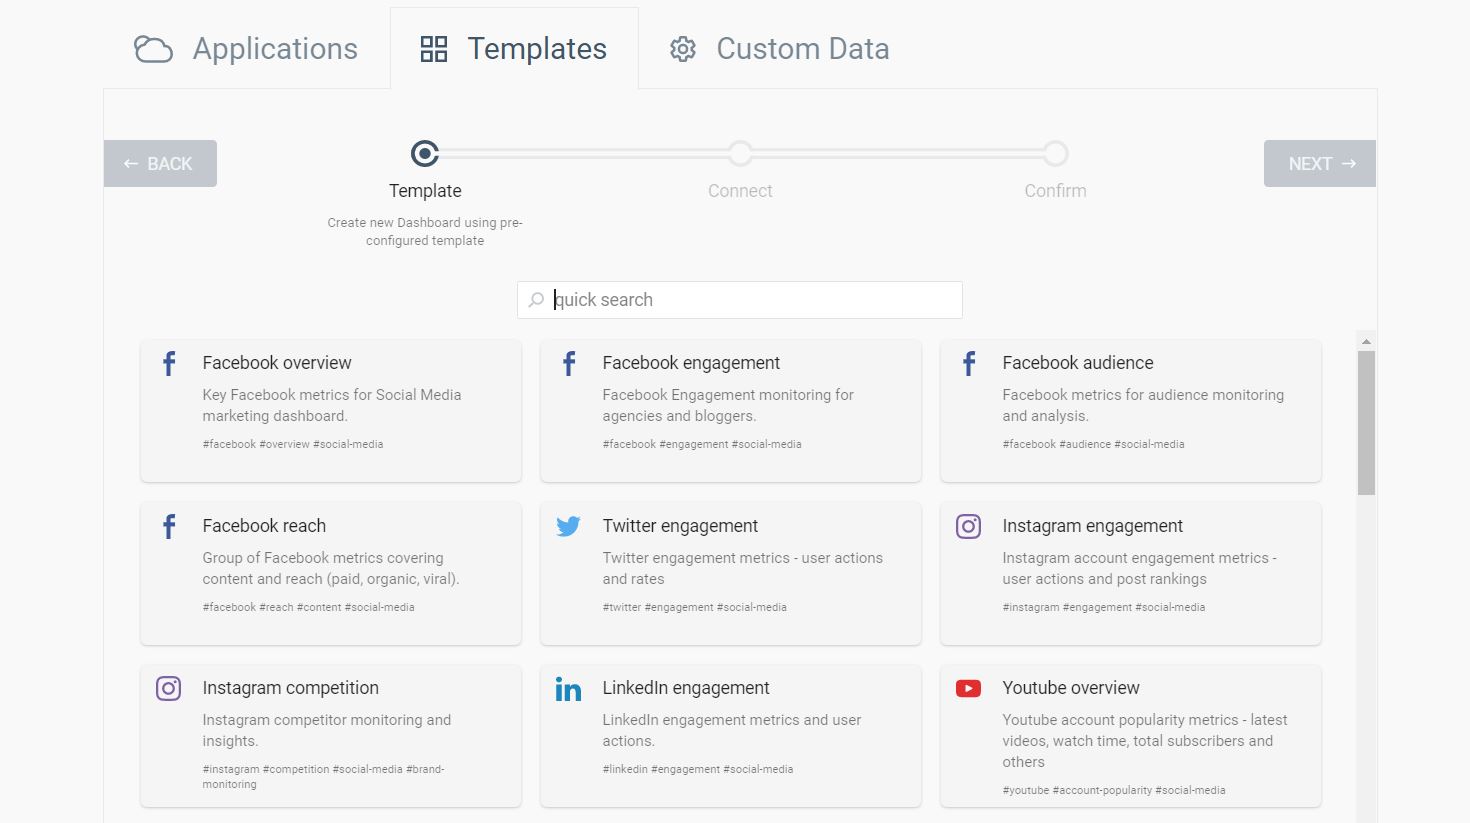
Define the exact purpose of your dashboard and include suitable metrics, do not overload it. Start small with our ready-made templates where the most important metrics are already grouped for your convenience.
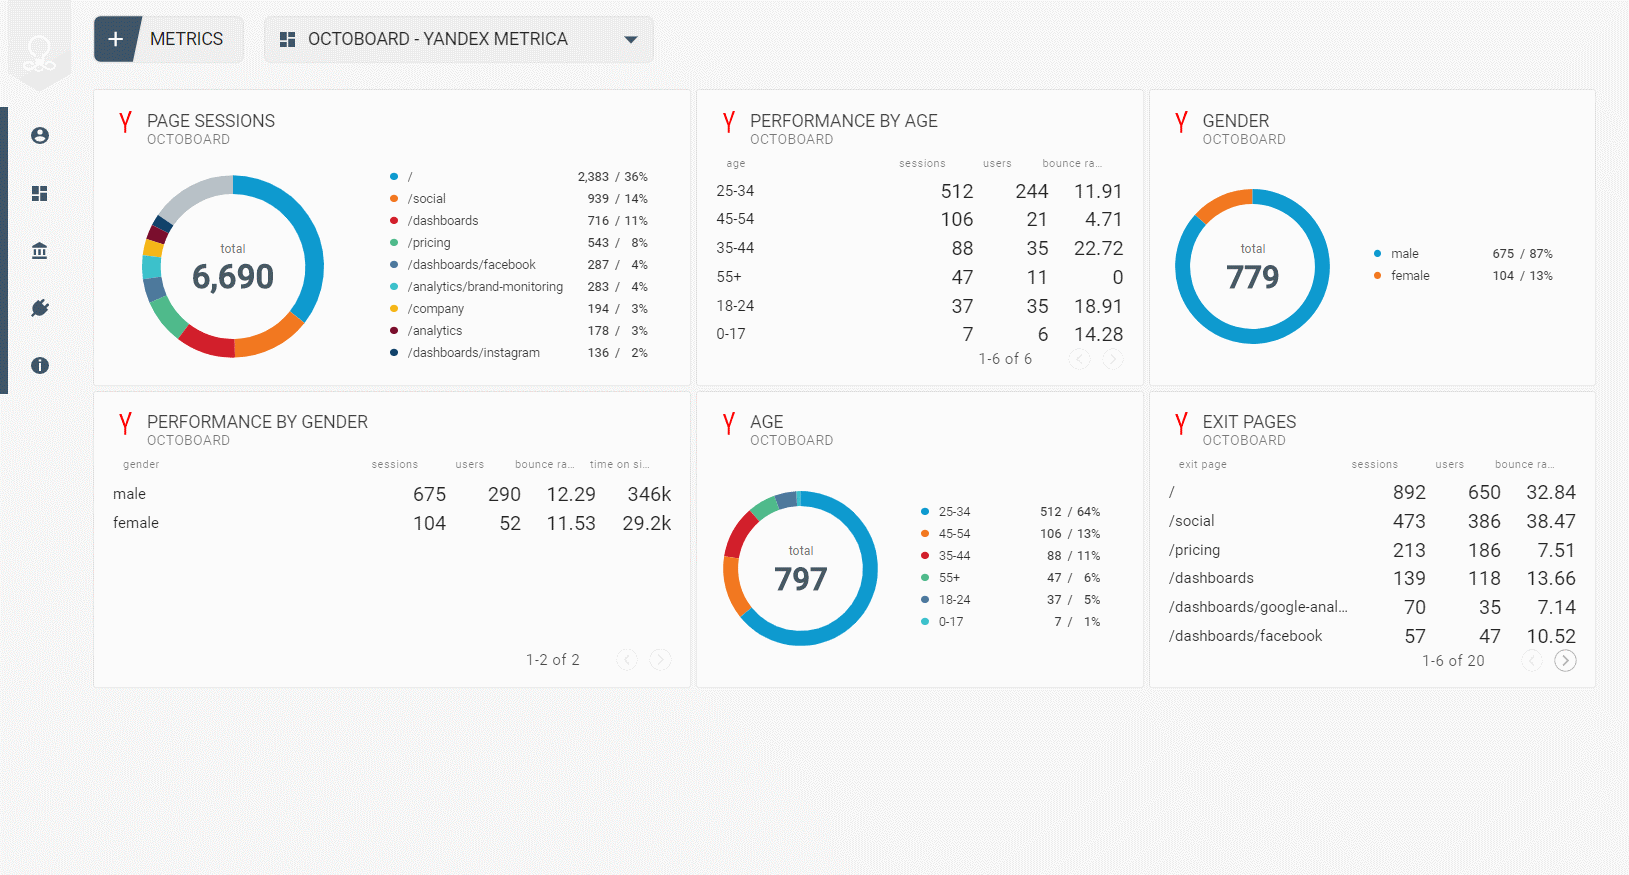
Too complicated dashboards with unnecessary metrics lead to the next mistake that businesses often make - not carefully selected metrics. Your data dashboard should not be used to measure every single metric possible. It should be used to measure the right metrics. In order to determine them, you’ll need to decide which KPIs matter most to the success of the business. Your dashboards should focus on just the most important metrics that have a direct impact on your goals. Again, use Octoboard templates that help concentrate on specific KPIs.
You shouldn’t try to put all the metrics into one dashboard - it leads to complexity and data overload (see mistake #1). After determining the type of your dashboard (strategic, operational or analytical), you can subdivide dashboards according to business operations - sales, marketing, finance etc. Octoboard’s Dashboards for Separate Teams feature will help you present the right metrics to the right people. On the other hand, too many dashboards make the process of managing them rather challenging. So, keep the balance and remember that dashboards are there to save your time and simplify the data processing; do not overload them and, at the same time, keep them informative and actionable.
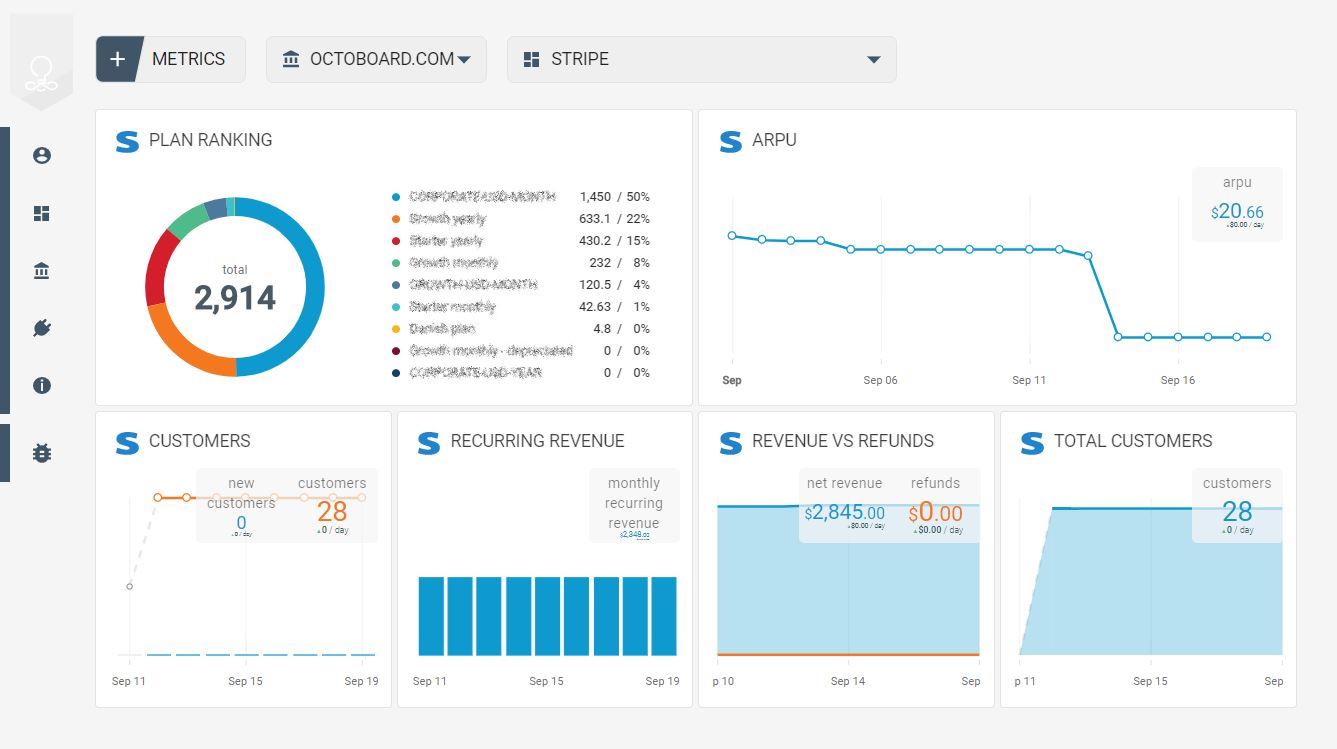
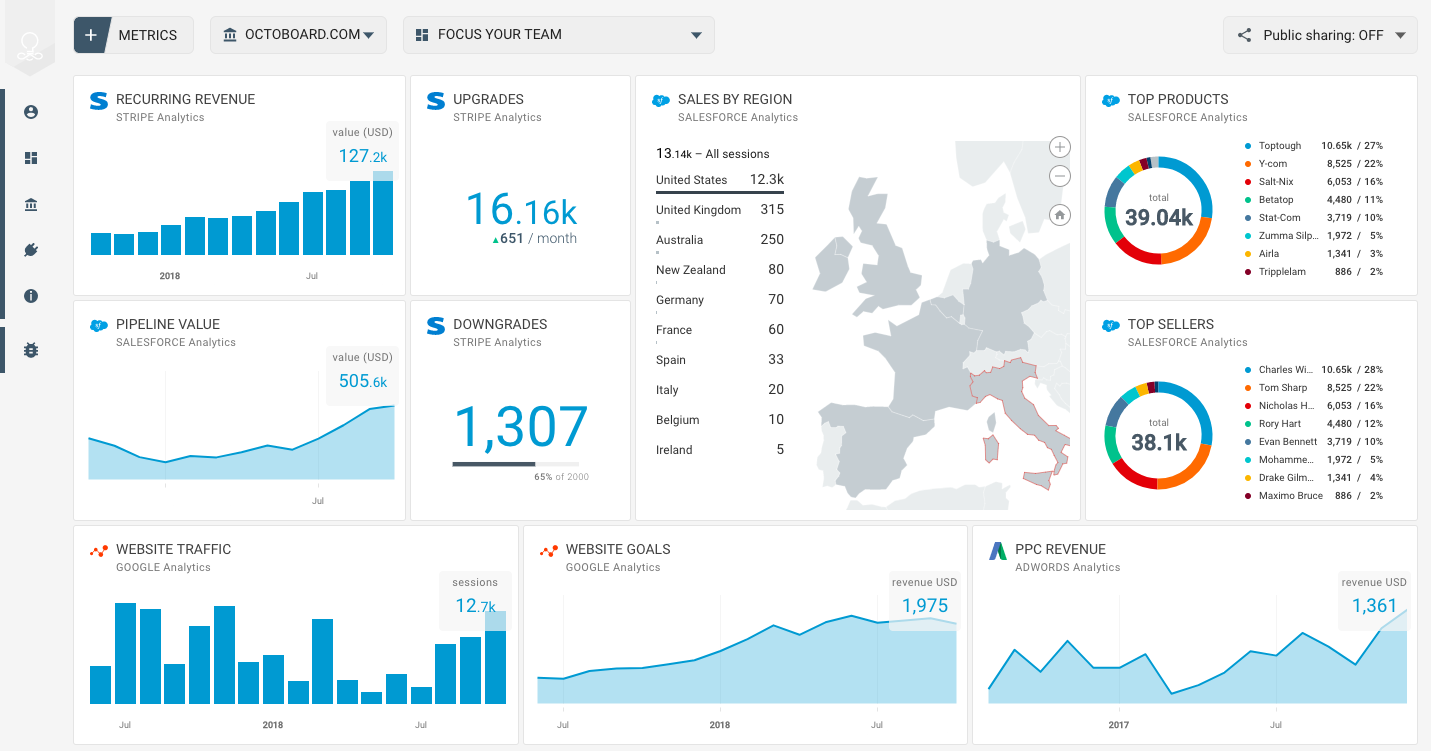
Visual components are a great way to present data as they are rather intuitive to interpret. On the other hand, they must not be too distracting. They shouldn’t divert you from the metrics, because it is data that you need to focus on, not the visuals. For example, pie charts are not the best way to represent data over time. Pie charts are most effectively used when data is given in form of percentages or part of a whole. We suggest you to use Octoboard dashboards, where you can always switch metrics so they are shown in the most logical way.
Do not get it wrong, you should definitely rely on dashboards. But do not rely ONLY on them. An exclusive reliance on marketing dashboards can be counterproductive for strategic thinking and decision making. To get the most out of your dashboard, use them as facilitators of discussions that lead to insights. Keeping your data dashboard simple and graphical will help the discussion. Discussions are a bridge that brings you from analytics to insights. Only by making your dashboard a vital part of decision-making will you be able to get the most value from it.
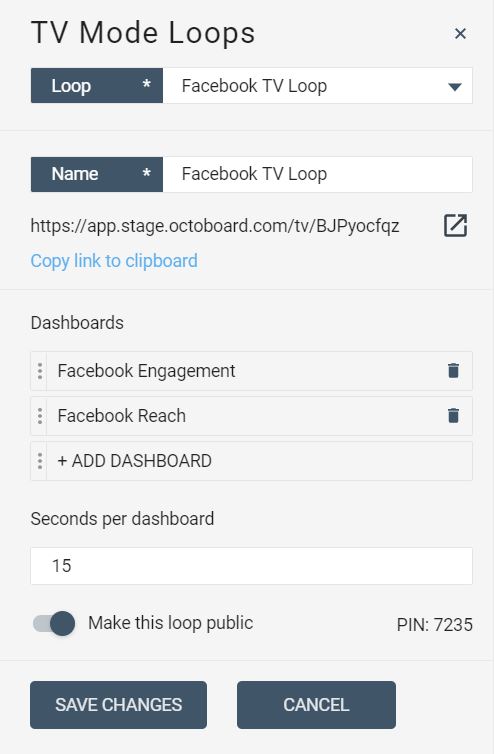
Keeping all information to yourself is obviously not a good way of running a business. Having analytics dashboards only for yourself is not helping you grow. We recommend allowing every employee to view your important analytics so that they can do their job better and more efficiently. You can (and probably should) have your own data dashboard, but a well-informed employee is an employee that can help you achieve your overall business goals. Octoboard’s dashboards have both private and public mode, which will help you share the data with colleagues. Our TV dashboard feature with TV mode loops can be the key to display metrics around the office to specific departments. TV Dashboards improve teamwork in the workplace and drive communication on business performance. Discuss and compare to be able to see trends.
This mistake is closely related to the previous one - lack of sharing. Providing specific data to different departments is the next step. As was already mentioned in mistake #3, the right metrics should be displayed to the right people. We strongly recommend a separate dashboard (or a few) for each department. But remember not to overload it. Also, to turn your company truly data-driven, you should not forget about discussions around the metrics. For this, it is advisable to have some dashboards (better TV dashboards installed in the office) with overall business data to keep the employees informed of what is going on in other departments. Thus you keep everyone involved in the process and encourage teamwork.
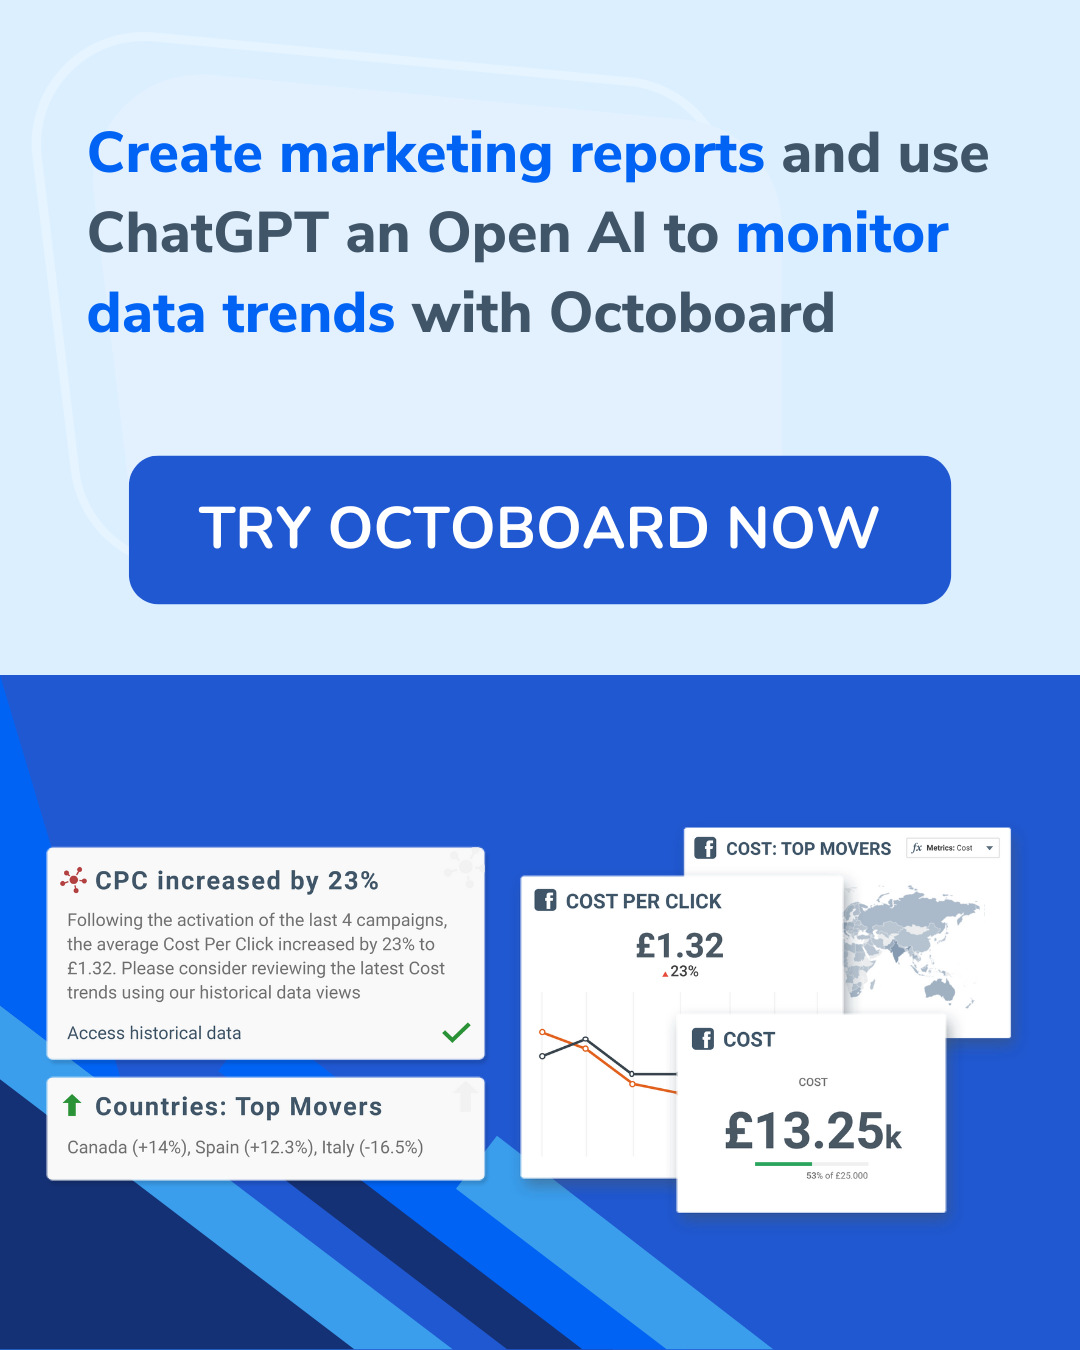
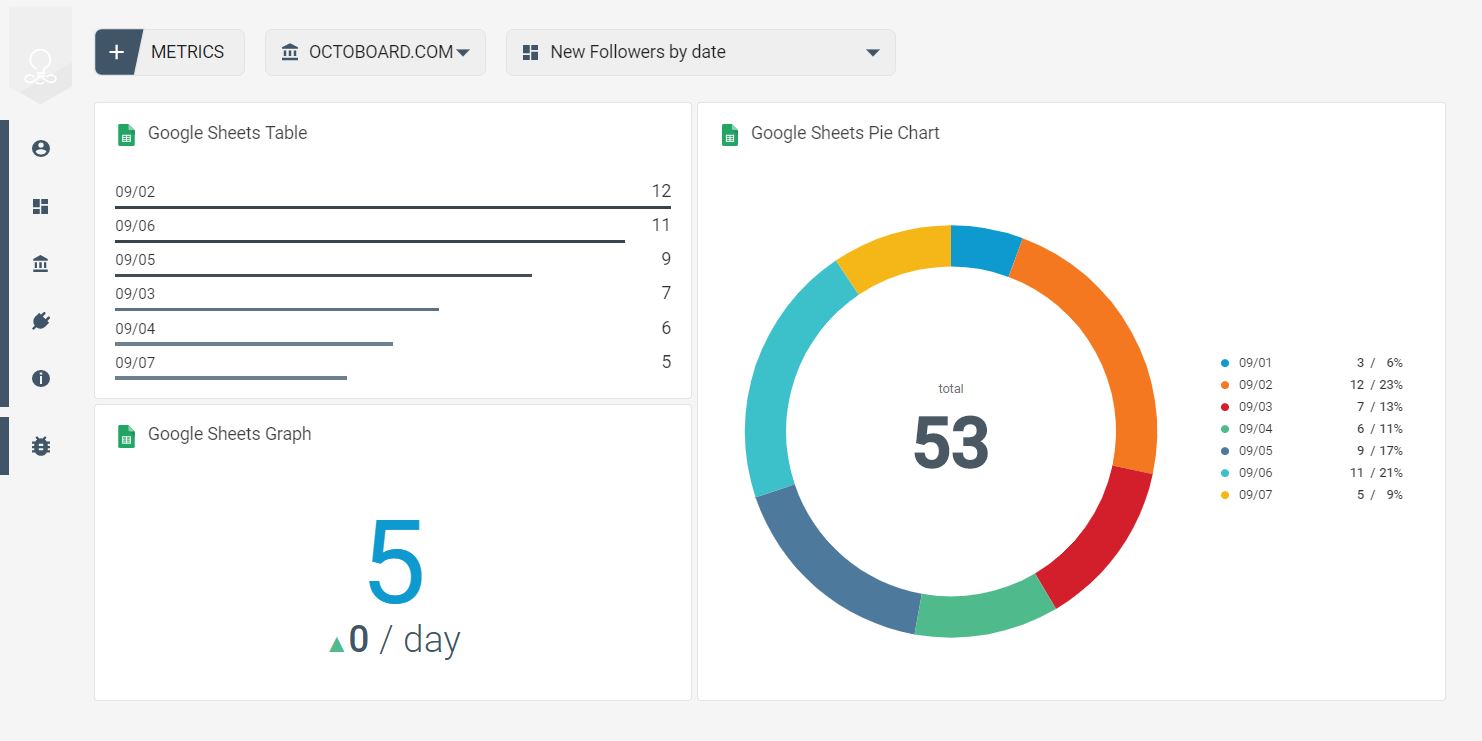
Dashboard solutions usually offer a number of useful features available to the users. Be sure to study them attentively, and, most importantly, take advantage of them to use your dashboard to its full potential. For example, Octoboard provides a set of powerful features including Historical Data Monitoring, White Label Automated Reports for marketing agencies and business managers, a Google Sheets Integration that enables you to track internal data, Multilingual Dashboards and Support, TV Dashboards and TV Mode Loops and many others. That is not to mention our 40+ integrations with the most popular cloud applications (and the list widens regularly).
The mistakes listed are of the most common dashboard errors that businesses make. The main purpose of a dashboard is to help lead your company to success. Creating a metrics dashboard requires a comprehensive approach, and hopefully, these tips will help you avoid the mistakes that others made. It is always better to learn from the errors of others.
Start building a powerful KPI dashboard today with Octoboard’s free plan!