ChartMogul for Investors: Streamlining Financial Analytics and Reporting with Octoboard
Discover the power of ChartMogul for investors with Octoboard's real-time financial analytics dashboards.

CHARTMOGUL FOR INVESTORS
ChartMogul metrics for startups, VCs and angel investors
Building Real-time Financial Analytics Dashboards: ChartMogul for Investors
In the fast-paced world of financial analytics, staying ahead of the curve is not just an advantage but a necessity. For marketing teams and investors, the ability to monitor real-time data and trends can be the difference between strategic success and missed opportunities. Leveraging the power of ChartMogul's cloud data API, Octoboard’s analytics platform transforms raw data into insightful, real-time marketing dashboards. This integration not only enhances decision-making processes but also streamlines financial reporting, saving countless hours of manual data compilation.
The Power of Financial Metrics in ChartMogul
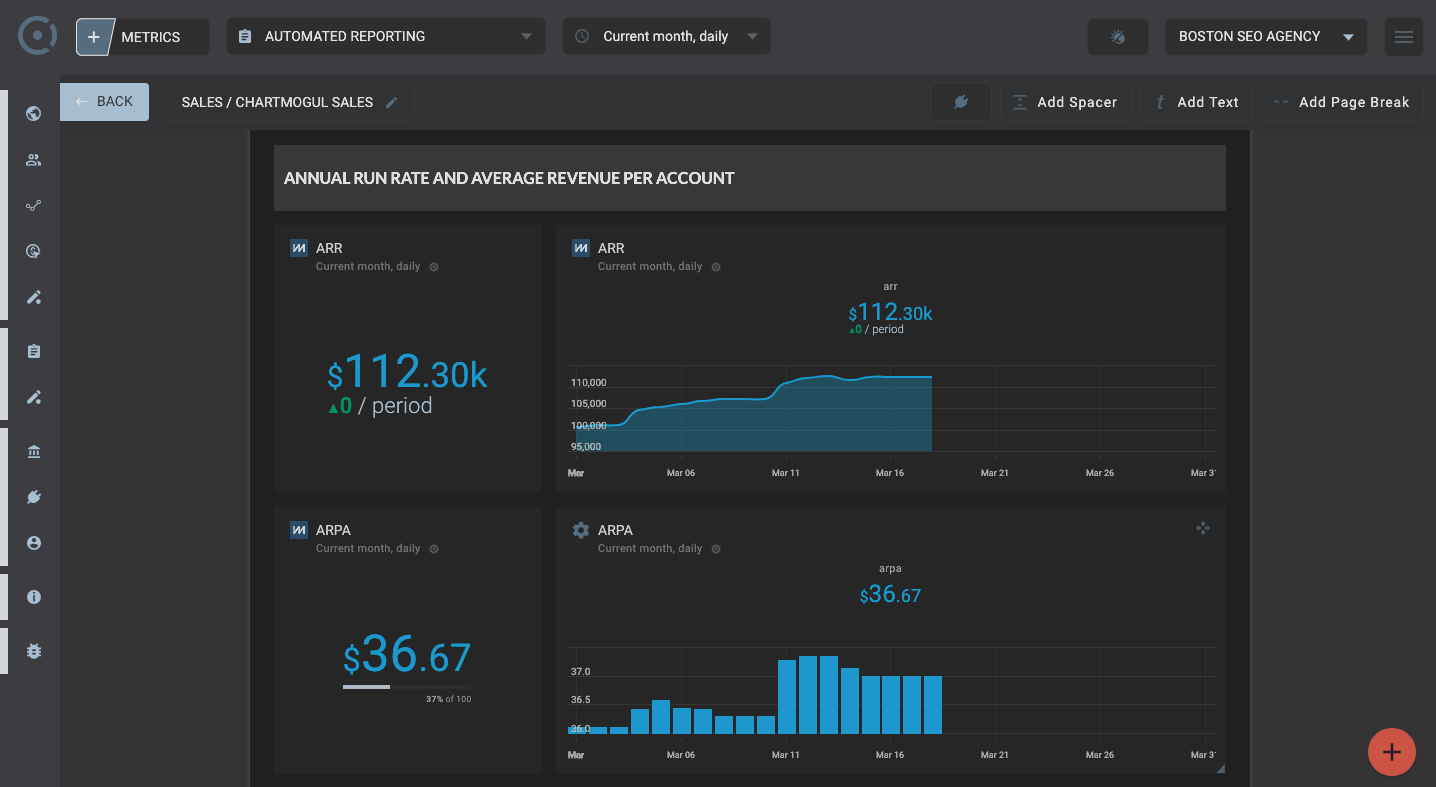
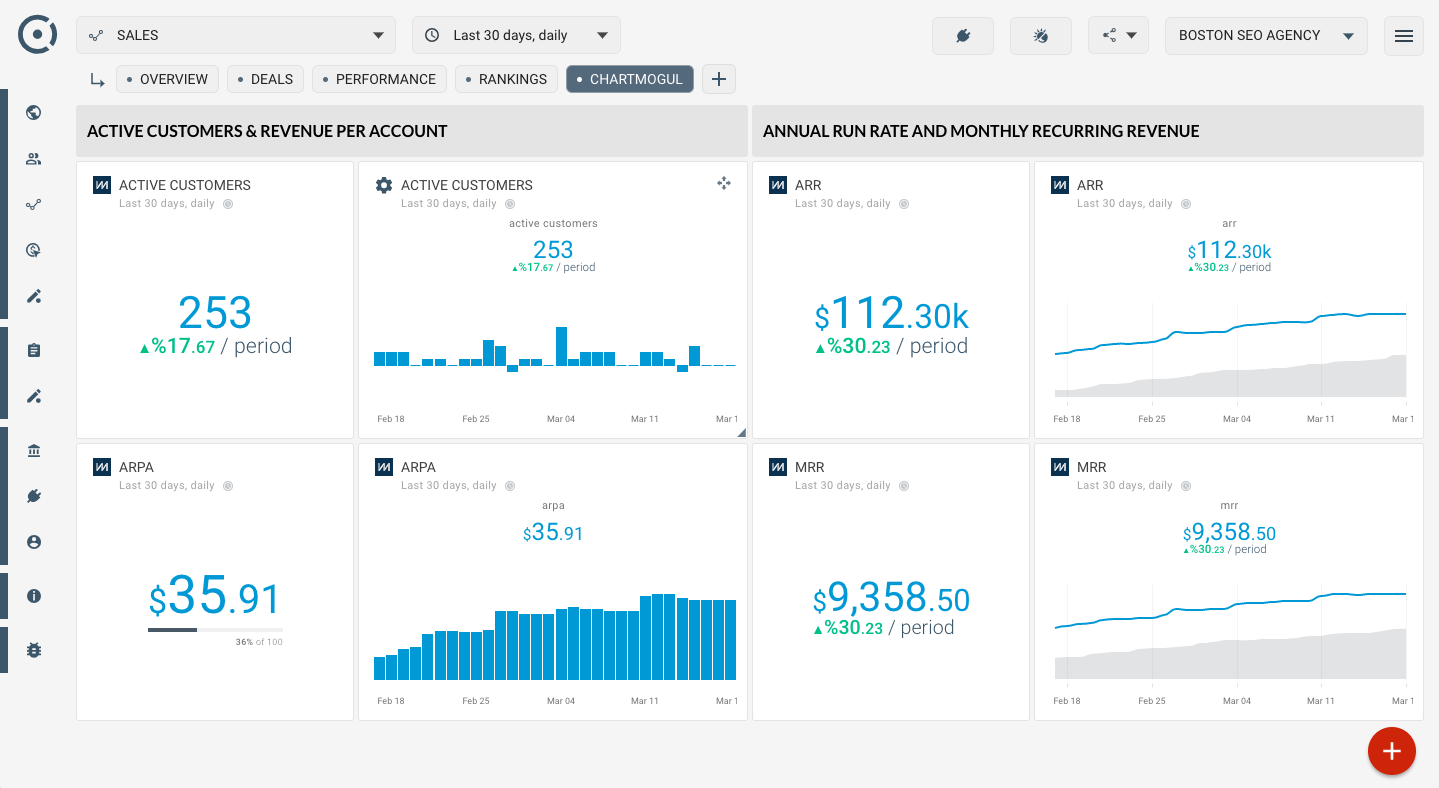
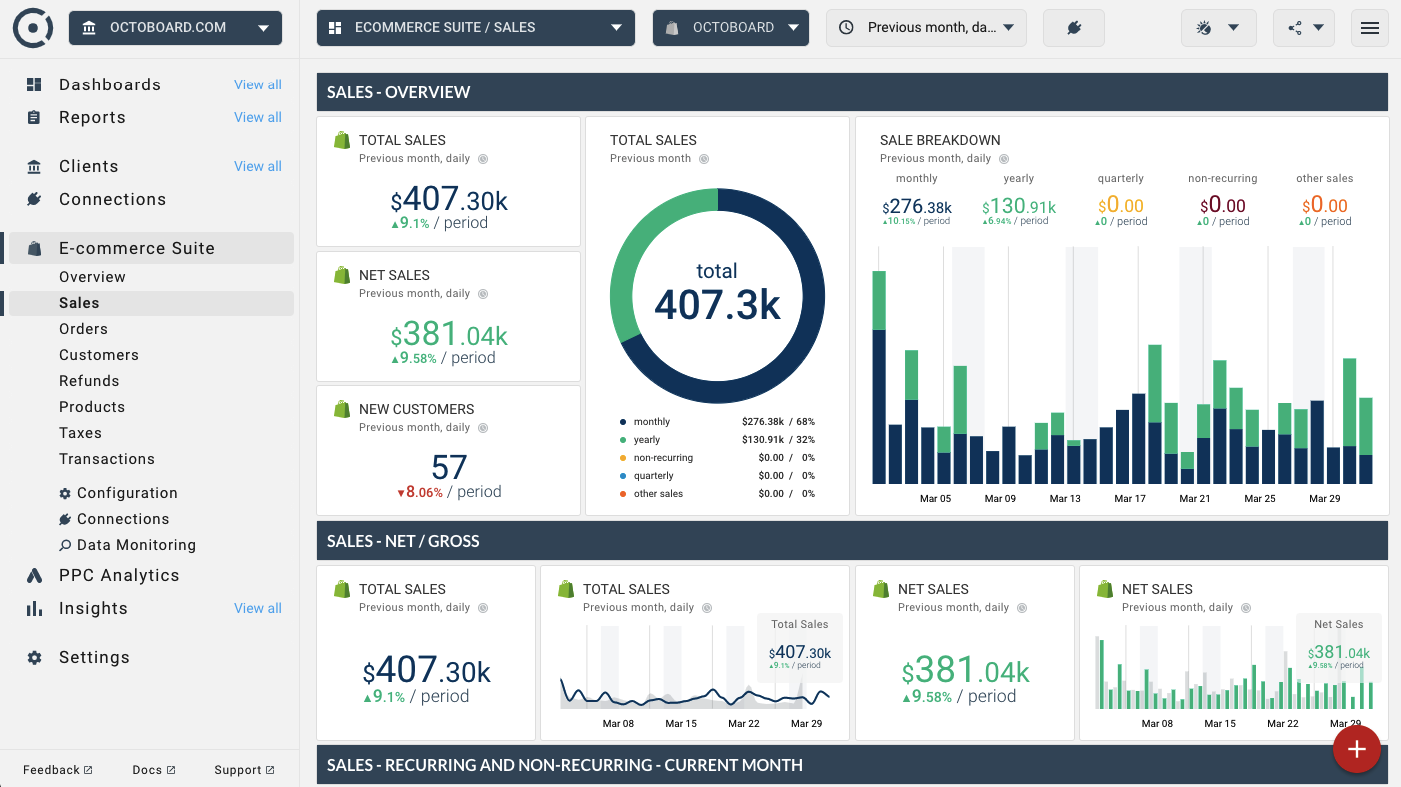
ChartMogul’s data metrics serve as the backbone for insightful financial analysis. Metrics such as Active Customers, Revenue Per Account (ARPA), Annual Run Rate (ARR), and Monthly Recurring Revenue (MRR) provide a comprehensive view of a company's financial health and growth trajectory. These metrics, when monitored closely, can help marketing teams align their strategies with the company's financial goals, ensuring that every campaign contributes positively to the bottom line.
- Active Customers & Revenue Per Account (ARPA) highlight the company's ability to attract and retain profitable customer segments.
- Annual Run Rate (ARR) and Monthly Recurring Revenue (MRR) offer insights into the company’s earning potential and revenue stability, enabling forecasts and trend analysis that guide strategic planning.
Streamlining Dashboards with Octoboard
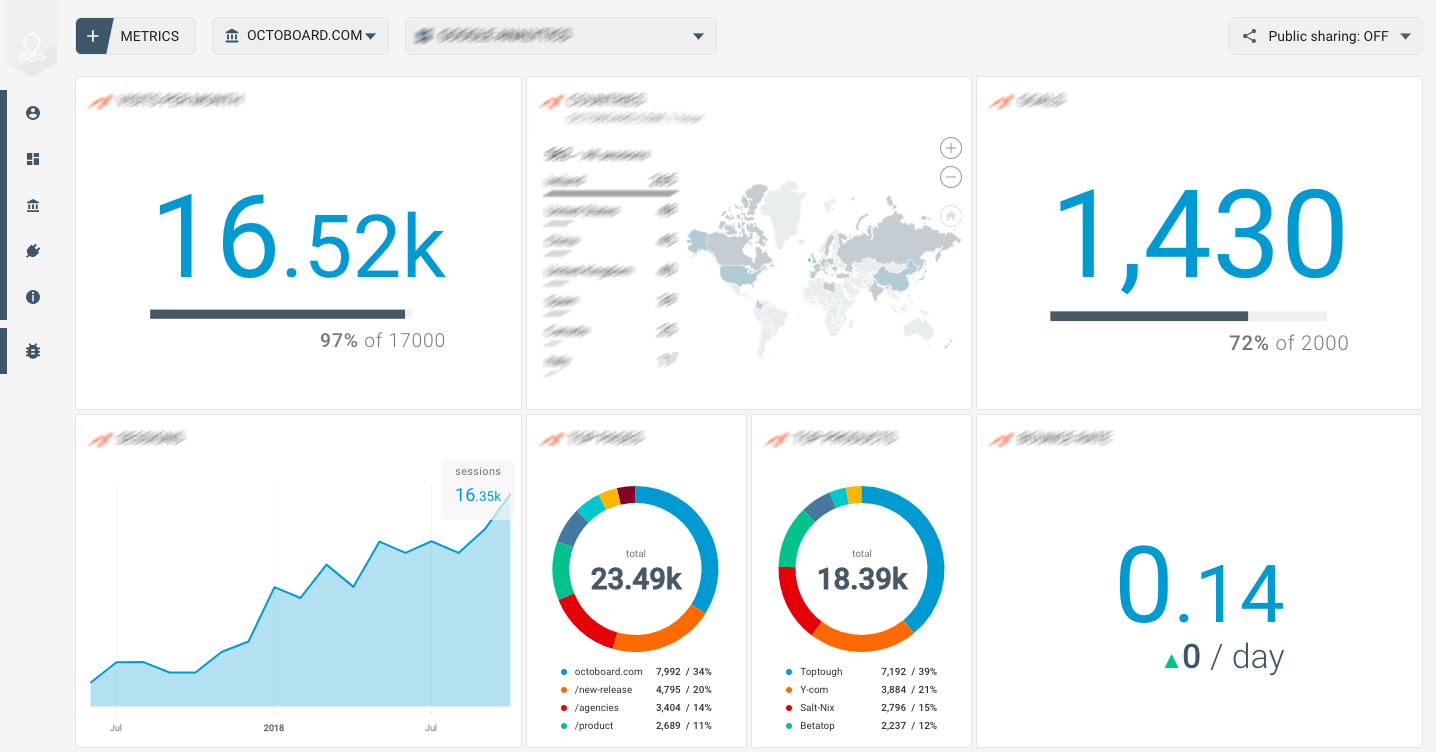
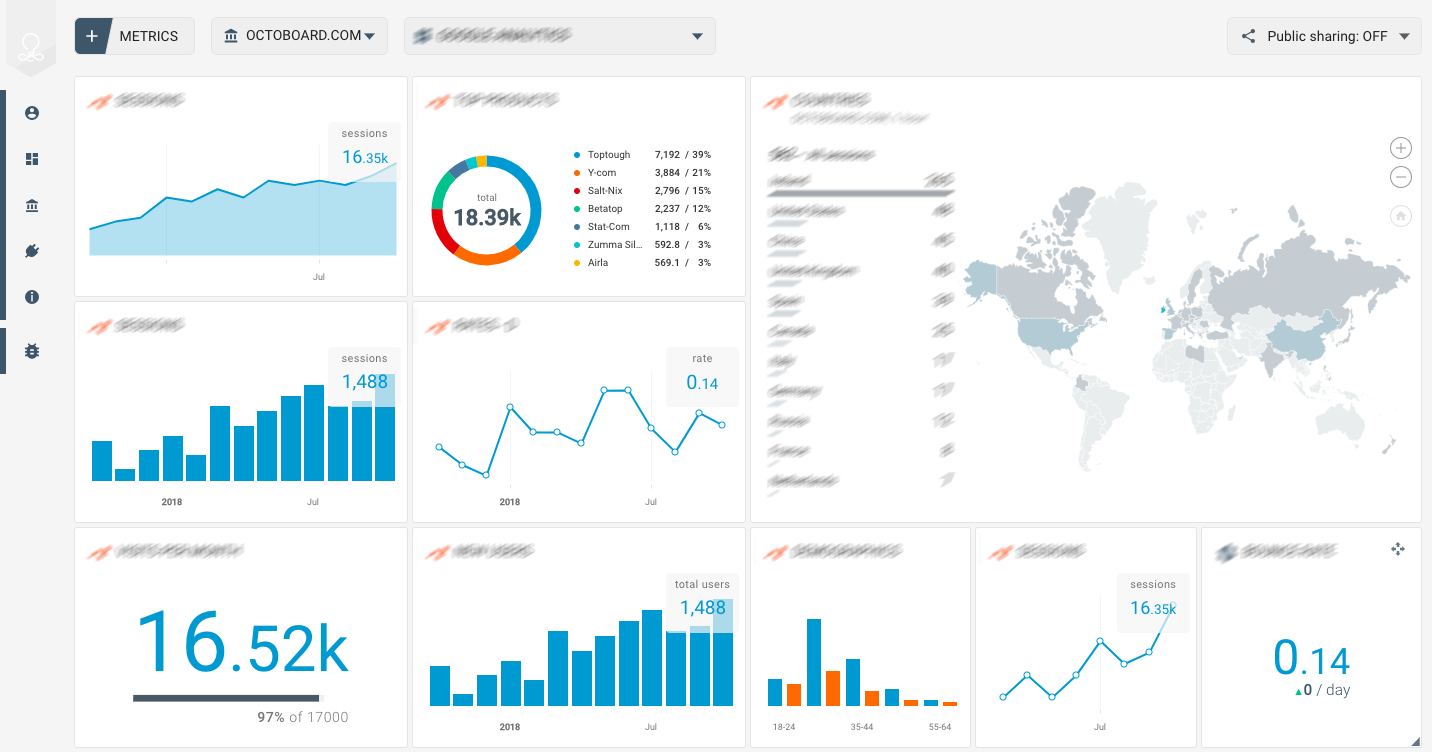
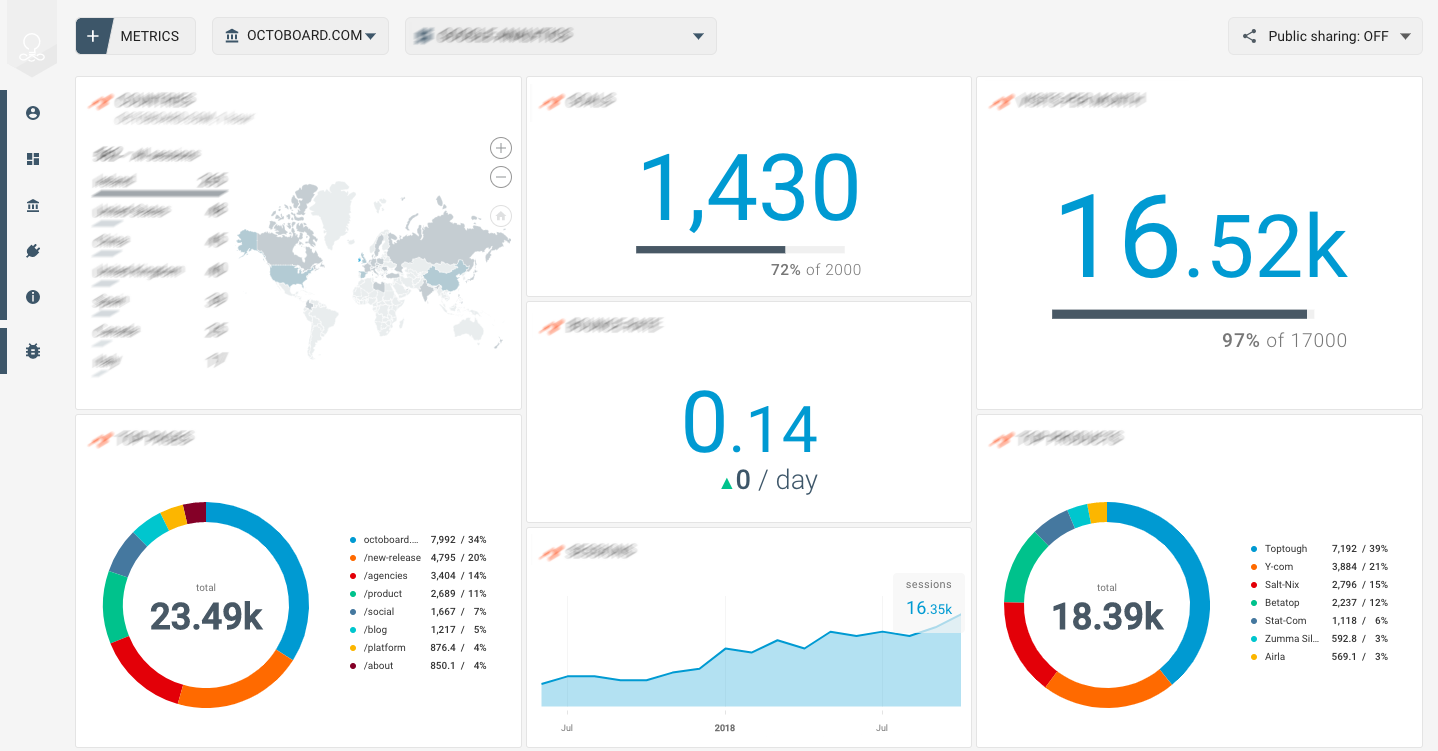
The Octoboard Marketing Analytics platform revolutionizes how marketing teams interact with financial data. By automating the creation of Financial Analytics dashboards, Octoboard eliminates the need for manual data entry, allowing teams to focus on strategy rather than data management. The platform’s ability to build white label client portals further enhances the professional presentation of data, making it an invaluable tool for agencies looking to impress and retain clients.
The real-time visibility provided by displaying a ChartMogul dashboard in an office does not only foster a data-driven culture but also ensures that all team members are aligned with the financial analytics efforts. This level of transparency is crucial for quick decision-making and for maintaining a collective focus on the company’s financial targets.
The Importance of Monitoring ChartMogul Metrics
Keeping an eye on financial analytics performance through ChartMogul metrics is essential for any business aiming to grow sustainably. These metrics offer a clear picture of the company's financial health, enabling marketing teams to adjust strategies in real-time to address any emerging challenges or opportunities. Monitoring these metrics closely ensures that the company remains on track to meet its financial goals, while also providing valuable insights into customer behavior and revenue trends.
Unified PPC Reporting with Octoboard
In the realm of pay-per-click (PPC) advertising, the ability to report and analyze metrics across multiple channels is critical. Octoboard's advanced PPC Analytics module centralizes reporting, bringing together data from various PPC channels into one comprehensive platform. This consolidation is vital for several reasons:
- It saves time by eliminating the need to log into multiple platforms for data.
- It provides a holistic view of advertising performance, enabling better allocation of marketing budgets.
- It allows for the analysis of user engagement, impressions, locations, devices, and other crucial metrics in one place.
The importance of this feature cannot be overstated, especially for marketing agencies managing campaigns across different channels, locations, and currencies. The advanced PPC Analytics module by Octoboard is a game-changer, offering the ability to build new metrics, apply advanced formulas, and create tailored reports that meet specific client needs. For more details, visit Octoboard PPC Analytics module.
Automating Trend Detection with Octoboard and ChartMogul Data
The Octoboard platform's integration with ChartMogul not only facilitates the monitoring of financial metrics but also automates the detection of data trends. This feature is critical for staying ahead of marketing progress and ensuring that strategies are aligned with current financial realities. By generating insights using the ChartMogul data, Octoboard helps marketing teams and agencies to:
- Identify emerging trends in customer behavior and revenue generation.
- Adjust marketing strategies in real-time to capitalize on these trends.
- Ensure that their marketing efforts are always optimized for the best financial outcome.
For a deeper dive into how Octoboard automates trend detection and insights generation, visit Octoboard Generated ChatGPT/OpenAI feature.
Leveraging Google Sheets for Enhanced Data Analysis
Octoboard's Google Sheets data export feature represents another leap forward in data management and analysis. By allowing marketing teams to send cloud data directly to Google Sheets, Octoboard facilitates a seamless transition from data collection to analysis, enabling teams to:
- Perform advanced data analysis using Google Sheets’ powerful tools.
- Share insights easily with stakeholders in a format that’s widely accessible and familiar.
- Customize reports and dashboards within Google Sheets to meet specific analysis needs.
This feature is particularly beneficial for ChartMogul users looking to dive deeper into their financial metrics or to combine them with other data sources for comprehensive analysis. For more information on how to leverage this feature, visit Octoboard Google Sheets add-on feature.
Final Thoughts
In the digital age, the ability to analyze and act on financial data in real-time is a key determinant of business success. By leveraging the integration between Octoboard and ChartMogul, marketing teams and investors can gain unparalleled insights into their financial analytics, empowering them to make informed decisions that drive growth. Through the automated creation of dashboards, advanced PPC analytics, and the innovative use of Google Sheets, Octoboard offers a comprehensive suite of tools designed to streamline financial analysis and reporting, ensuring that businesses remain agile in the ever-evolving market landscape.
Octoboard customers who created this report also used the following data templates:
Key Salesforce Metrics
Deals and Sellers Rankings
Sales Performance
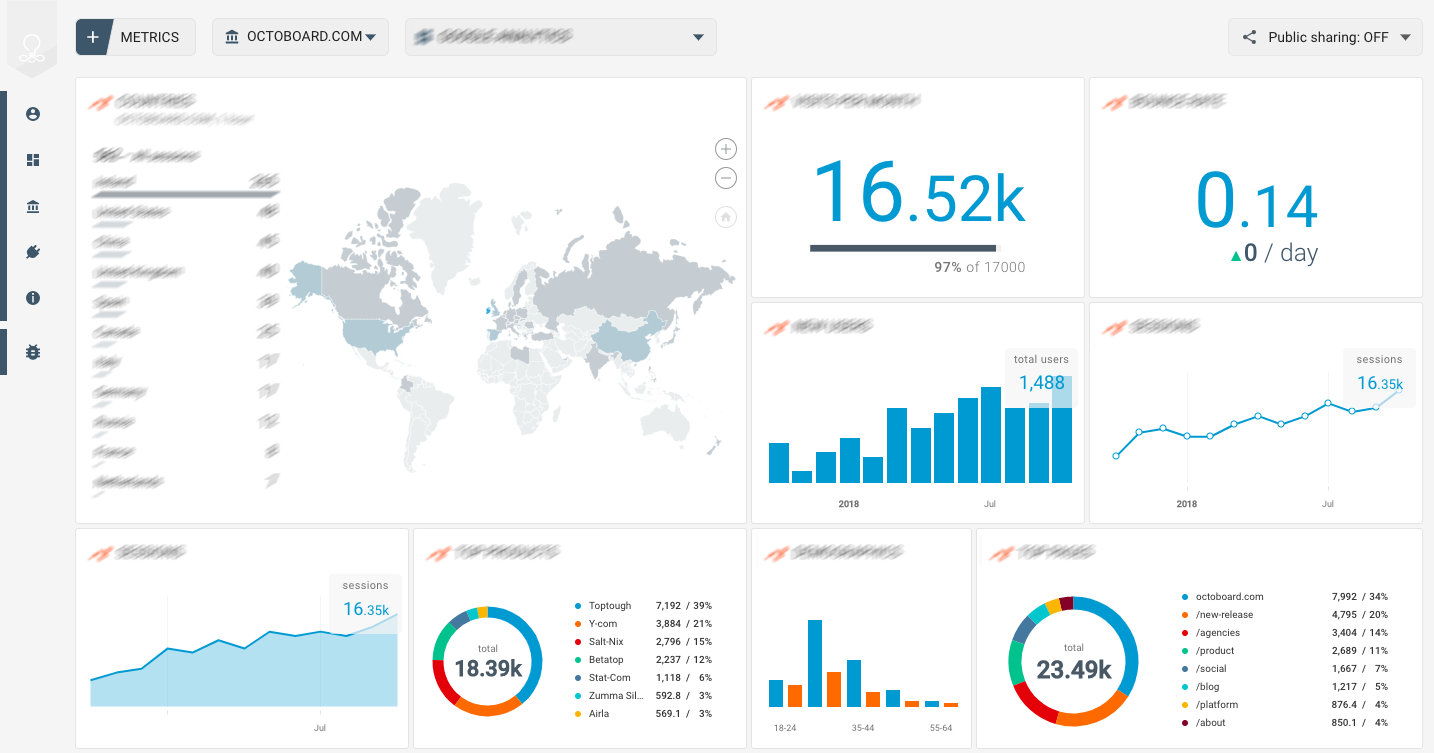
Google Analytics Ecommerce (report)
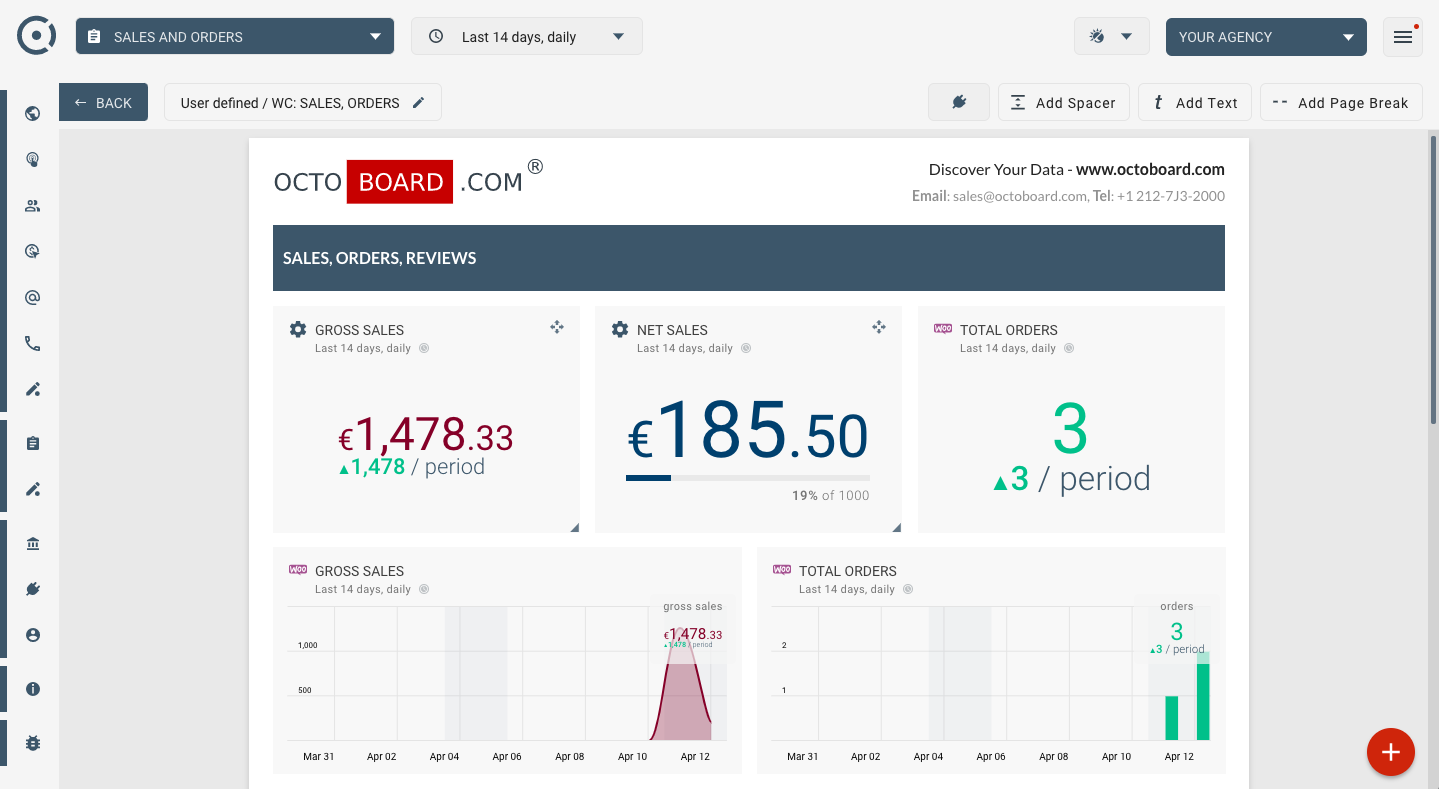
WooCommerce sales (Report)
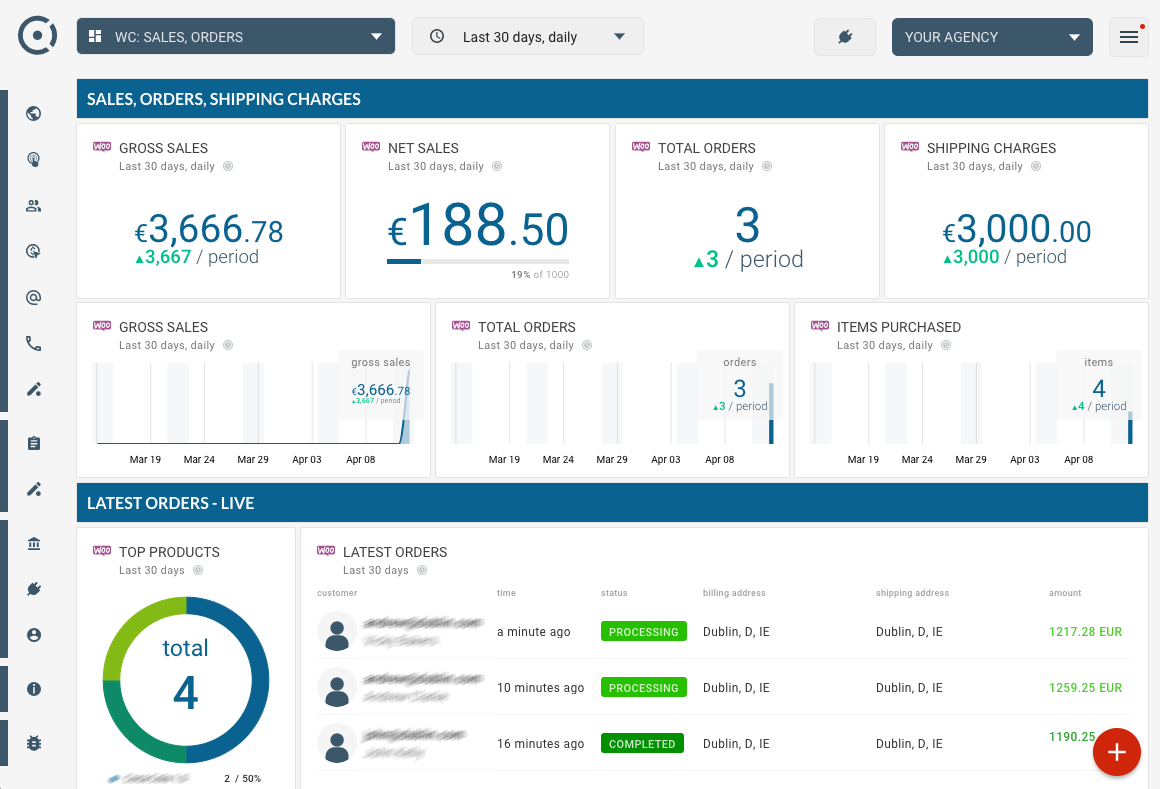
WooCommerce sales
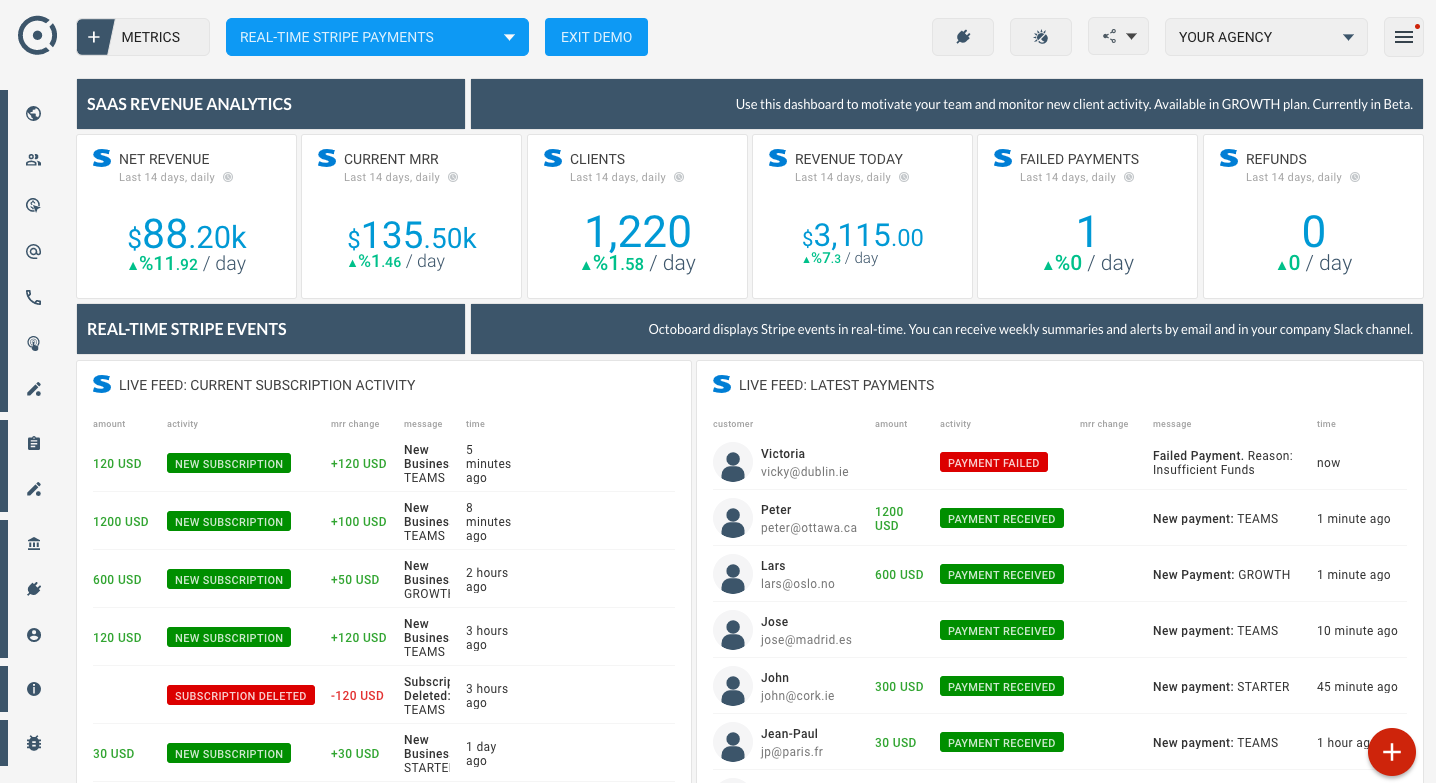
Real-Time Stripe payments

SalesForce Sales (Report)
Salesforce Deals and Leads
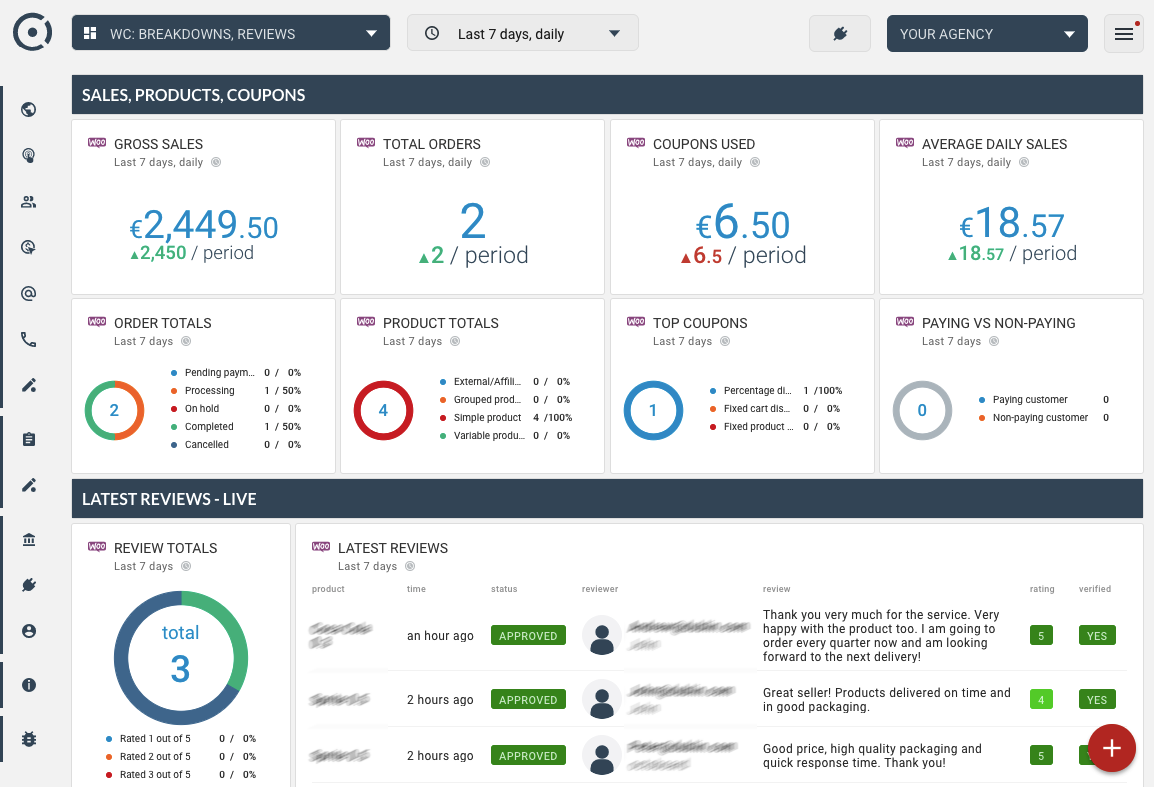
WooCommerce Breakdowns / Reviews
ChartMogul for Investors