Best automated ChartMogul reports for marketing teams
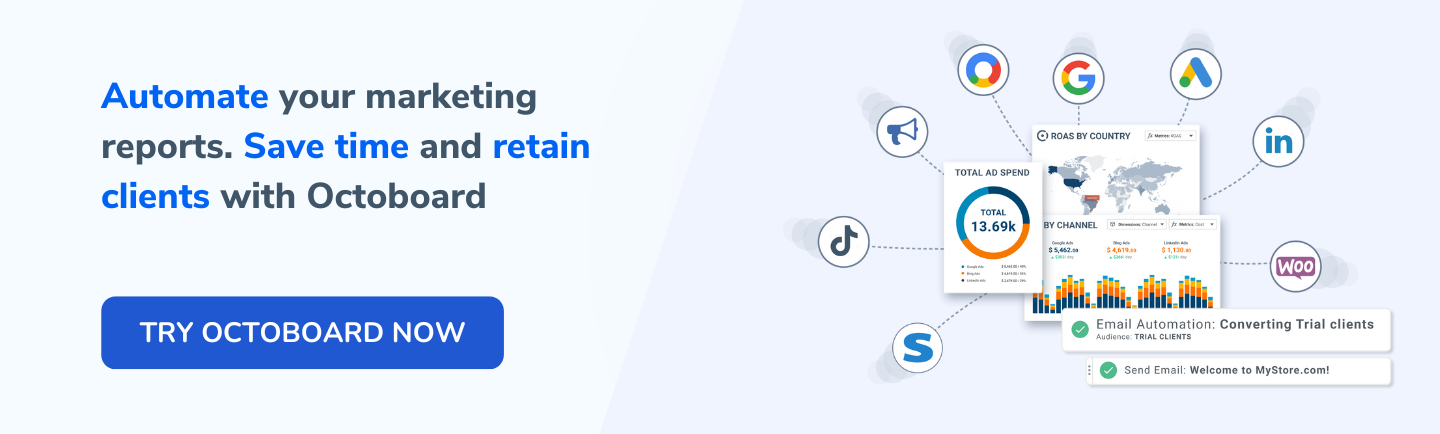
Build automated marketing reports for your analytics teams and clients using ChartMogul data.

CHARTMOGUL REPORTING
ChartMogul subscription revenue analytics metrics.
ChartMogul Integration: Building Automated ChartMogul Ecommerce Analytics Reports Using Octoboard
In the fast-paced world of ecommerce, staying ahead of the curve is paramount for success. This is where leveraging the right tools and technologies becomes a game changer. One such powerful combination is the integration of ChartMogul's rich data analytics with Octoboard, an advanced marketing analytics platform. This blog post delves into how marketing teams can harness this integration to automate and enhance their ecommerce analytics reporting.
Understanding Key ChartMogul Metrics and Their Importance
ChartMogul, known for its comprehensive data metrics, offers several key analytics that are vital for understanding your ecommerce business's performance. Let's explore these metrics:
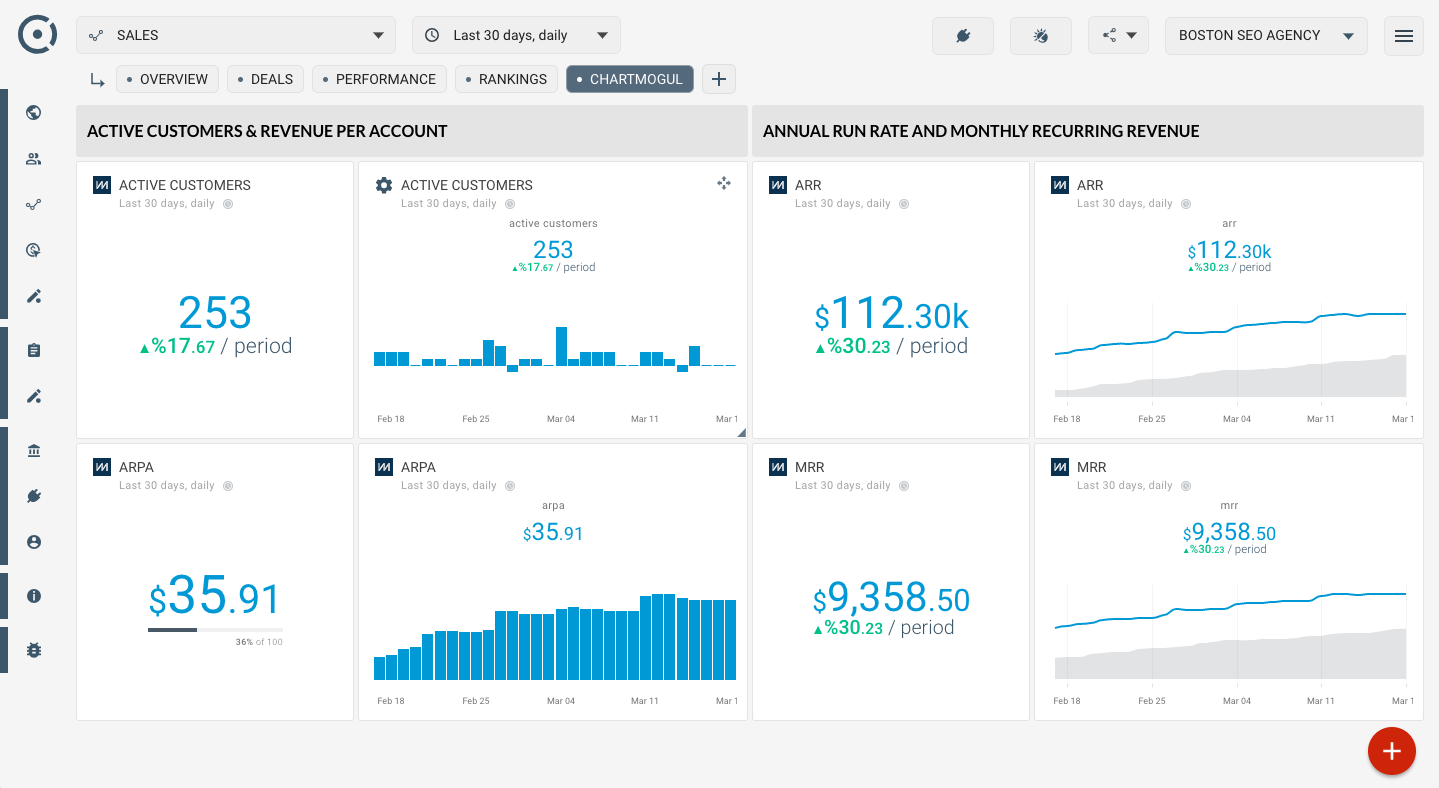
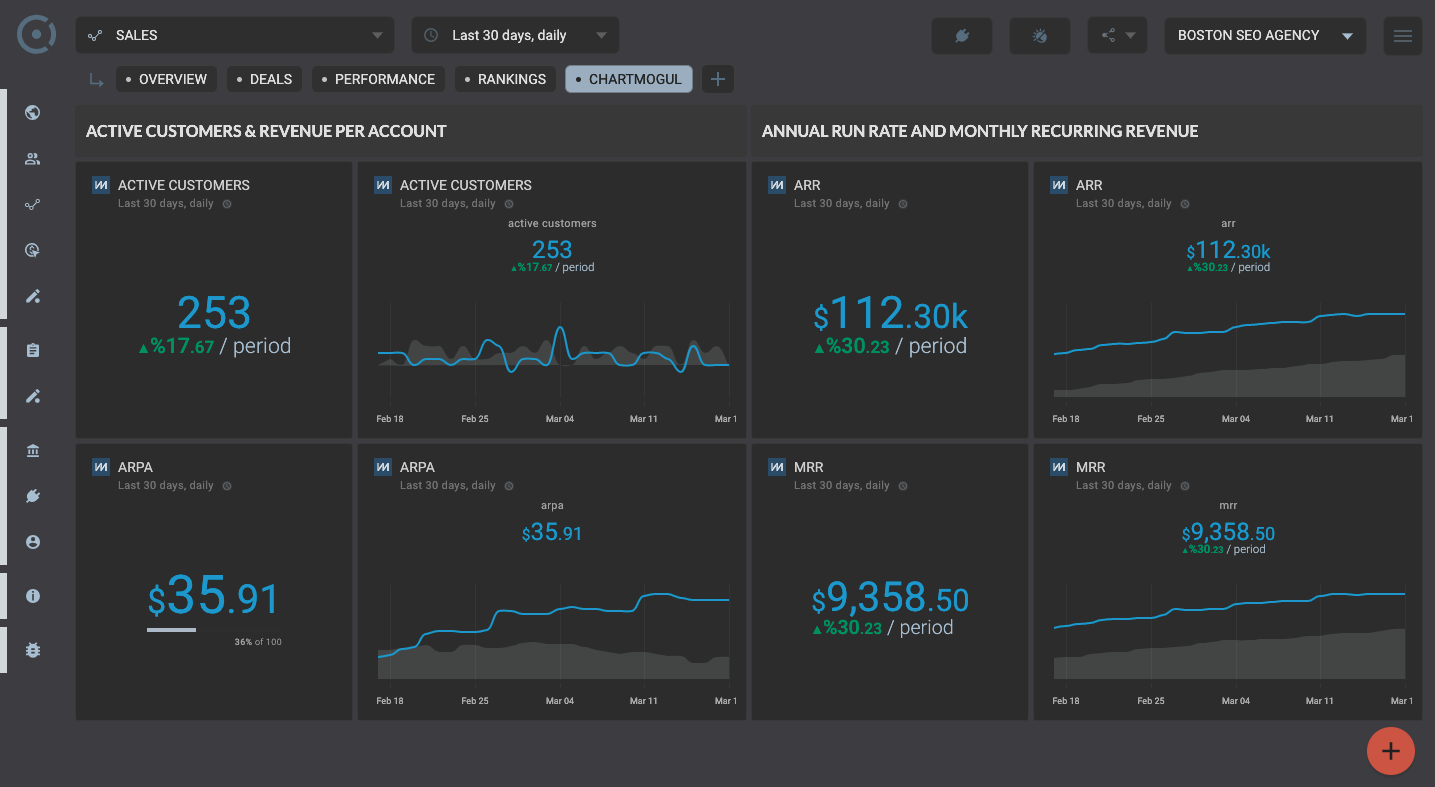
- Active Customers & Revenue Per Account: Knowing the number of active customers and the revenue each account brings helps in understanding customer engagement and value.
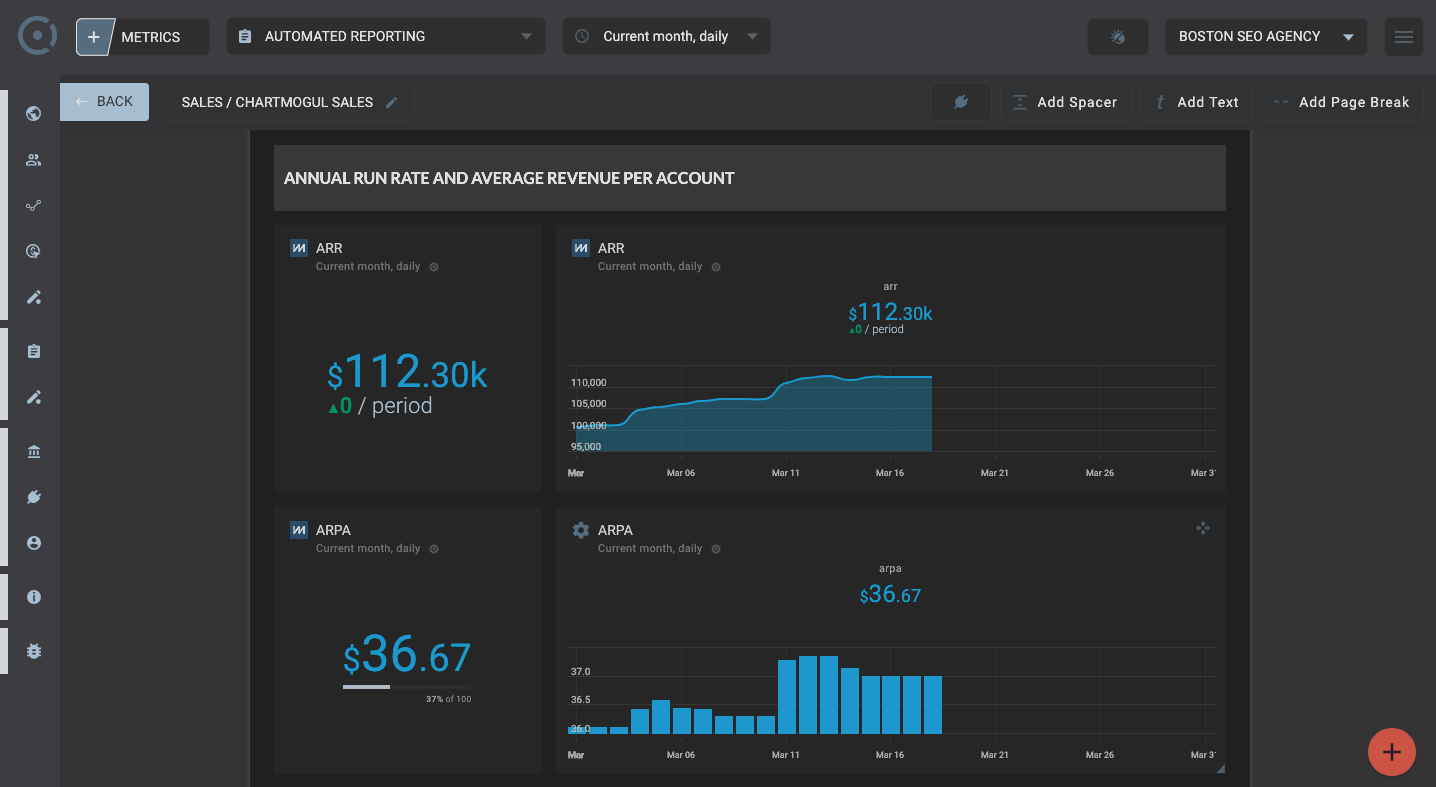
- Annual Run Rate (ARR) and Monthly Recurring Revenue (MRR): These metrics are crucial for gauging the overall financial health and growth trajectory of your business.
- Active Customers: Tracking the number of active customers can indicate the effectiveness of your marketing and customer retention strategies.
- ARR (Annual Recurring Revenue): This metric gives a yearly revenue projection, providing a long-term perspective on revenue streams.
- ARPA (Average Revenue Per Account): ARPA helps in understanding how much revenue, on average, each customer account generates.
How Octoboard Automates ChartMogul Reporting
Utilizing Octoboard for automating ChartMogul reports offers numerous benefits for marketing teams. It saves hundreds of hours by generating automated reports, which can be scheduled for weekly or monthly dispatch to teams or management. This automation provides consistent visibility into ecommerce analytics efforts, ensuring that all stakeholders are always informed about the latest performance metrics.
Consolidating Multiple Ecommerce Analytics Channels
Ecommerce analytics often involve multiple channels, making it challenging to have a unified view of data. Octoboard solves this by aggregating all ecommerce analytics reporting in one place. This consolidation is crucial because:
- It provides a holistic view of performance across various channels.
- It simplifies data analysis, making it easier to identify trends and areas for improvement.
- It enables easier comparison of data across different channels, aiding in strategic decision-making.
Advanced PPC Analytics with Octoboard
For marketing agencies, the advanced PPC Analytics module by Octoboard is a game changer. It allows teams to create new metrics, dimensions, and utilize advanced formulas for transforming PPC data across different channels, locations, and currencies. The value of this feature lies in its ability to customize reports to meet specific client needs and in providing a deeper, more nuanced analysis of PPC campaigns. Learn more about this powerful feature here.
Leveraging OpenAI for Data Trend Analysis
Octoboard's capability to monitor data trends and generate insights using OpenAI and ChartMogul data is a significant advancement. Automating the detection of data trends ensures that marketing agencies are always atop their marketing progress. This feature aids in:
- Identifying emerging trends quickly, allowing for timely strategic adjustments.
- Providing deeper insights into data, which can lead to more informed decision-making.
- Ensuring accuracy in data interpretation, reducing the likelihood of human error.
For more information on how Octoboard can enhance your data analysis with OpenAI, visit this link.
Google Sheets Data Export: Enhancing Accessibility and Collaboration
Octoboard's Google Sheets data export feature is another vital tool for marketing teams using ChartMogul data. By exporting data to Google Sheets, teams can:
- Enhance collaboration, as Google Sheets is widely accessible and allows for real-time teamwork.
- Customize data presentation, making it easier to create tailored reports and visualizations.
- Facilitate data sharing across departments and with clients, improving communication and transparency.
Discover more about the Google Sheets data export feature by visiting this page.
Conclusion
In the dynamic world of ecommerce, the integration of ChartMogul's robust data metrics with Octoboard's advanced analytics platform is a potent combination for marketing teams. By automating the generation of comprehensive, customizable reports, teams can save significant time and resources. The ability to consolidate multiple channels, harness advanced PPC analytics, and leverage AI for trend analysis empowers marketing teams to stay ahead in a competitive landscape. The addition of convenient data export options like Google Sheets further enhances the utility and accessibility of these analytics. In essence, this integration is not just about simplifying data analysis – it's about transforming how ecommerce analytics are performed, making them more efficient, insightful, and actionable.