Revolutionizing Marketing Strategies with ChartMogul Startups MetricsReport
Discover how automated financial analytics reports built on ChartMogul data are revolutionizing marketing teams' operations and demonstrating their value to clients.

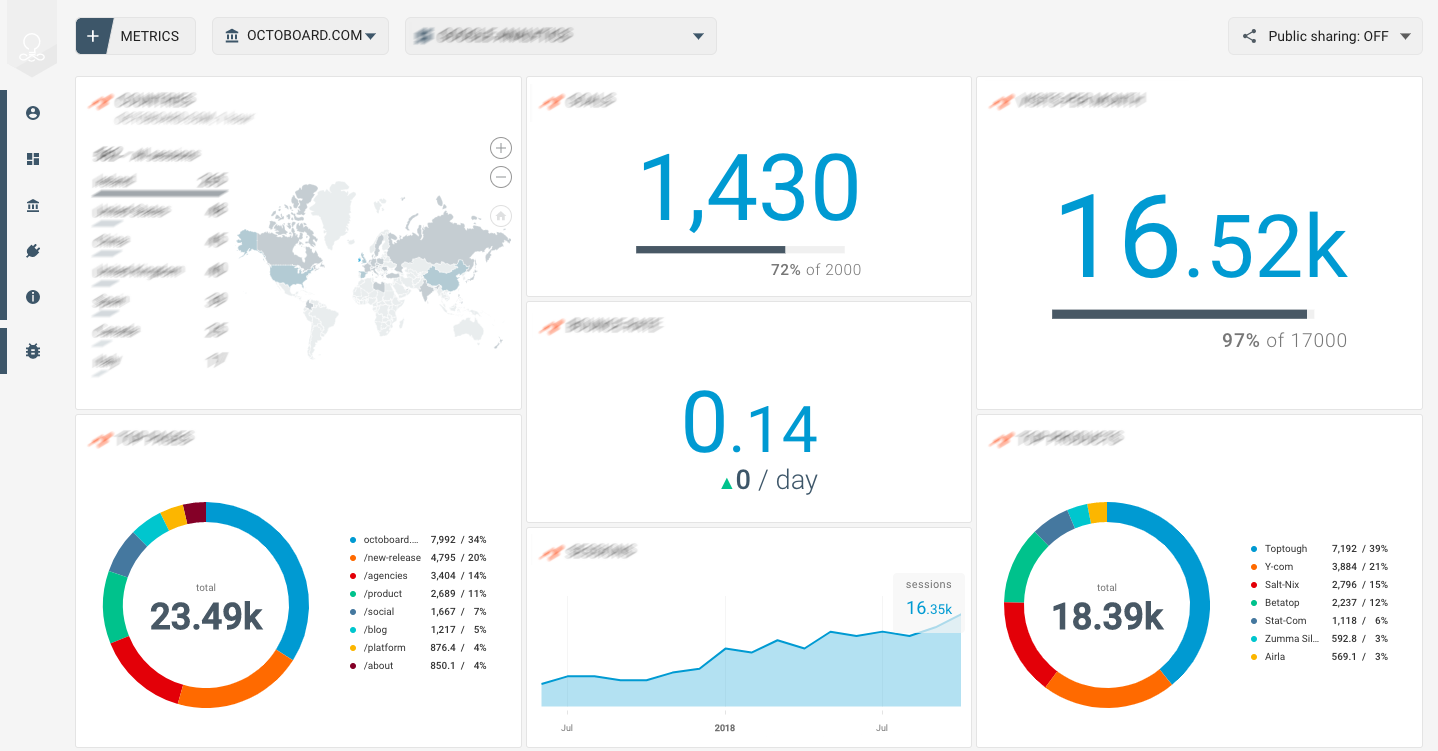
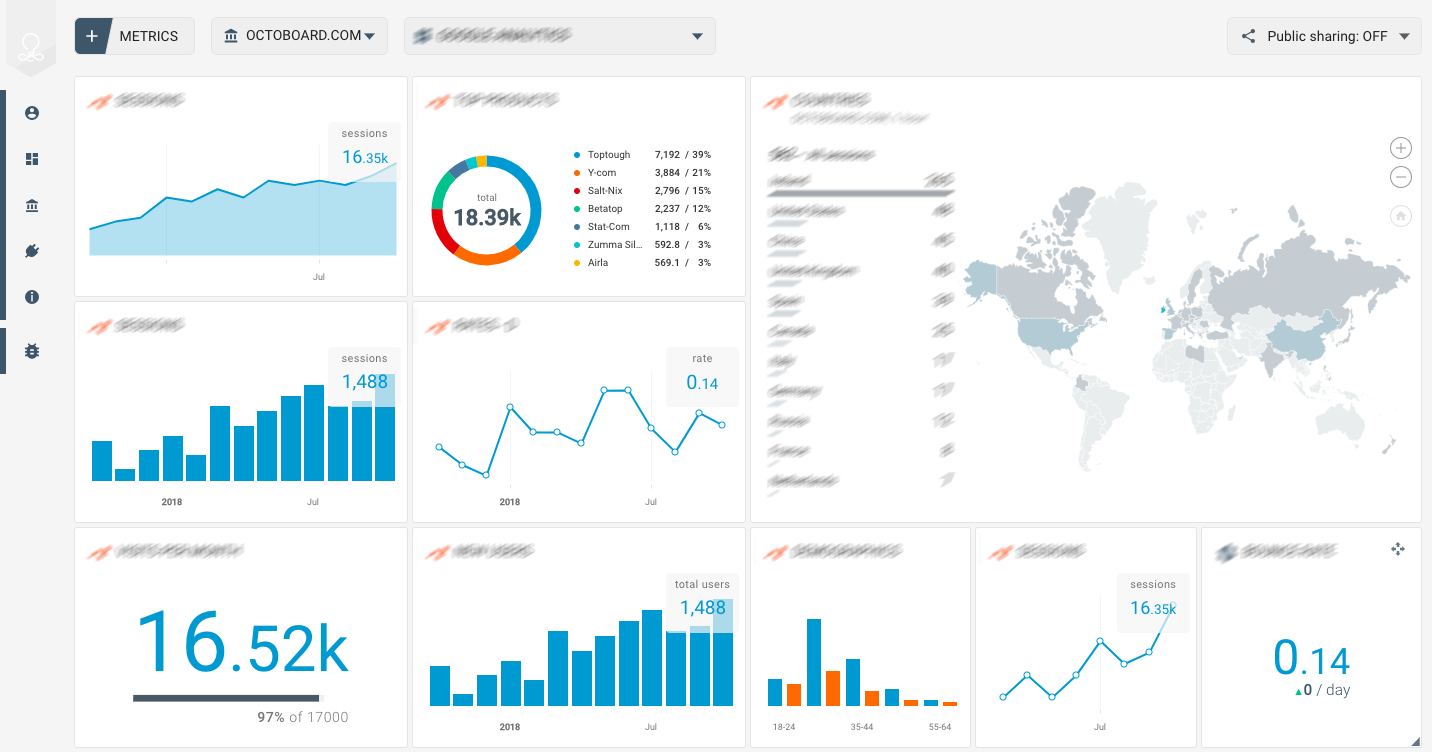
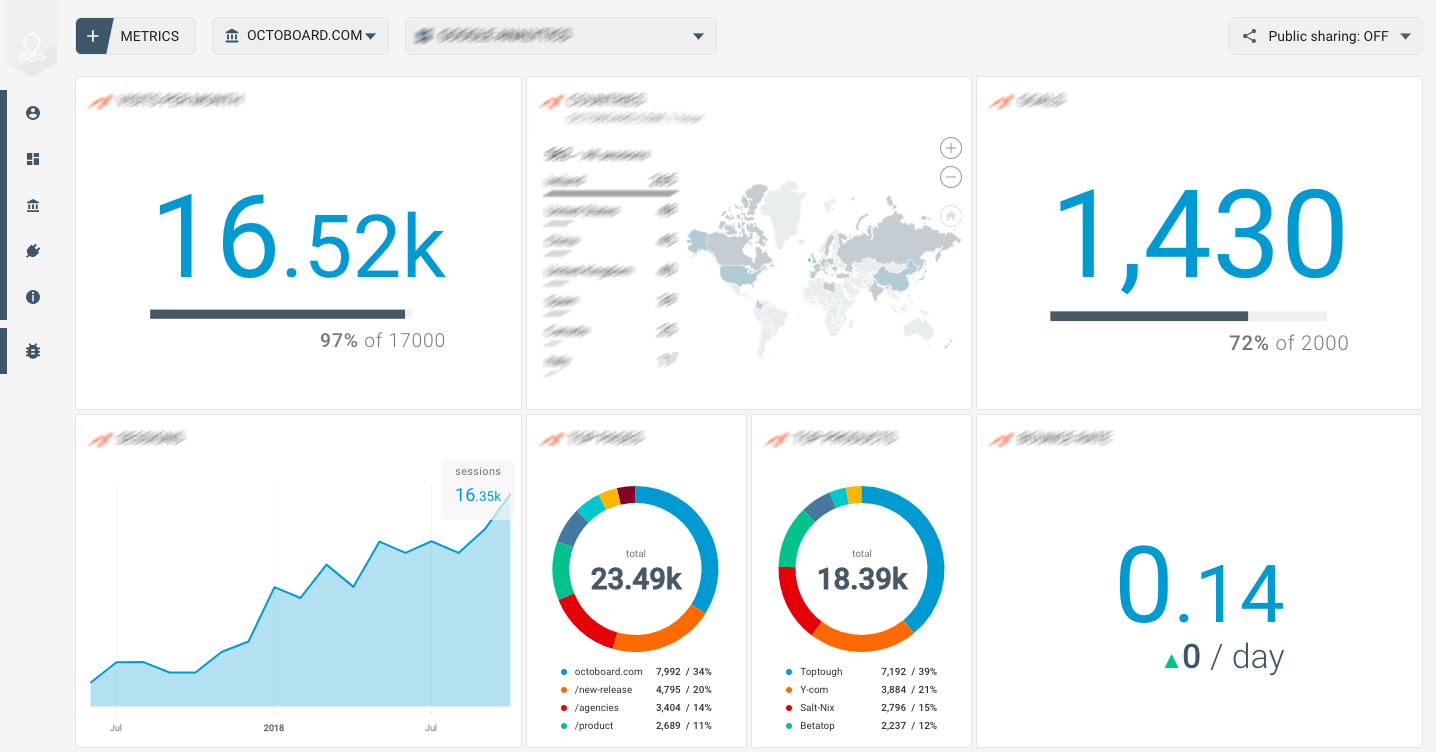
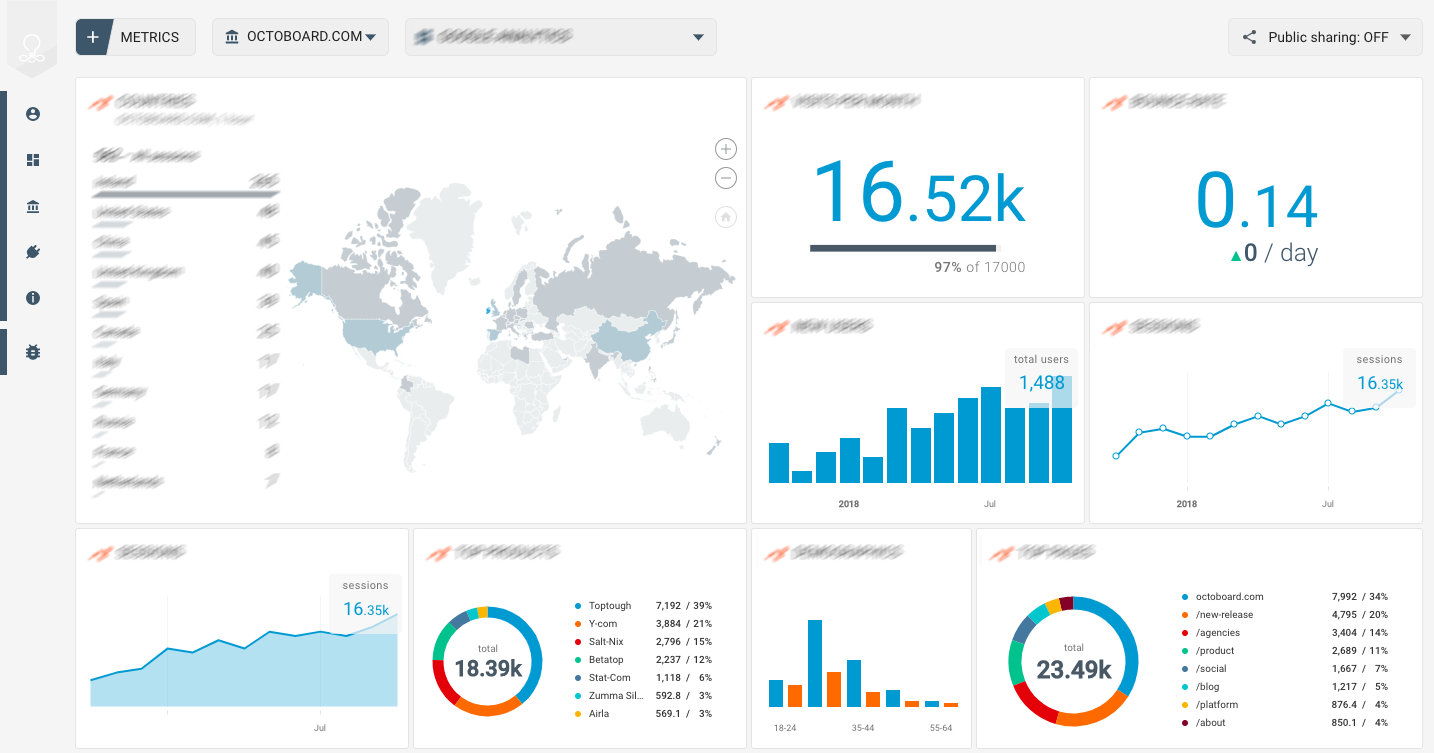
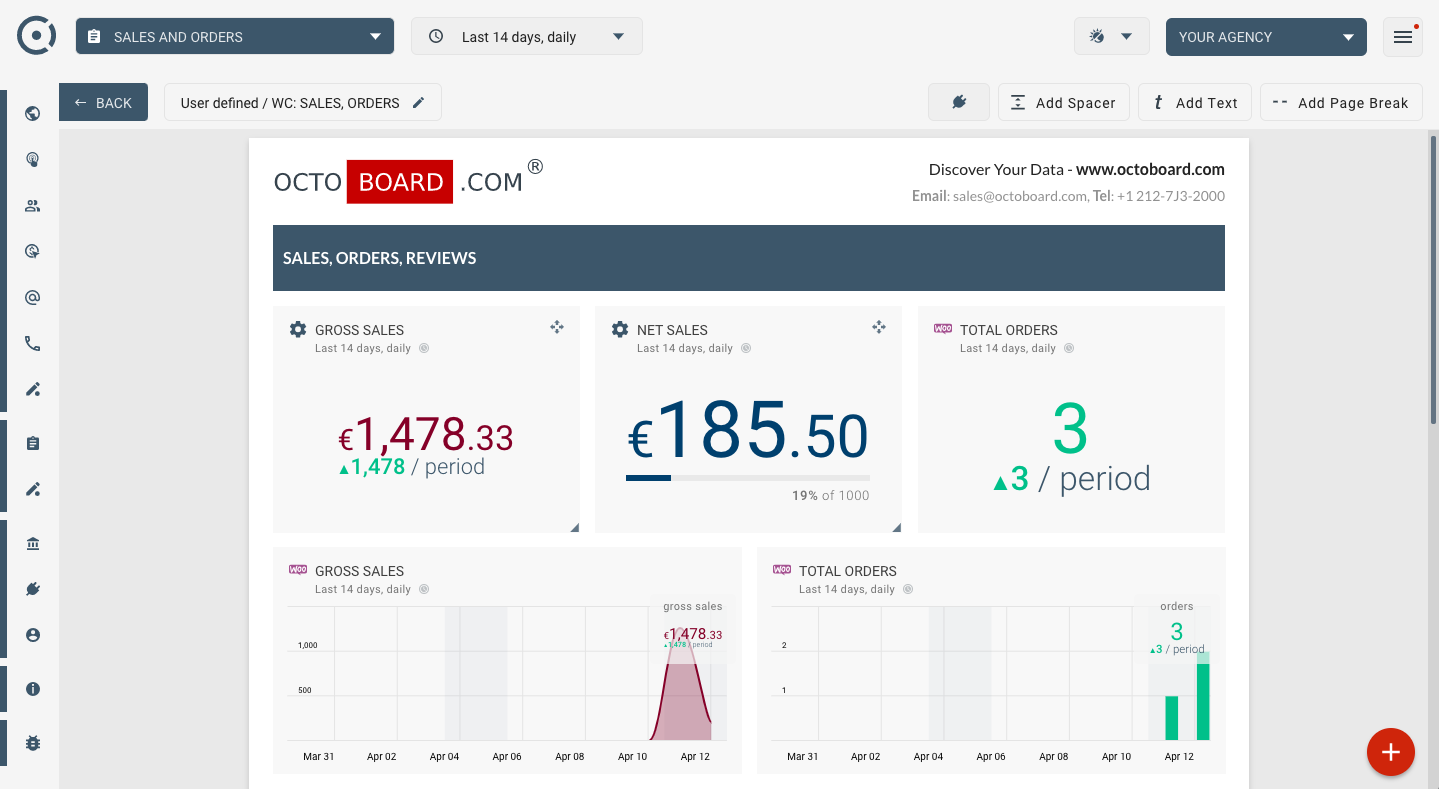
CHARTMOGUL STARTUPS METRICS (REPORT)
ChartMogul SaaS revenue metrics for startups and investors
Automated Financial Analytics Report: ChartMogul Metrics Overview
In the rapidly evolving digital landscape, the importance of data analytics in financial planning and marketing strategies cannot be overstated. With the advent of sophisticated analytics platforms like Octoboard, leveraging data from comprehensive metrics systems such as ChartMogul has never been easier or more impactful. This blog post delves into how automated financial analytics reports, especially those built on ChartMogul data, are revolutionizing the way marketing teams operate, save time, and demonstrate their value to clients.
Understanding Key ChartMogul Metrics
ChartMogul introduces a suite of metrics crucial for any marketing team focused on financial analytics:
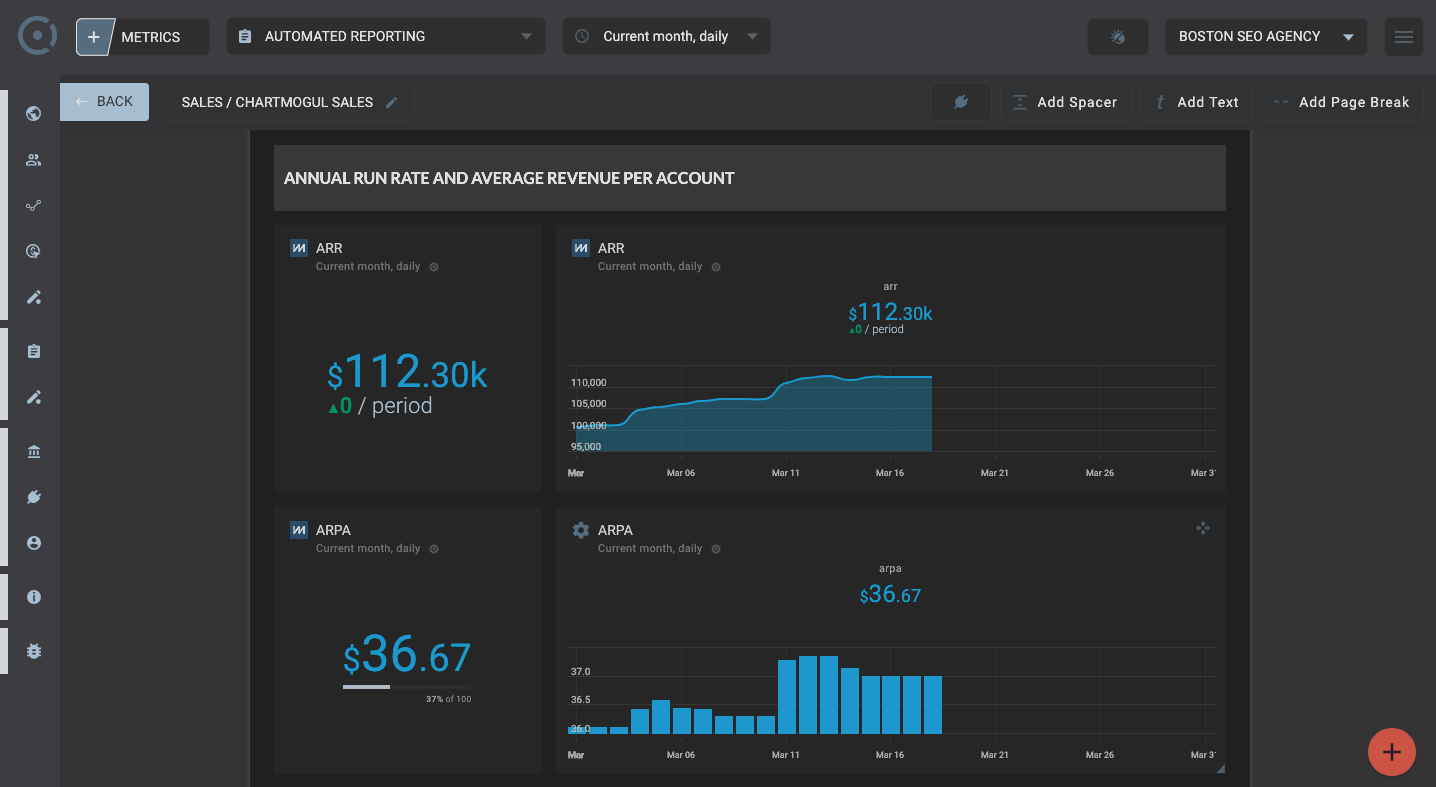
- Chartmogul ARR (Annual Recurring Revenue)
- Chartmogul MRR (Monthly Recurring Revenue)
- Chartmogul ARPA (Average Revenue Per Account)
- Chartmogul Customers
These metrics are pivotal for understanding a company's growth trajectory, customer value, and revenue stability. ARR and MRR offer insights into the long-term and short-term recurring revenue generated, respectively, providing a clear picture of financial health and sustainability. ARPA, on the other hand, helps in understanding the value each customer brings to the business, which is essential for refining targeting strategies. The number of customers directly ties into the company's market penetration and growth potential.
The Role of Octoboard in Financial Analytics
Octoboard's integration with ChartMogul data through its cloud data API simplifies the complex process of financial reporting. By automating the generation and dissemination of financial analytics reports, Octoboard saves marketing teams countless hours. Such automation ensures that reports highlighting the latest trends and updates are regularly sent out via email or Slack, keeping teams and management constantly in the loop.
The significance of this automation extends beyond time-saving. It provides real-time visibility into the effectiveness of financial analytics efforts, allowing teams to make data-driven decisions swiftly. Moreover, in an era where content is king, creating detailed reports can significantly enhance a company's ranking on Google Analytics 4 (GA4) by showcasing thought leadership and industry expertise.
Consolidating Financial Analytics Reporting
One of the primary advantages of using a platform like Octoboard is its ability to bring all financial analytics reporting into one centralized location. This consolidation is crucial for several reasons:
- It ensures that data from different metrics are not siloed but viewed in correlation, providing a more comprehensive understanding of financial health.
- It allows for easier access and interpretation of data, enabling marketing teams to quickly identify trends, opportunities, and areas needing improvement.
- It streamlines the reporting process, making it easier to share insights with stakeholders and clients, thus enhancing transparency and trust.
Enhancing PPC Analytics with Advanced Features
In addition to financial metrics, Octoboard offers an advanced PPC Analytics module that is a game-changer for marketing agencies. This module allows for the creation of new metrics, dimensions, and the use of advanced formulas to transform PPC data across channels, locations, and currencies. The value of this feature cannot be understated as it enables marketing teams to:
- Customize reports to meet specific client needs or focus areas.
- Provide deeper insights into campaign performance across different platforms.
- Optimize marketing spend by identifying the most effective strategies and channels.
Automating Trend Detection with ChartMogul Data
The Octoboard Generated ChatGPT/OpenAI feature introduces a revolutionary way to stay ahead in marketing by automating the detection of data trends. Using ChartMogul metrics, this feature can analyze vast amounts of data to identify underlying trends, anomalies, or patterns that may not be immediately apparent. This capability is invaluable for marketing agencies and teams as it ensures:
- Continuous monitoring and updating of marketing strategies based on real-time data.
- The ability to proactively address potential issues before they impact the business.
- Enhanced decision-making processes through deeper insights into market dynamics and customer behavior.
Google Sheets Data Export for Enhanced Data Viewing
Octoboard also offers a Google Sheets data export feature, allowing marketing teams to send ChartMogul data directly to Google Sheets documents. This feature is particularly useful for teams that prefer to manipulate or view data in a familiar spreadsheet environment. It facilitates:
- Easy sharing and collaboration on data analysis tasks.
- Custom data manipulation or additional calculations that may not be available in the analytics platform.
- The creation of custom reports or dashboards that meet specific internal or client requirements.
The Bottom Line
The integration of ChartMogul metrics with Octoboard's analytics platform represents a significant leap forward in the way financial analytics are conducted and reported. By automating the generation of detailed reports, providing real-time insights, and offering advanced PPC analytics capabilities, Octoboard enables marketing teams to not only save valuable time but also to add strategic value to their work. The ability to monitor trends, generate data insights using AI, and export data to Google Sheets further enhances the platform's utility, making it an indispensable tool for marketing agencies aiming to stay at the forefront of industry innovation and performance.
Octoboard customers who created this report also used the following data templates:
Deals and Sellers Rankings
Key Salesforce Metrics

SalesForce Sales (Report)
Salesforce Deals and Leads
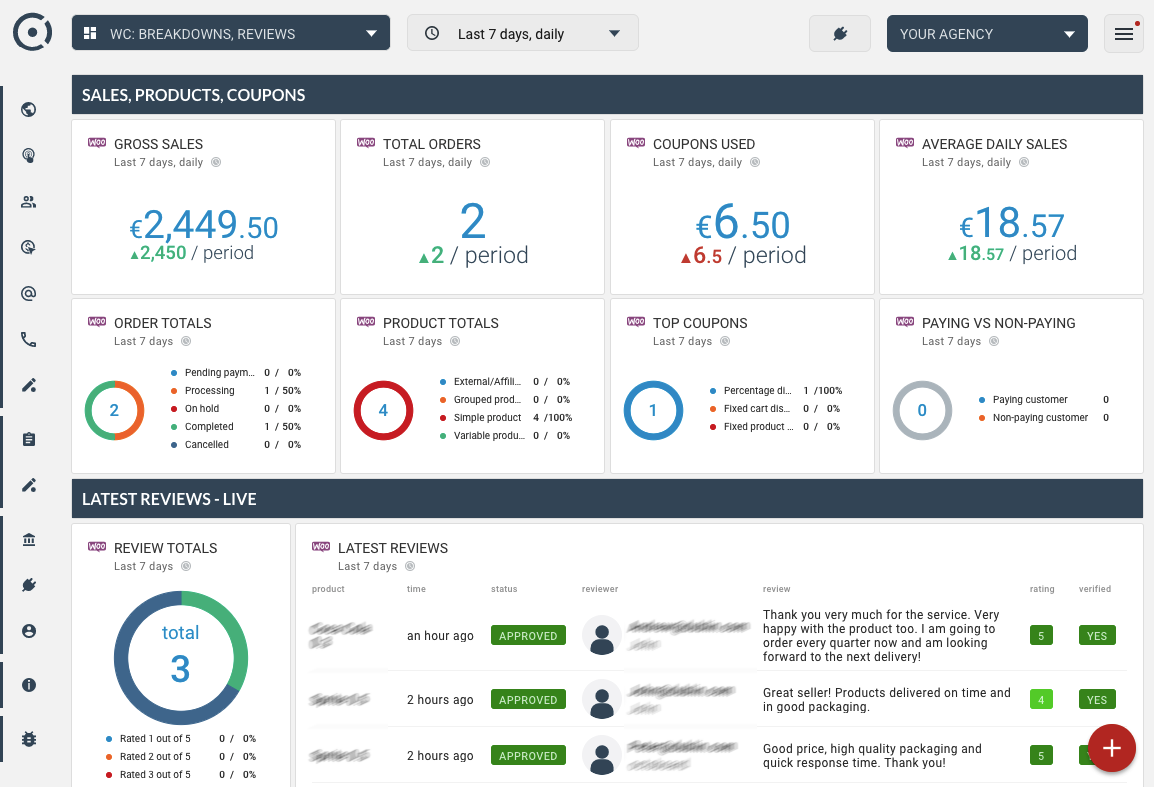
WooCommerce Breakdowns / Reviews
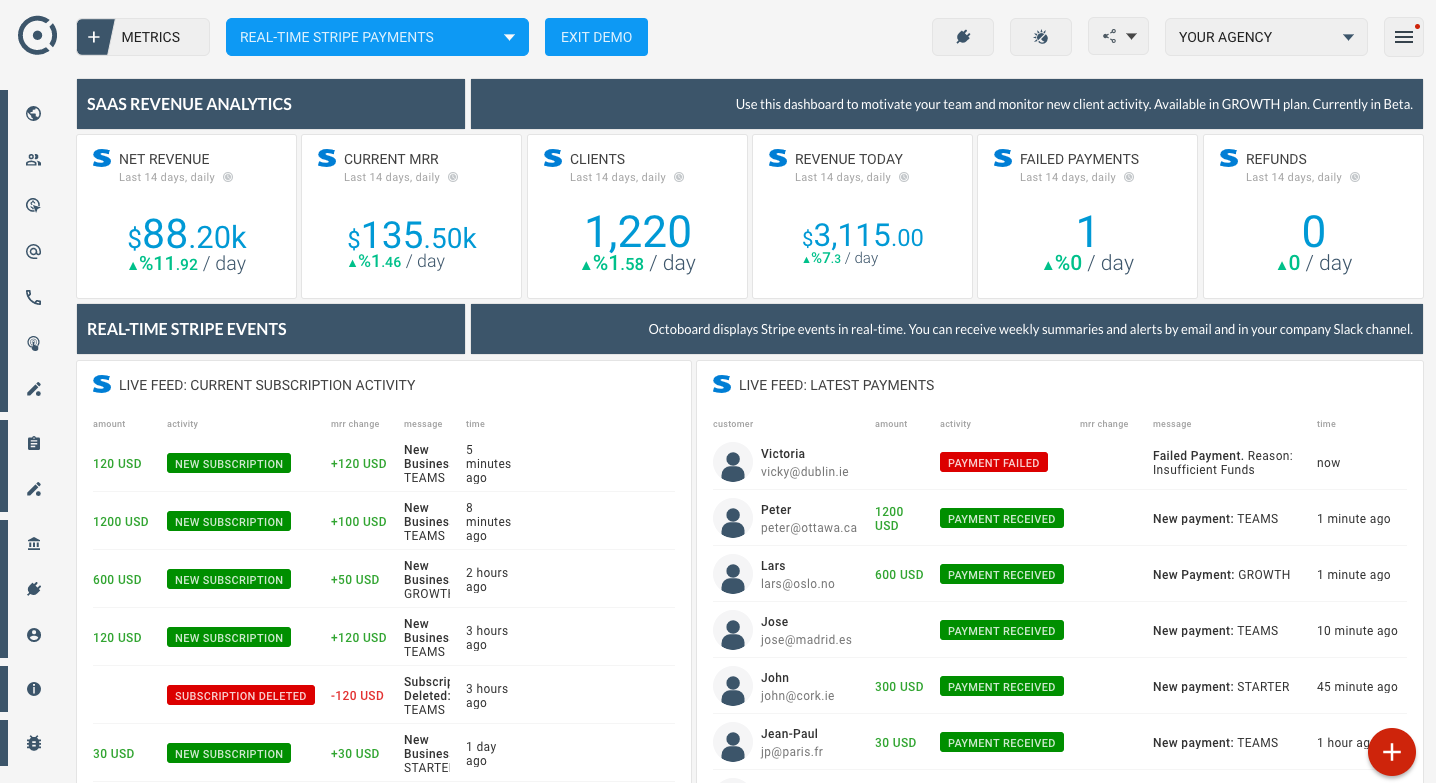
Real-Time Stripe payments
ChartMogul Startups metrics (Report)
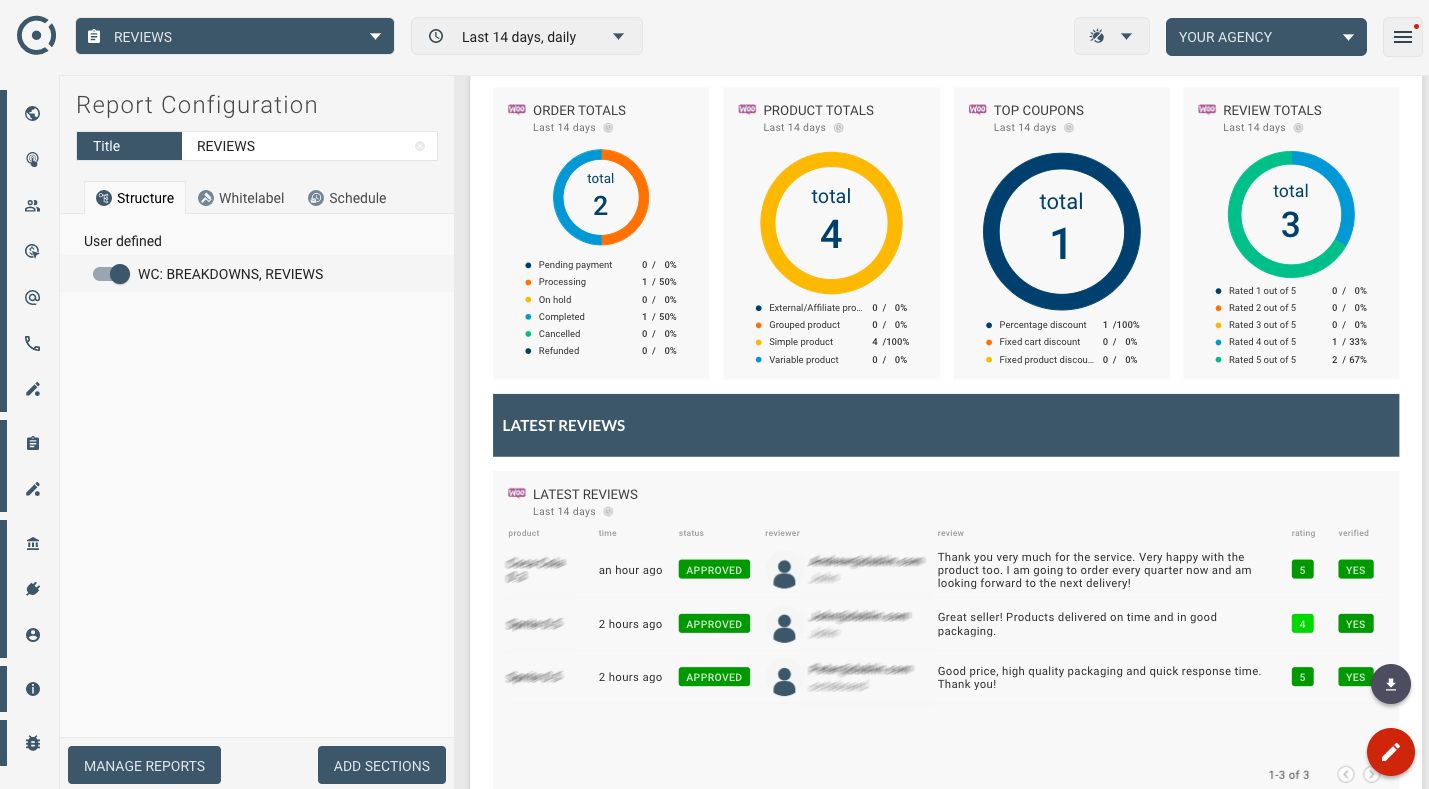
WooCommerce Breakdowns / Reviews (Report)
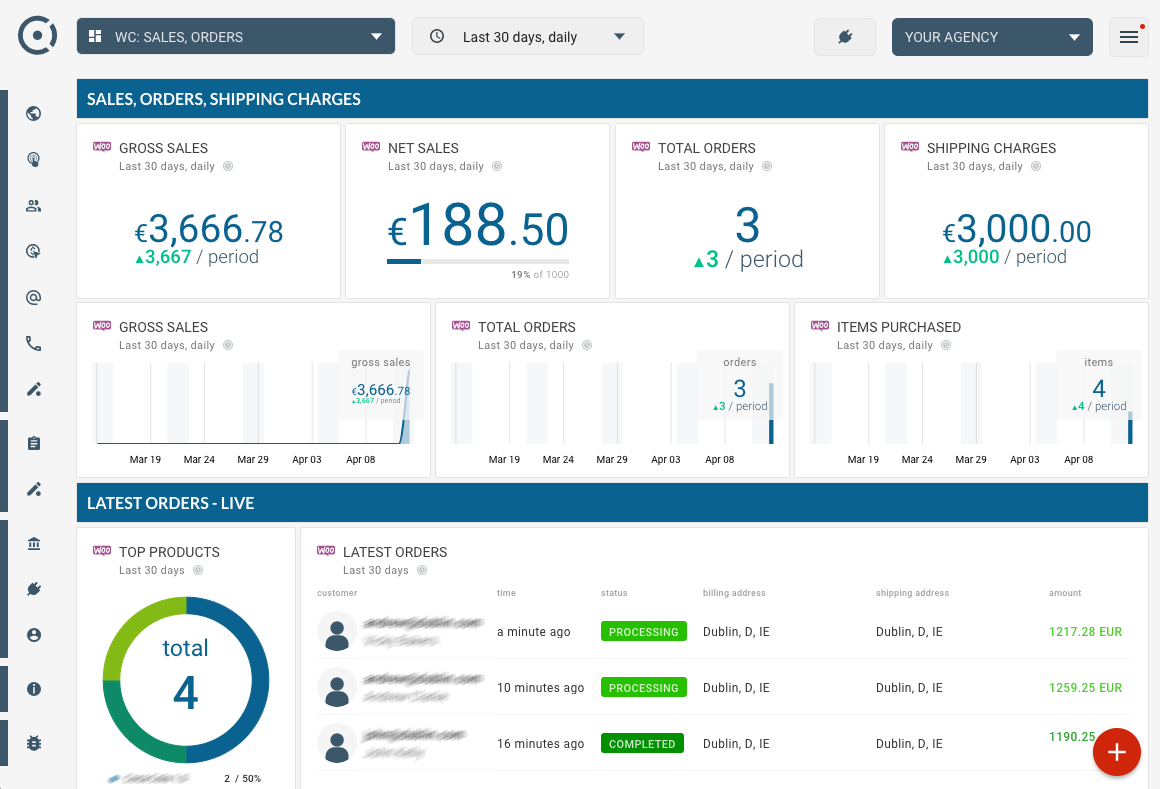
WooCommerce sales
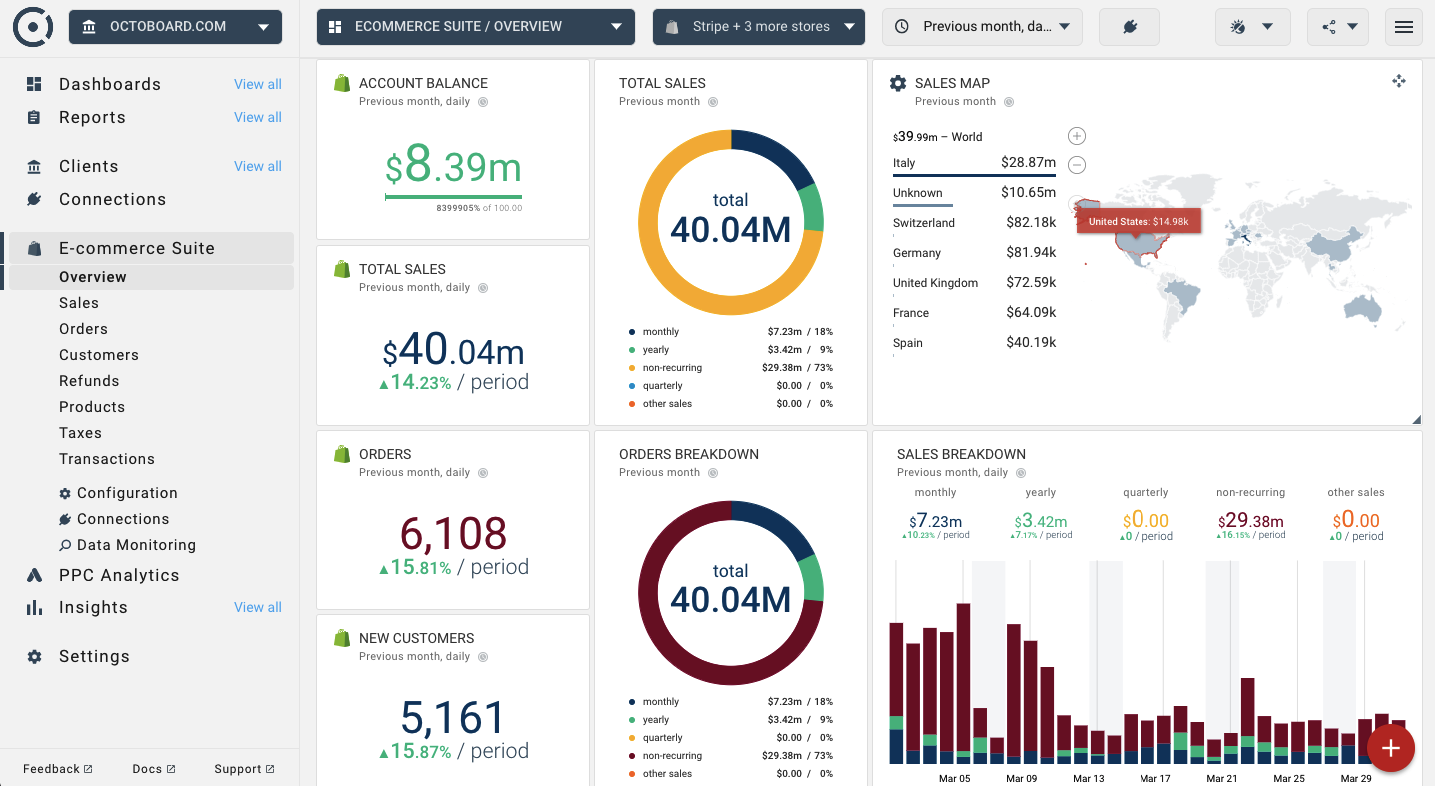
Google Analytics Ecommerce
WooCommerce sales (Report)