OCTOBOARD
English
PRICING
RESOURCES
LOGIN
TRIAL
TRIAL
English

How to add ChartMogul data to your business dashboard

With Octoboard you get easy access to ChartMogul data and combine it with your social media stats, web analytics, blog metrics, paid advertising and more.
Octoboard MarketingAnalytics Blog
OCTOBOARD: ChartMogul featured

How to add ChartMogul data to your business dashboard

ChartMogul builds a subscription analytics solution for SaaS businesses who use payment platforms such as Stripe, Braintree, PayPal and others. ChartMogul calculates recurring revenue metrics and KPIs for companies who sell products and services online.

ChartMogul

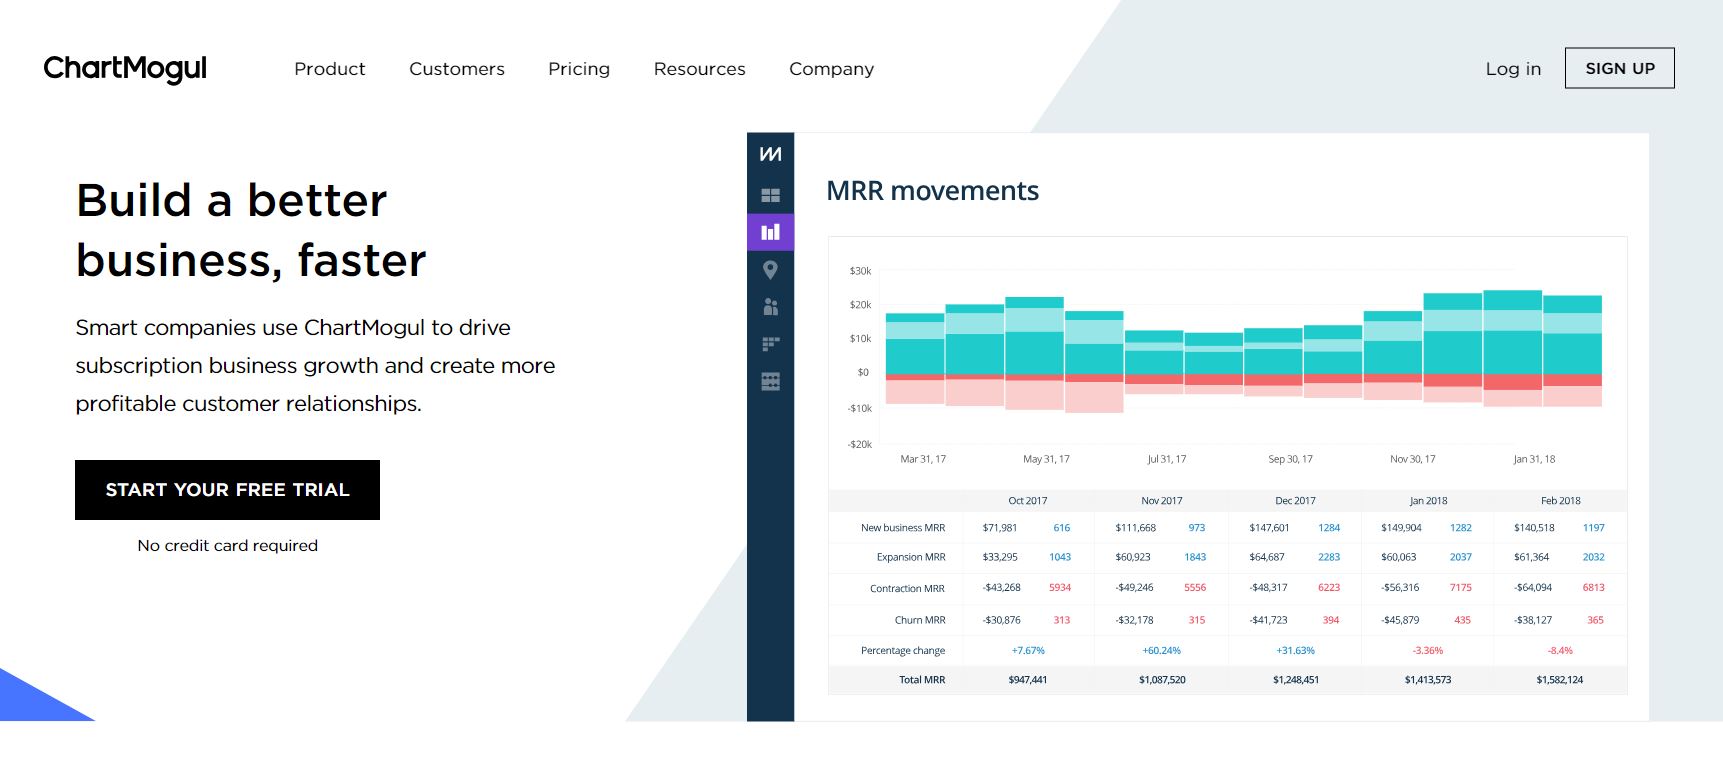
ChartMogul offers a range of statistics which fall into three main categories: management and investor metrics; sales, marketing, and customer success indicators; and finance data. Metrics can be broken down by geographic location, lead source, customer cohorts, different subscription plan types and other dimensions. Users can apply filters and custom stats to answer their specific business questions.

Key ChartMogul features

  • Data consolidation - you can connect multiple billing systems to ChartMogul.
  • Metrics Reporting

Revenue: Monthly Recurring Revenue, Annual Run Rate, Average Revenue Per Account and more.

Marketing and customer success statistics.

Finance: Gross Cash Flow, Net Cash Flow, Refunds.

  • Segmentation - compare different customer segments’ performance.
  • Cohort analysis - study behavior of particular customer groups.
  • Email Notifications - get notifications via email after setting up parameters and goals for your business.
  • Geo-mapping - study customer behavior in different countries.
  • Currency conversion - ChartMogul automatically converts the MRR amount to your account’s primary currency if a customer invoice is billed in a different currency.
Advanced customer analytics and segmentation for online store owners. Engage with your clients and grow your business!

Why Octoboard

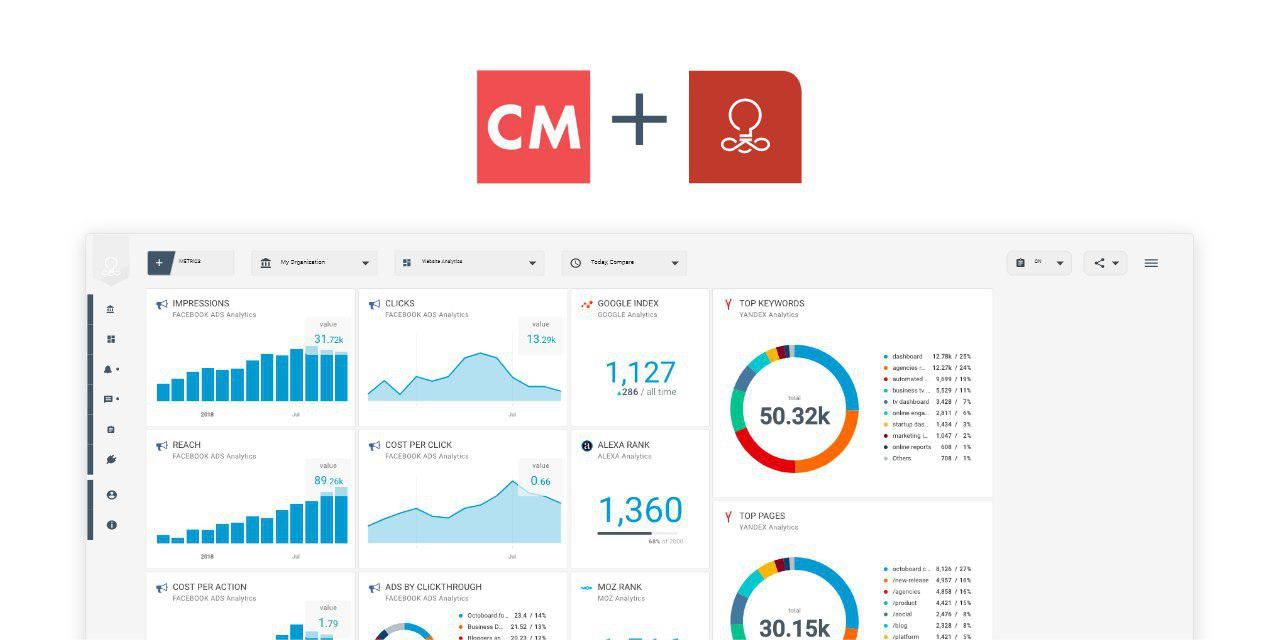
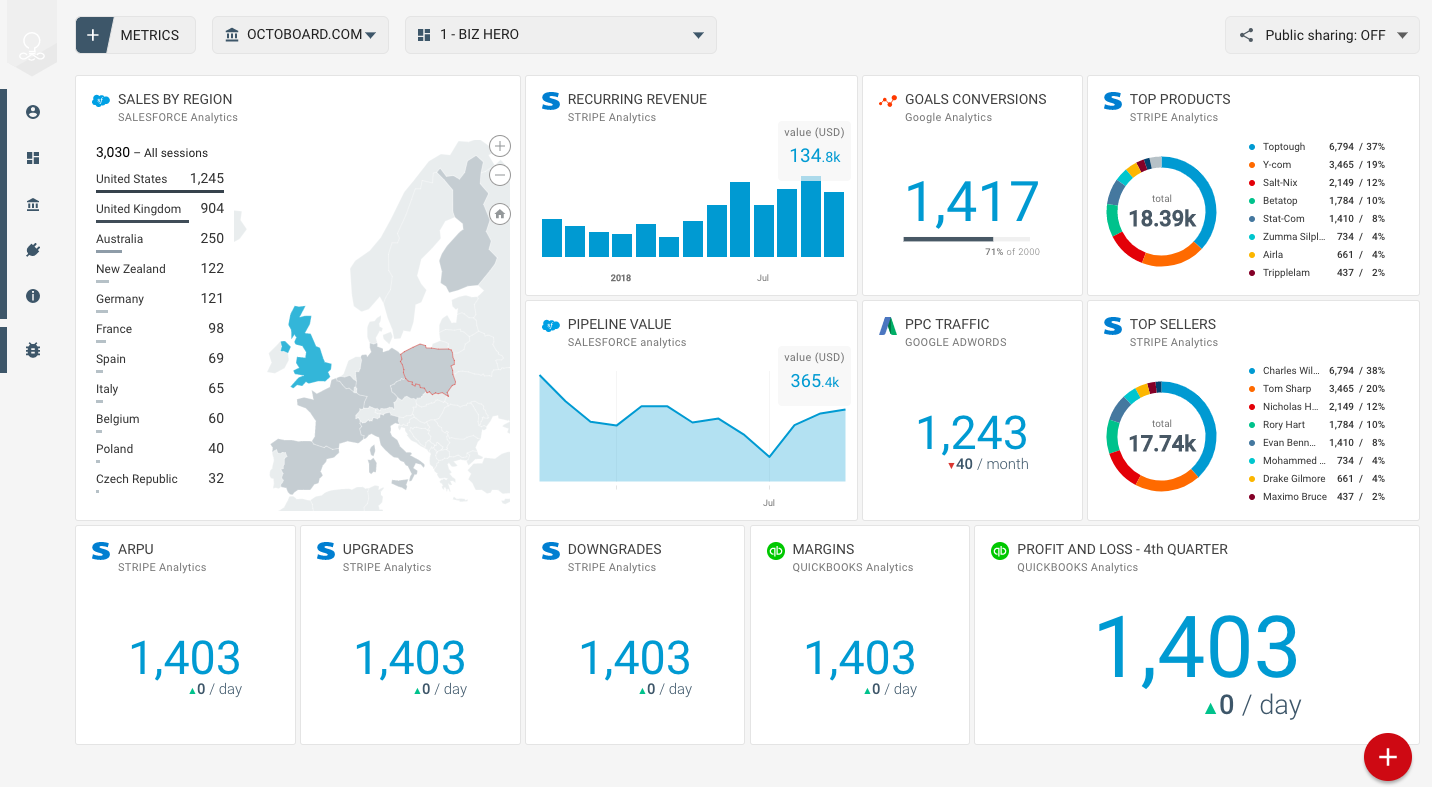
Octoboard gives businesses access to all their statistical data in dashboards and automated reports to teams and clients. With ChartMogul integration it becomes very easy to display and monitor your revenue statistics.

With Octoboard you can combine ChartMogul data with your social media data, web analytics, blog metrics, paid advertising KPIs from Google Analytics, Facebook, Twitter, Google AdWords and other cloud platforms.

Monitoring your business indicators becomes easier and faster with one unified view that updates automatically even after you log out from Octoboard.

You can share your key ChartMogul metrics with your team members or the whole organization - use our TV dashboard feature to present data in your office.

TV Mode Loop feature is now available to Octoboard users, allowing you to present different dashboards in one loop displaying data from ChartMogul, Google Analytics, Social Media, Google Sheets and other cloud platforms for a selected time period.

How to add ChartMogul data to a dashboard

To setup Octoboard-to-ChartMogul connection, follow 3 simple steps. It will only take 1 minute!

  • Connect to ChartMogul
  • Select ChartMogul metrics to display or use Octoboard templates
  • Add them to your dashboard

What ChartMogul data to monitor with Octoboard

Octoboard displays key ChartMogul data metrics:

  • ARR (Annual Run Rate)
  • ARPA (Average Revenue Per Account)
  • LTV (Customer Lifetime Value)
  • Customer Churn Rate
  • MRR (Monthly Recurring Revenue)
  • The number of Active Customers in your account.
  • ASP (Average Sales Price)
V1 biz hero 1

ChartMogul for investors template

Startups and investors use Octoboard's ChartMogul for investors template to communicate key financial figures. It makes it easy to regularly check the performance of their own or other companies. This is one more way to save time with Octoboard.

Track your key subscription metrics without effort and the need to log in different platforms all the time. Create business dashboards for your organization in minutes. Combine ChartMogul financial data with Sales, Marketing and Operations metrics. Join Octoboard today - it is free!

Start using your cloud data to grow sales, save cost and retain clients
GET OCTOBOARD FREE
Analyze and segment your customer base. Send effective email marketing campaigns and promotions with Octoboard.
How to analyze your data and increase sales with Octoboard
Customer and product analytics for E-commerce
Custom reports covering website visits, sales, lead generation, abandoned carts analysis, order, customer and product insights.
Octoboard ecommerce analytics
Business features include
 
Customer analytics
Customer segmentation
Email marketing features
ChatGPT data insights
YOU MAY ALSO LIKE
OCTOBOARD: Improve roas with advanced ppc analytics
Improve Your ROAS with Advanced PPC Analytics: A Quick Guide to Cross-Channel Reporting
Unlock the potential of your PPC campaigns with cross-channel reporting. Learn how the Octoboard platform can transform your ROAS through data-driven PPC analytics.
PPC Analytics | 15-06-2023
OCTOBOARD: Ecommerce performance metrics in automated reports
Mastering SaaS Reporting: Key Ecommerce Metrics, MRR, and Automated Insights
Supercharge your SaaS performance reporting with actionable insights from key ecommerce metrics and MRR. Discover how automating your reporting process can drive growth and optimize revenue generation for your SaaS startup.
E-Commerce Analytics | 13-06-2023
OCTOBOARD: How to use your Stripe finance metrics
How to use your Stripe finance metrics?
Tips on how to use Octoboard dashboards to monitor your finance and billing metrics for Stripe. Use it now for free!
E-Commerce Analytics | 07-05-2022
OCTOBOARD: Facebook social media dashboard
Social Media Dashboard for Facebook Released
Explore our guide on utilizing the Facebook Marketing Dashboard for effective marketing strategies. Gain insights on essential metrics and practical tips to improve your brand's online presence and engagement.
Marketing Reports | 01-05-2022
OCTOBOARD: QuickBooks template for business
QuickBooks Overview template for business
Octoboard launches QuickBooks Overview template where all the essential metrics are combined for you to easily access your finances online.
Marketing Reports | 14-01-2022
OCTOBOARD: How to add Google Sheets data to business dashboard
How to add Google Sheets data to business dashboard
Use Octoboard integration with Google Sheets for your online business dashboard - new possibilities for Octoboard users. Try it now for free!
PPC Analytics | 09-01-2022
OCTOBOARD: How to use SendGrid data in Startup dashboard
How to use SendGrid data in Startup dashboard
Start using the metrics to successfully manage your SendGrid email marketing campaign. It's simple and free with Octoboard!
Marketing Reports | 04-01-2022
OCTOBOARD: MailChimp metrics
How to improve your MailChimp email marketing campaign - top metrics to use
Try out Octoboard's free dashboard and templates to improve MailChimp email marketing campaign using visualised all-in-one-place metrics.
Marketing Reports | 03-01-2022
OCTOBOARD: Twitter social media dashboard
Social Media Dashboard for Twitter Released
Octoboard adds Twitter Digital Media Dashboard to its Free Social suite. Use dashboard metrics to monitor your social network activity.
Marketing Reports | 02-01-2022