New product coming up soon - investor dashboard and startup reports

Today we are adding support for Facebook to our Free Social Media Dashboard. There is a lot of metrics and KPIs in Facebook analytics. It can be difficult to understand or organise them to get value. KPIs on their own are just numbers in a graph and we should try and turn them into insights (useful information that tells you something valuable).
We have put a lot of effort into making sure information is understood easily. Instead of teaching you how to create widgets or graphs, or writing complicated manuals, we invested into user-friendly interface. Adding new data to your dashboard takes just 2 steps:
- Connect to Facebook
- Select and add widgets (our pre-created graphs and charts)
You should add two more steps to make your dashboard really useful. Here they are:
- Ask practical questions (more on this below)
- Start getting insights
We have organised and grouped widgets together. In our Free Social Edition we have limited their number to avoid confusion, yet we selected metrics that are practical - easy to use and helpful to follow every day.
To help you get from graphs and numbers to insights (useful information that tells you something valuable), we have put together a short guide or questions you should ask Facebook daily.
Below are some of the questions and metrics groups that we have put together:
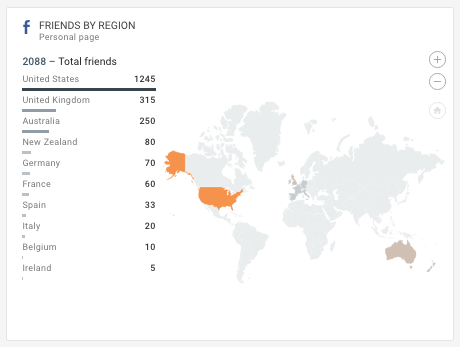
- Audience - set of metrics that tell you what kind of people visit your Facebook page
- Popularity - is my Facebook account gaining popularity over time?
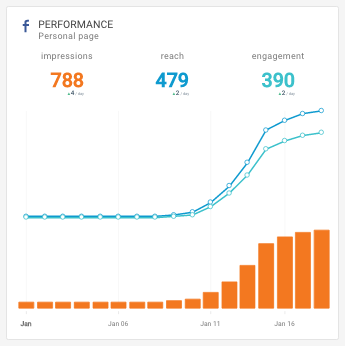
- Reach - "how far" does your Facebook content go? How many people see it and how often?
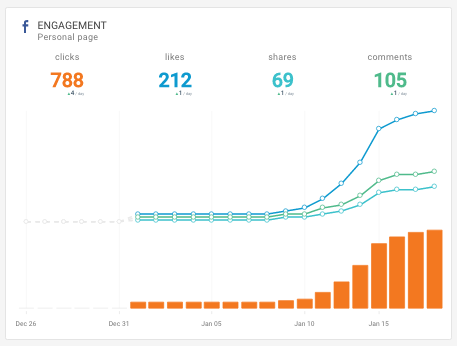
- Engagement - do my visitors engage with my Facebook content (comment on it, like it, and so on)?
- Paid vs Organic - how much of your traffic comes from Facebook Ads?
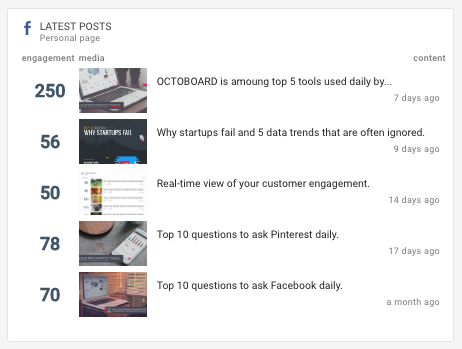
- Viral content - how viral is my content. Do people share and spread it further?
Check out our Facebook metrics guide and keep these practical questions in mind when you are looking at data. A graph, chart or map that does not help you in a practical way or does not answer an important question is probably not worth displaying in a dashboard.