OCTOBOARD
English
PRICING
RESOURCES
LOGIN
TRIAL
TRIAL
English

How to use TV Loops in your office dashboard

A TV Dashboard is a tool used to display key business metrics in real-time on a screen in an office. Use it with TV Loops feature from Octoboard.
Octoboard MarketingAnalytics Blog
OCTOBOARD: How to use TV Loops in your office dashboard

How to use TV Loops in your office dashboard

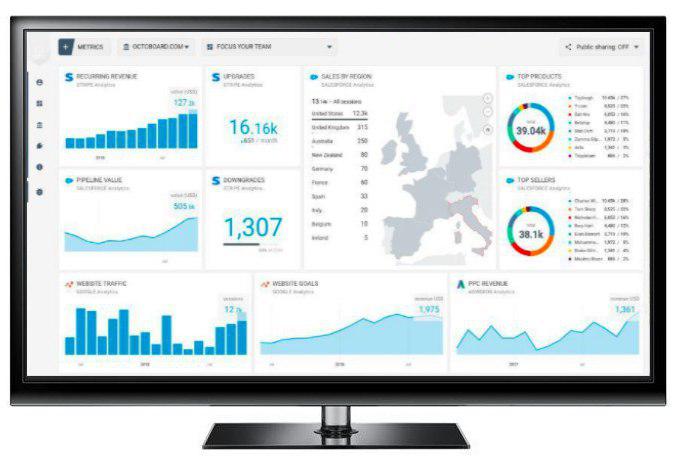
A TV Dashboard is a tool used to display key business metrics in real-time on a TV screen in an office. They are monitors that continuously display your performance data. This monitoring tool presents KPIs so that team members are able to visualize their productivity and targets at any time.

TV dashboard

Why companies use TV dashboards

Thousands of companies use TV dashboards in their offices to ensure data accessibility, drive discussions and real-time business decisions without having to set up meetings or spend hours and hours on reporting. TV Dashboards improve teamwork in the workplace. They drive communication on business performance. And that is exactly what businesses need - focus the teams on KPIs and goals.

Save time by automating your reports, grow revenue and retain customers with Octoboard.

How to set up an effective TV dashboard

Select valuable metrics

TV Dashboards with carefully selected metrics give businesses a clear view into their KPIs and allow all employees to have a better understanding of their performance in accordance with business goals.

Choose a good spot

This should go without saying. Your TV dashboard should have good visibility within the office or a department.

Pick a dashboard solution like Octoboard

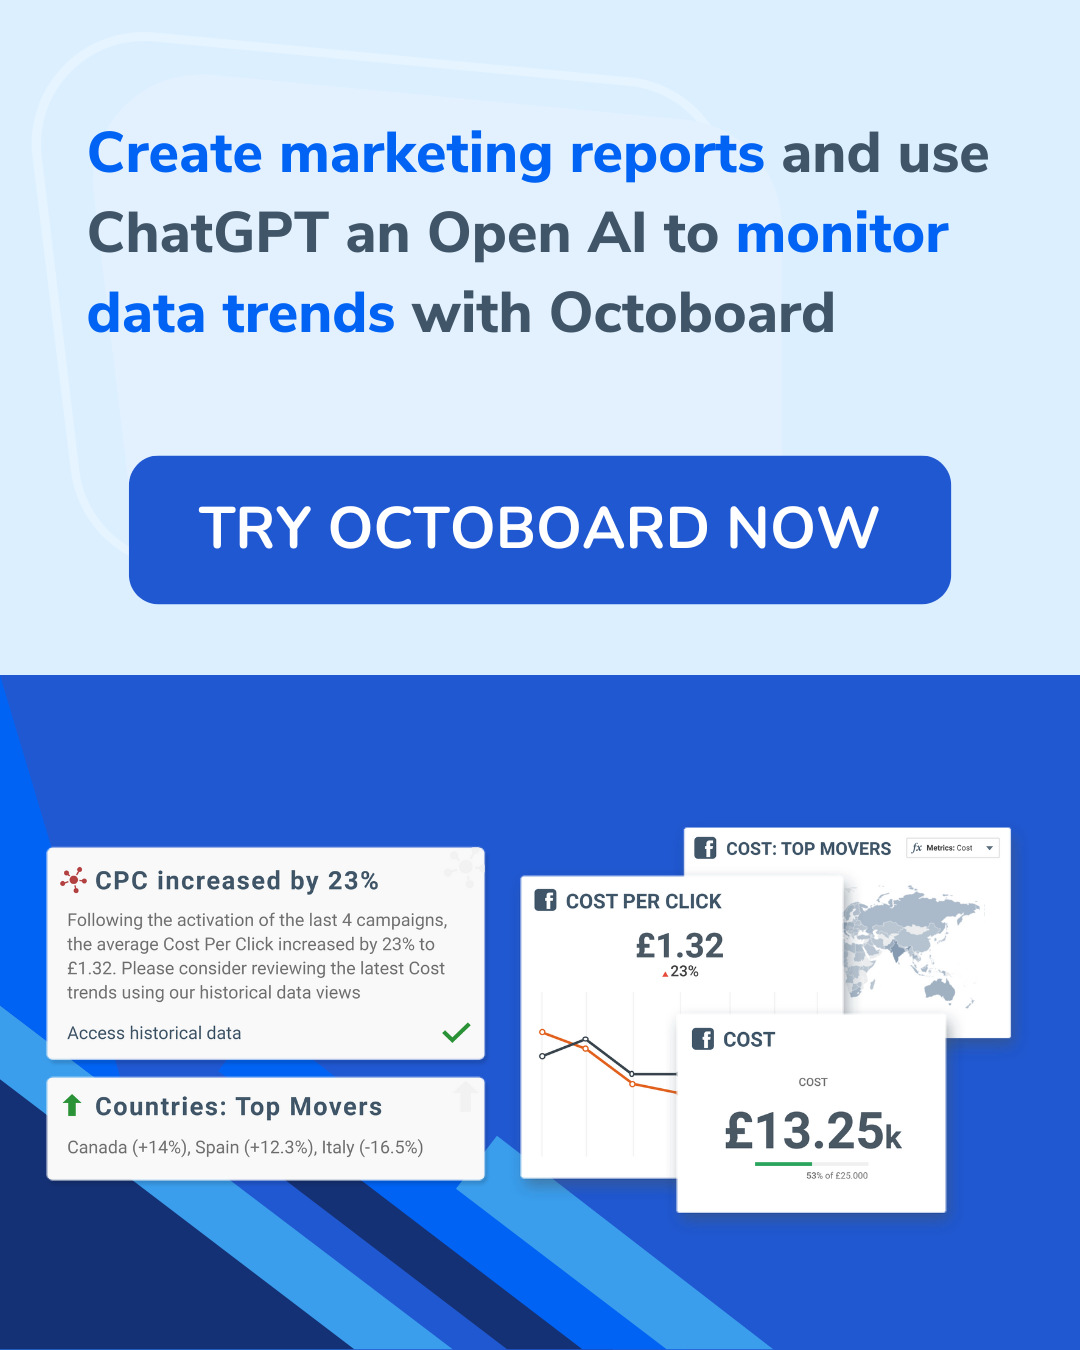
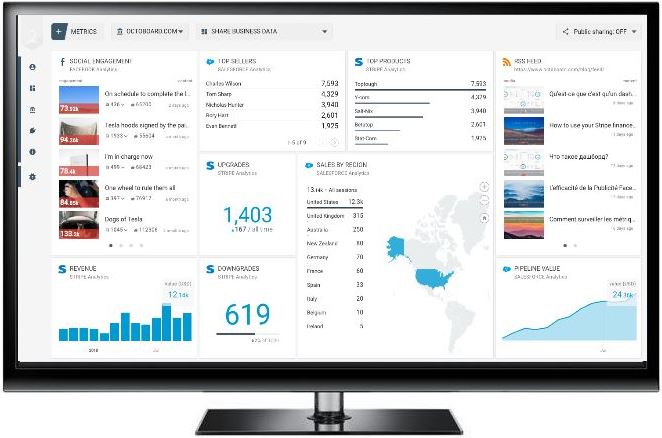
Choose an all-in-one dashboard solution like Octoboard. We visualize 1200+ metrics from Social media, Web Analytics, Paid Advertising, Finance Services an a lot more to save your time, make information accessible and easy to turn into trends and insights. Start to explore your data and display it on screens with our TV Mode feature.

TV dashboard

Use TV loops

TV loops

Our new feature, Dashboard TV Loops cycle through KPI dashboards that you select. It is especially useful when you want to display data for different teams on one screen. Also, it is a good idea to keep all the employees informed of what is going on in other departments. As mentioned before, it helps unite all the people in the company on business goals.

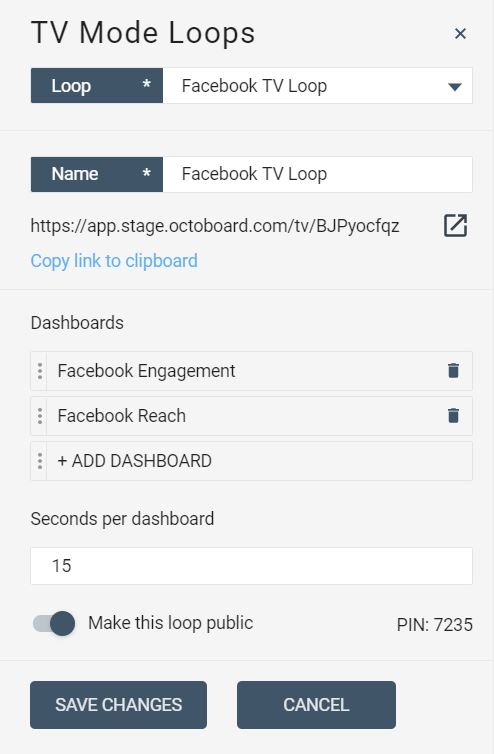
Octoboard dashboard TV loops allow you to create a single link that cycles through different dashboards that you choose, displaying each dashboard for a

selected time interval. You can configure the time each dashboard is displayed and create secure loops with PINs.

How to create a TV loop

  • Connect to Octoboard and choose TV MODE LOOPS
  • Choose a loop or create a new one.
  • Name your loop.
  • Copy link to it to display it on a TV screen.
  • Add dashboards to your loop.
  • Drag and drop dashboards to set the order you want them to appear in.
  • Set the number of seconds you want each dashboard to be displayed.
  • You can make your loop private or public. Public loops are secured with a PIN.

Using a TV dashboard is a great way to keep key performance metrics in your team's mind. Displaying dashboards demonstrates the importance of these KPIs. Make your business and people in it data-driven with TV dashboards from Octoboard. Start now with our free plan!

Start using your cloud data to grow sales, save cost and retain clients
GET OCTOBOARD FREE
Monitor your ad spend budget, save costs and increase your paid advertising ROI with Octoboard.
How can Octoboard help you use your data
Automate marketing reports and dashboards
Watch budgets and measure effectiveness of every dollar spent on paid advertising.
Automated marketing reports
Business features include
 
Automated reporting
Keyword rank tracker
Send data to Google Sheets
B2B lead generation
White label client portal
Send data to BigQuery
ChatGPT data insights
YOU MAY ALSO LIKE
OCTOBOARD: Mastering cross channel ppc advertising analytics
Mastering Cross-Channel PPC Advertising Analytics: Top Metrics for Google Ads, Facebook Ads, Tiktok, Snapchat, Criteo reporting
Uncover the power of Cross-Channel Reporting in optimizing your paid advertising efforts across multiple platforms. How to use paid advertising analytics platforms such as Octoboard to build multi-channel PPC reports.
PPC Analytics | 25-04-2024
OCTOBOARD: Maximizing ecommerce performance
Using E-commerce data analytics platform: Analyzing Stripe and WooCommerce data
Discover how E-commerce Analytics can boost your online business performance with insights from E-commerce analytics platform such as Octoboard that use Stripe and WooCommerce data.
E-Commerce Analytics | 10-04-2024
OCTOBOARD: How to automate seo reports
How to automate SEO reports for marketing agency clients
Tailor your SEO reports to meet the unique needs and preferences of each client effectively. Learn about the essential metrics that should be included in your SEO reports for optimal marketing performance tracking.
Marketing Reports | 31-03-2024
OCTOBOARD: Improve roas with advanced ppc analytics
Improve Your ROAS with Advanced PPC Analytics: A Quick Guide to Cross-Channel Reporting
Unlock the potential of your PPC campaigns with cross-channel reporting. Learn how the Octoboard platform can transform your ROAS through data-driven PPC analytics.
PPC Analytics | 15-06-2023
OCTOBOARD: Ecommerce performance metrics in automated reports
Mastering SaaS Reporting: Key Ecommerce Metrics, MRR, and Automated Insights
Supercharge your SaaS performance reporting with actionable insights from key ecommerce metrics and MRR. Discover how automating your reporting process can drive growth and optimize revenue generation for your SaaS startup.
E-Commerce Analytics | 13-06-2023
OCTOBOARD: Facebook social media dashboard
Social Media Dashboard for Facebook Released
Explore our guide on utilizing the Facebook Marketing Dashboard for effective marketing strategies. Gain insights on essential metrics and practical tips to improve your brand's online presence and engagement.
Marketing Reports | 01-05-2022
OCTOBOARD: How to use SendGrid data in Startup dashboard
How to use SendGrid data in Startup dashboard
Start using the metrics to successfully manage your SendGrid email marketing campaign. It's simple and free with Octoboard!
Marketing Reports | 04-01-2022
OCTOBOARD: MailChimp metrics
How to improve your MailChimp email marketing campaign - top metrics to use
Try out Octoboard's free dashboard and templates to improve MailChimp email marketing campaign using visualised all-in-one-place metrics.
Marketing Reports | 03-01-2022
OCTOBOARD: Twitter social media dashboard
Social Media Dashboard for Twitter Released
Octoboard adds Twitter Digital Media Dashboard to its Free Social suite. Use dashboard metrics to monitor your social network activity.
Marketing Reports | 02-01-2022