OCTOBOARD
English
LOGIN
English
Best automated PostgreSQL reports
Build automated marketing reports for your analytics teams and clients using PostgreSQL data.
Automate PostgreSQL reports and dashboards
Connect PostgreSQL data and create automated reports and dashboards

Business features include
Automated PostgreSQL reporting
Automated reporting
Keyword rank tracker
Send data to Google Sheets
B2B lead generation
White label client portal
Send data to BigQuery
ChatGPT data insights
DATABASE REPORTING TOOL / POSTGRESQL
POSTGRESQL REPORTING
PostgreSQL database connection.
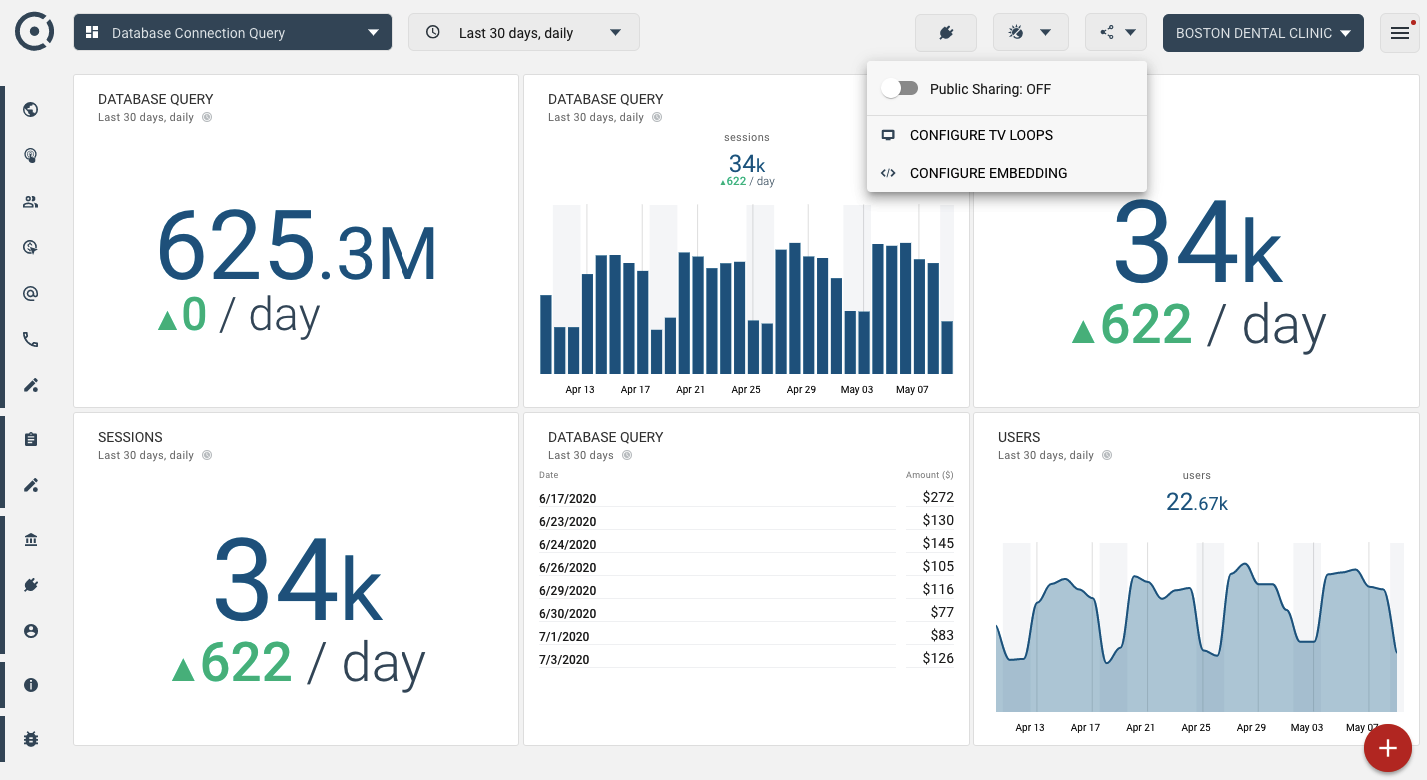
Use this PostgreSQL database connection to add historical data widgets, pie charts and numeric widgets to Octoboard business performance dashboards, automated reports and white label client portals.
For more details on how to connect your database to Octoboard please visit this Knowledge Base post.
Notes
Please use standard PostgreSQL connection parameters - database name, host name, ip address, port, login details and security settings.
PostgreSQL metrics
POSTGRESQL NUMERIC
PostgreSQL Numeric widget
Description
This widget displays a single numeric value. SQL statement should return a single column. The very first value will be read and displayed in the widget. In the following example, SQL statement returns population of USA:
SELECT population FROM countries WHERE country="USA"
USE THIS METRIC
POSTGRESQL CATEGORY
PostgreSQL Category data widget
Description
Category widget displays values in tables or pie charts. SQL statement should return two columns. First column should contain category name, second column should return numeric values.
In the following example, SQL statement retrieves country names and country population. Pie chart will display countries ranked by population size:
SELECT country, population FROM countries
USE THIS METRIC
POSTGRESQL HISTORICAL
PostgreSQL Historical data widget
Description
Historical data widget displays historical data in a column, line or area graph. SQL statement is expected to return two columns. The first column should have dates, second one should have values.
In the following example, SQL statement retrieves shares price for Apple.
SELECT date, price FROM stock WHERE ticker="AAPL"
Make sure you sort results by date. Sequence of returned data raws is important. The platform will display first 1000 rows that it retrieves.USE THIS METRIC
Get more value out of your cloud data. Start using performance metrics now. GET OCTOBOARD FREE