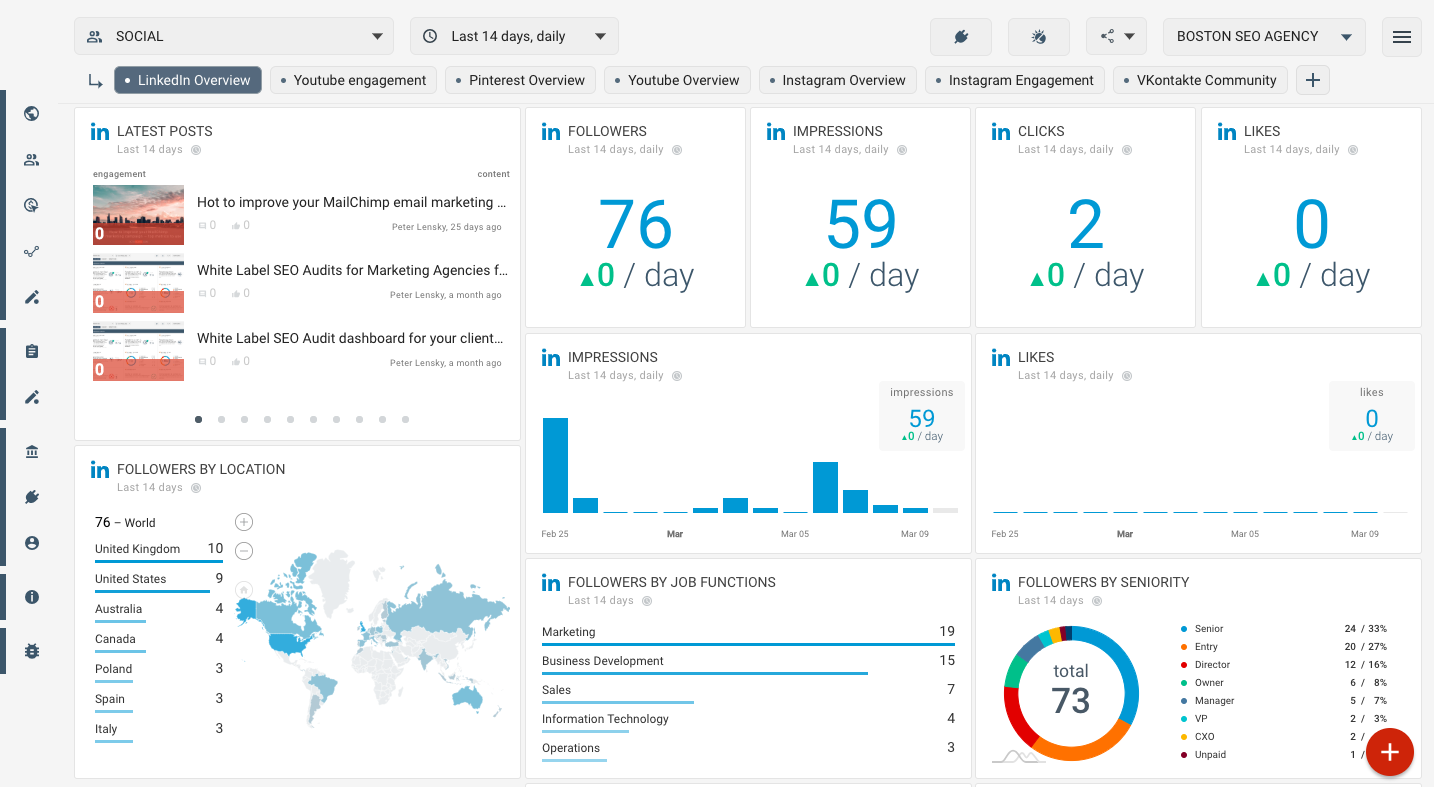
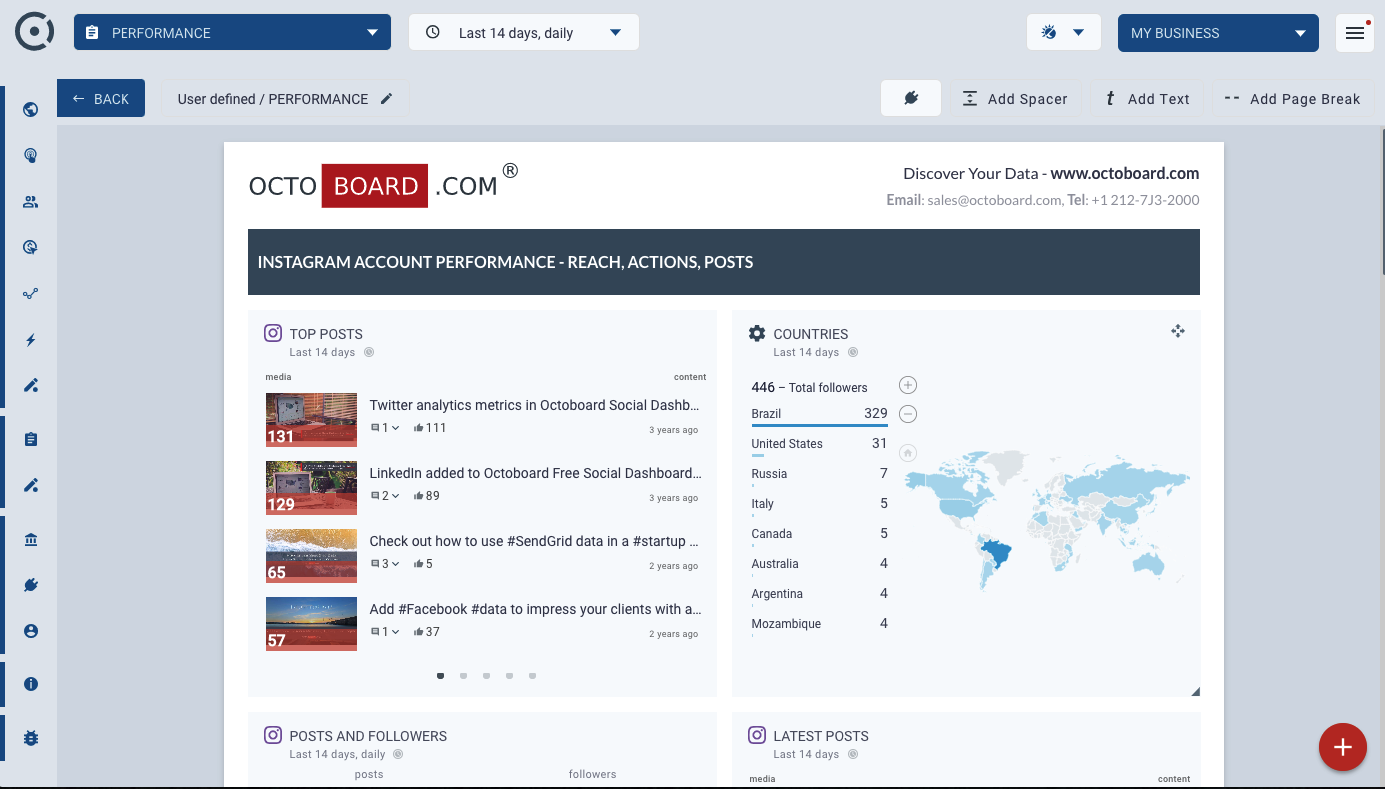
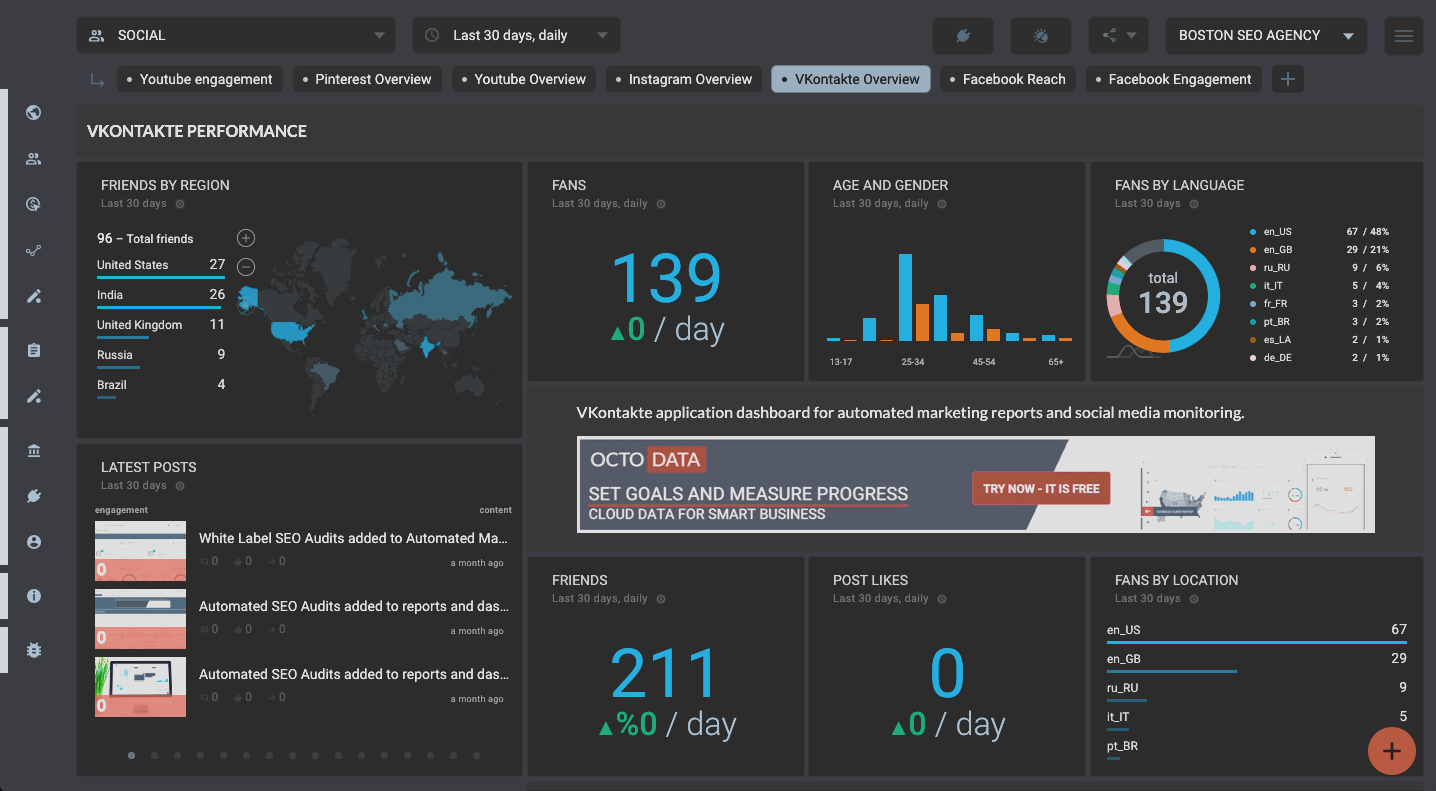
Best social media reporting tool for marketing teams
Automate social media reports, dashboards, and data portals for marketing teams and clients.

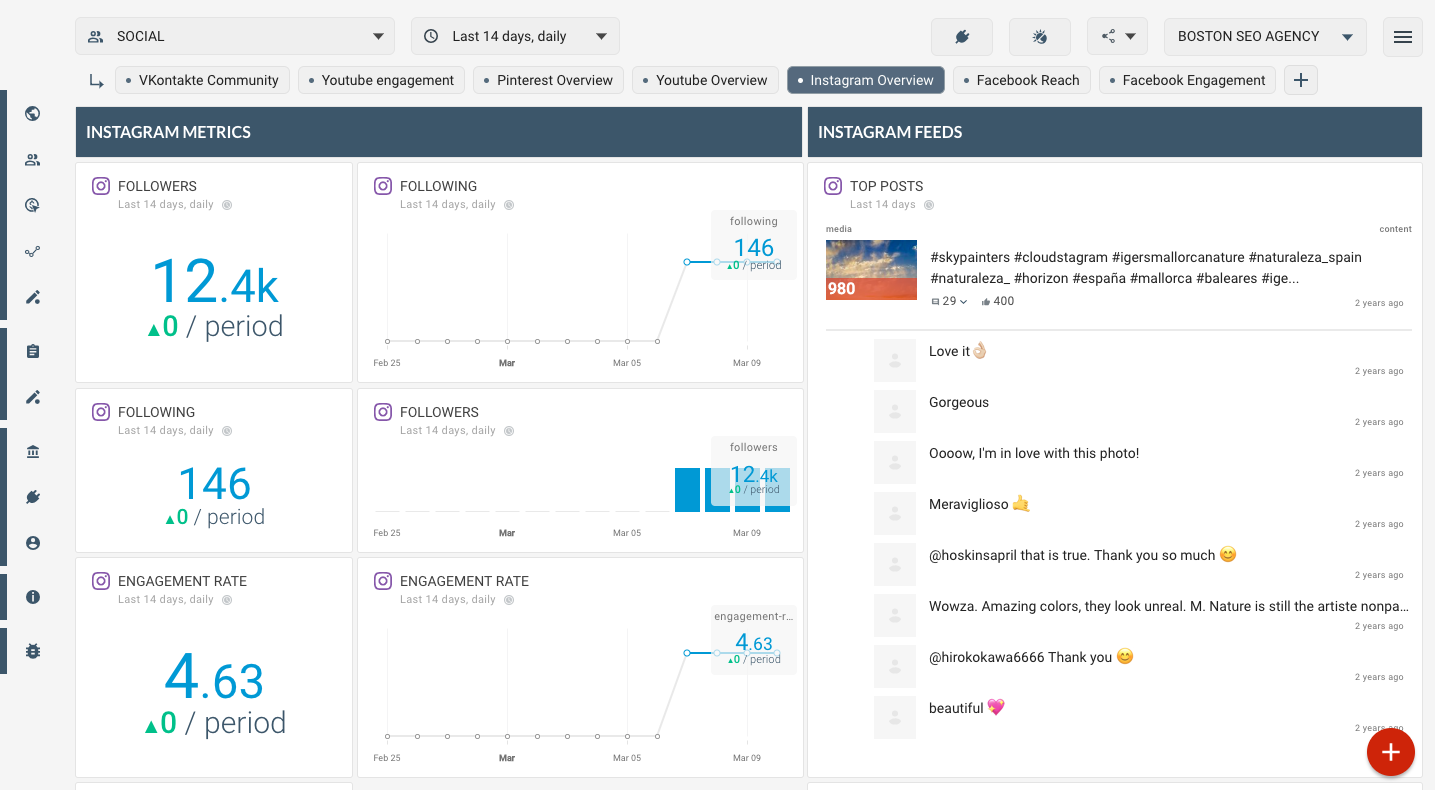
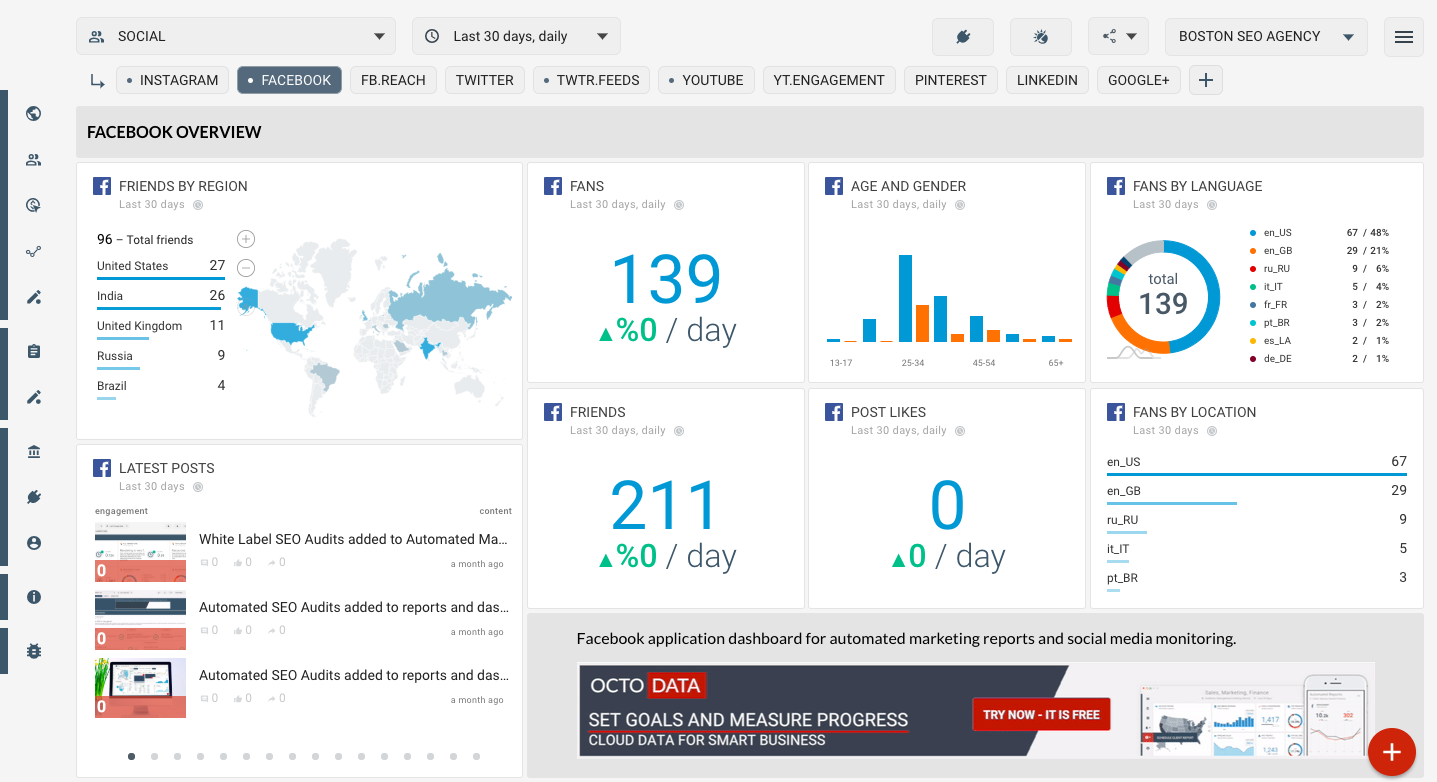
Never Miss A Conversation
Watch engagement signals from social networks, mentions, and blog comment feeds. Engage timely with your readers!
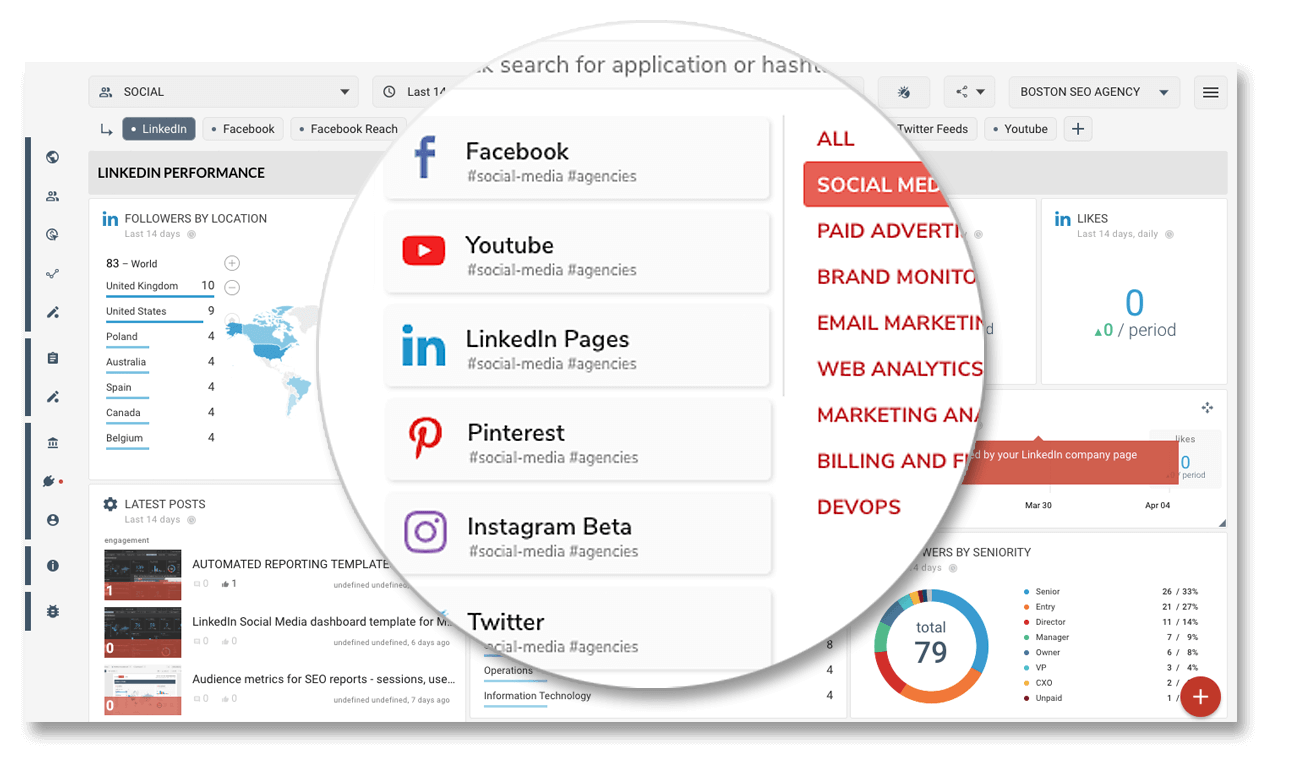
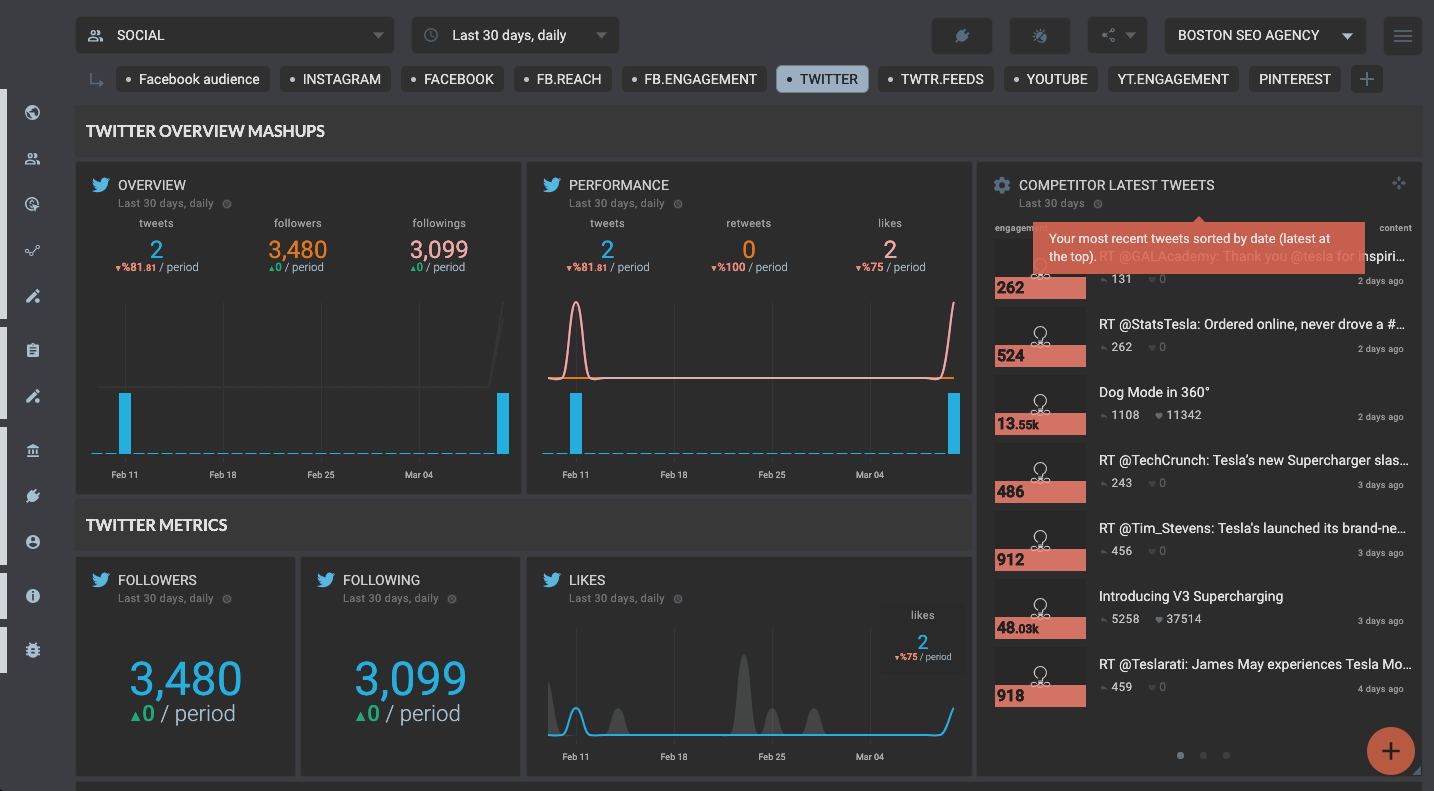
Monitor Competition
Setup competitor dashboard, find our what works, learn marketing and social tactics from the best.
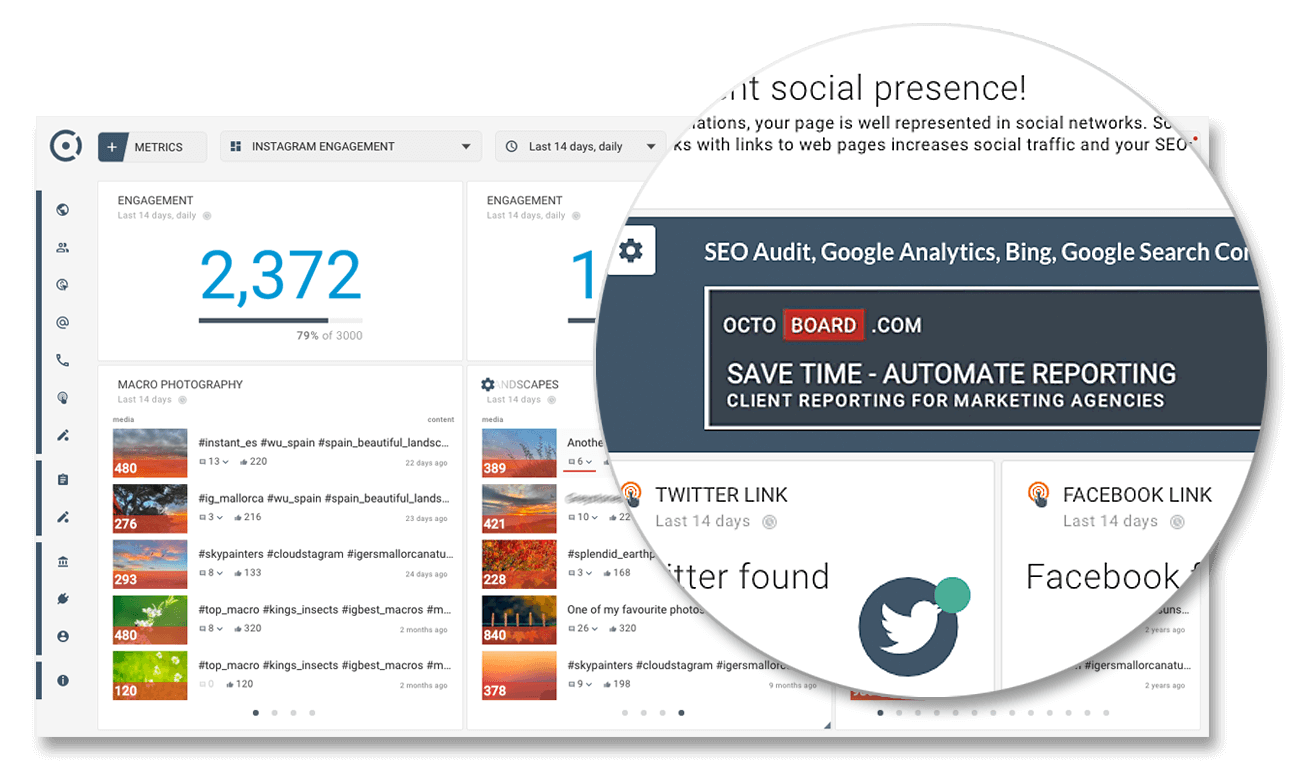
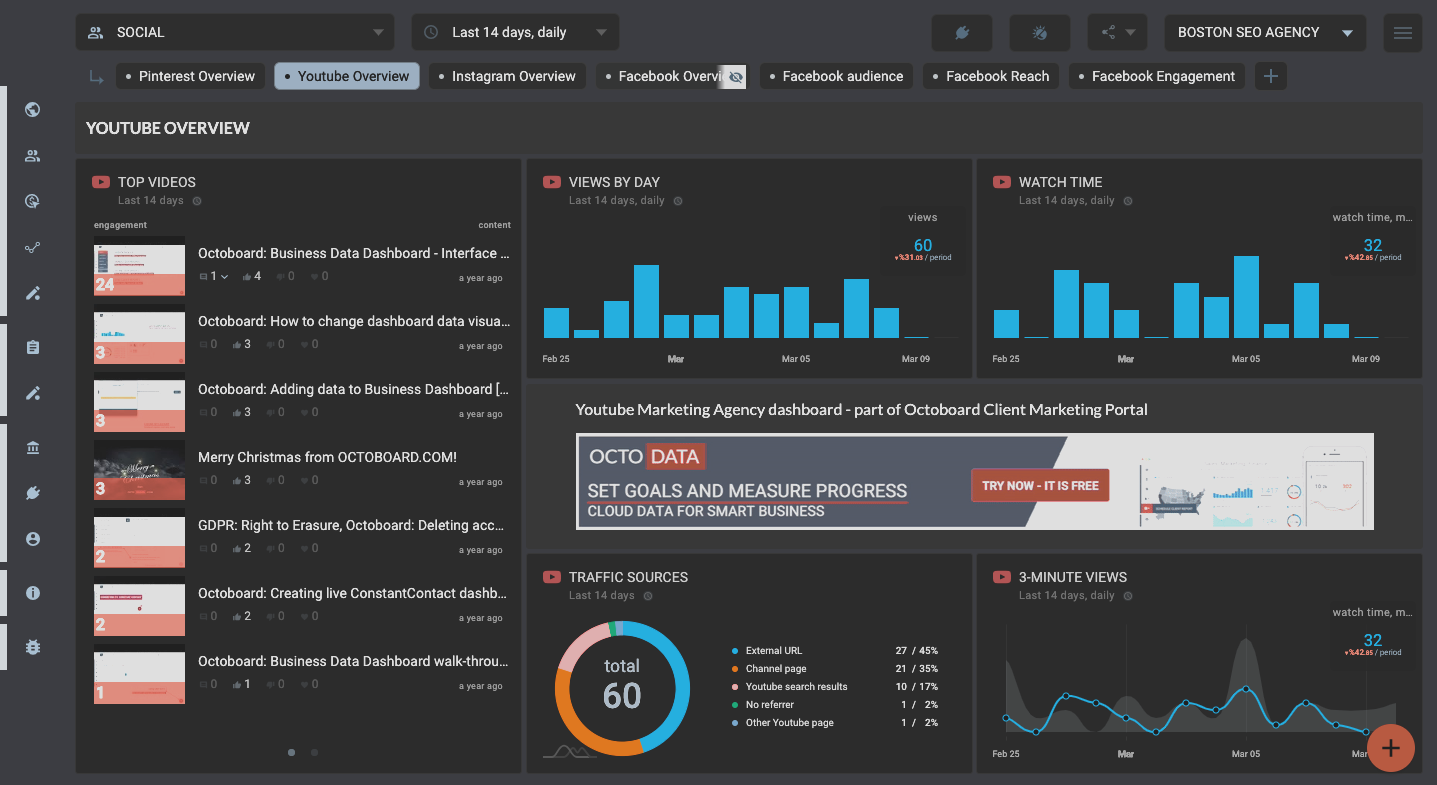
Stay on Top of Latest Trends
Add RSS feeds, Google news, Twitter search and always be informed of the latest trends in the industry
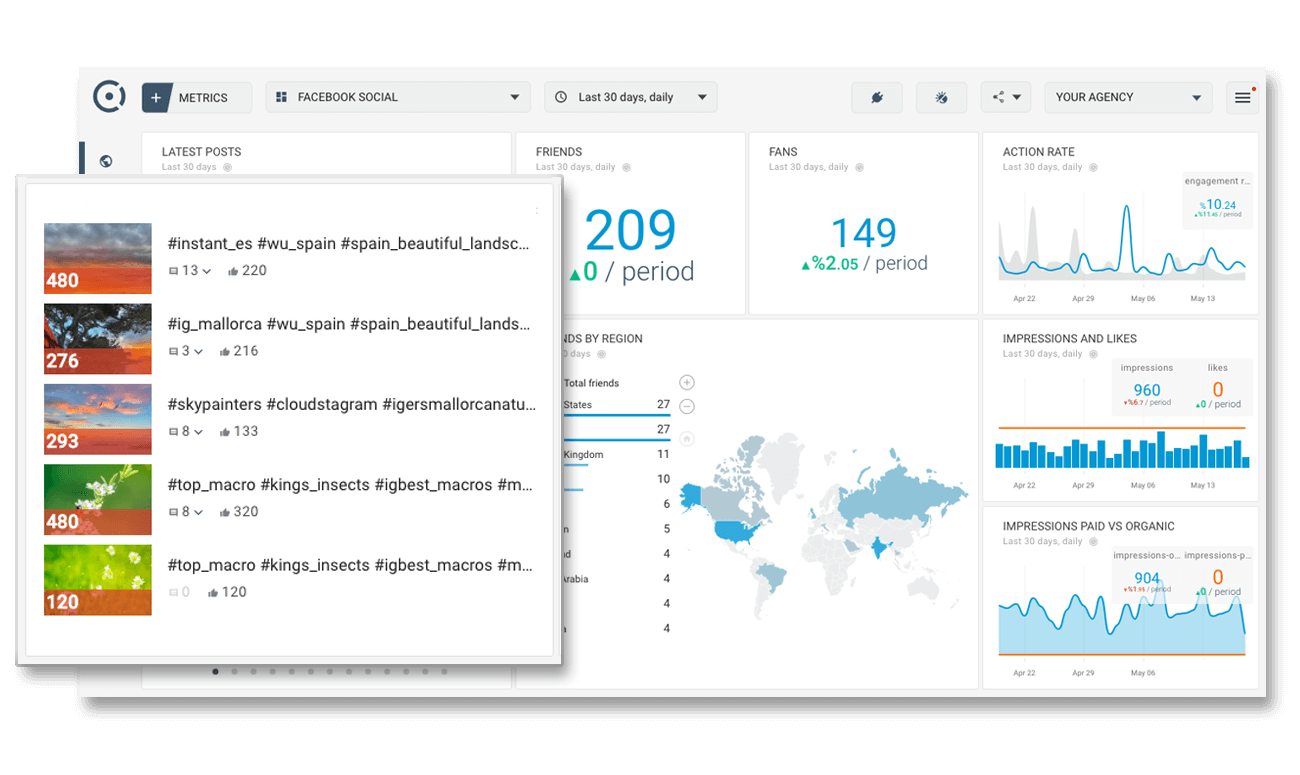
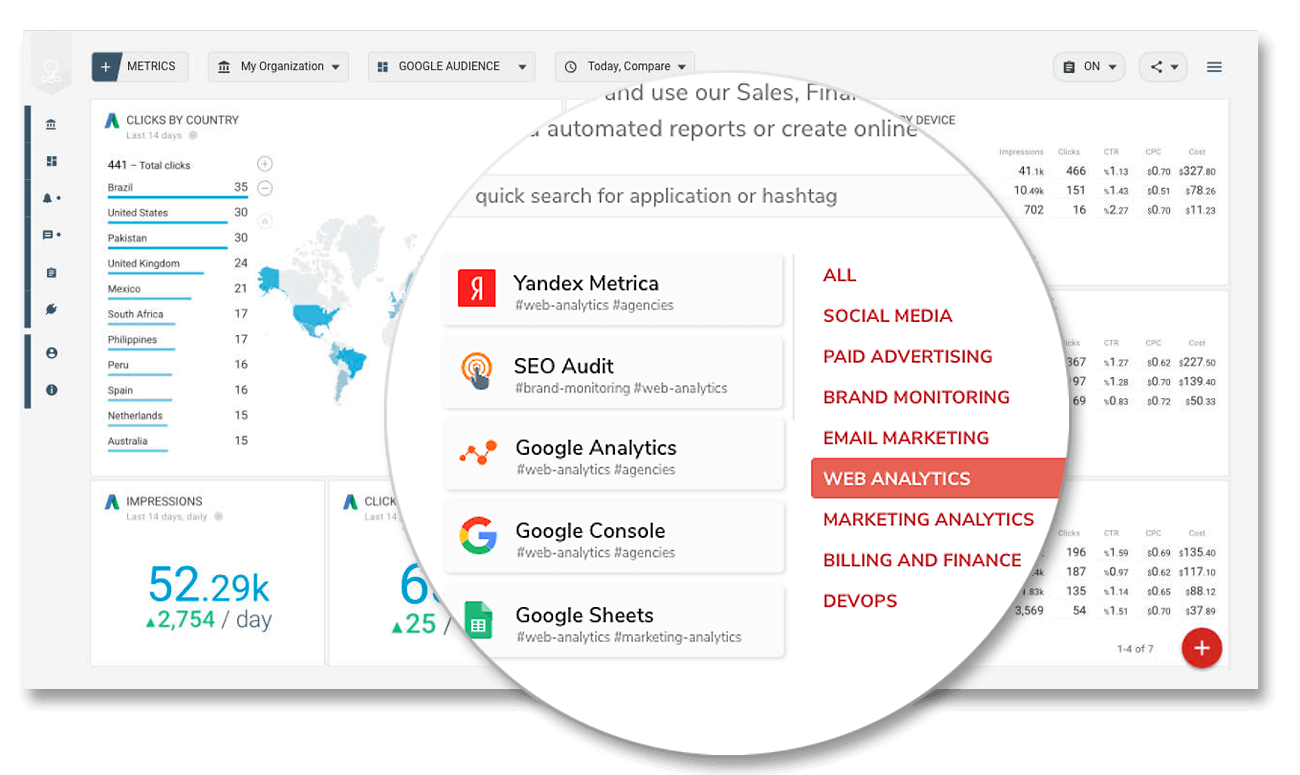
Save Time — No More Logins
Octoboard will automatically collect data from all your cloud applications. We will look after data consistency and save you a lot of time on data visualization, sharing and reporting.
Spend Wisely on
Paid Advertising
Measure success of paid advertising campaigns. Connect Google Analytics, Google Adwords and Yandex Metrika.
Improve SEO Ranking
Add MOZ and ALEXA stats. Set goals and get more traffic from search engines.
Monitor data trends in all SEO and SEM platforms
Stop spending time working with spreadsheets. We will connect to all your SEO systems, collect and update data automatically. Setup takes less than 3 minutes.
Use your client connections to Google Analytics, Yandex, Bing, Google Search Console and start sending great looking reports.
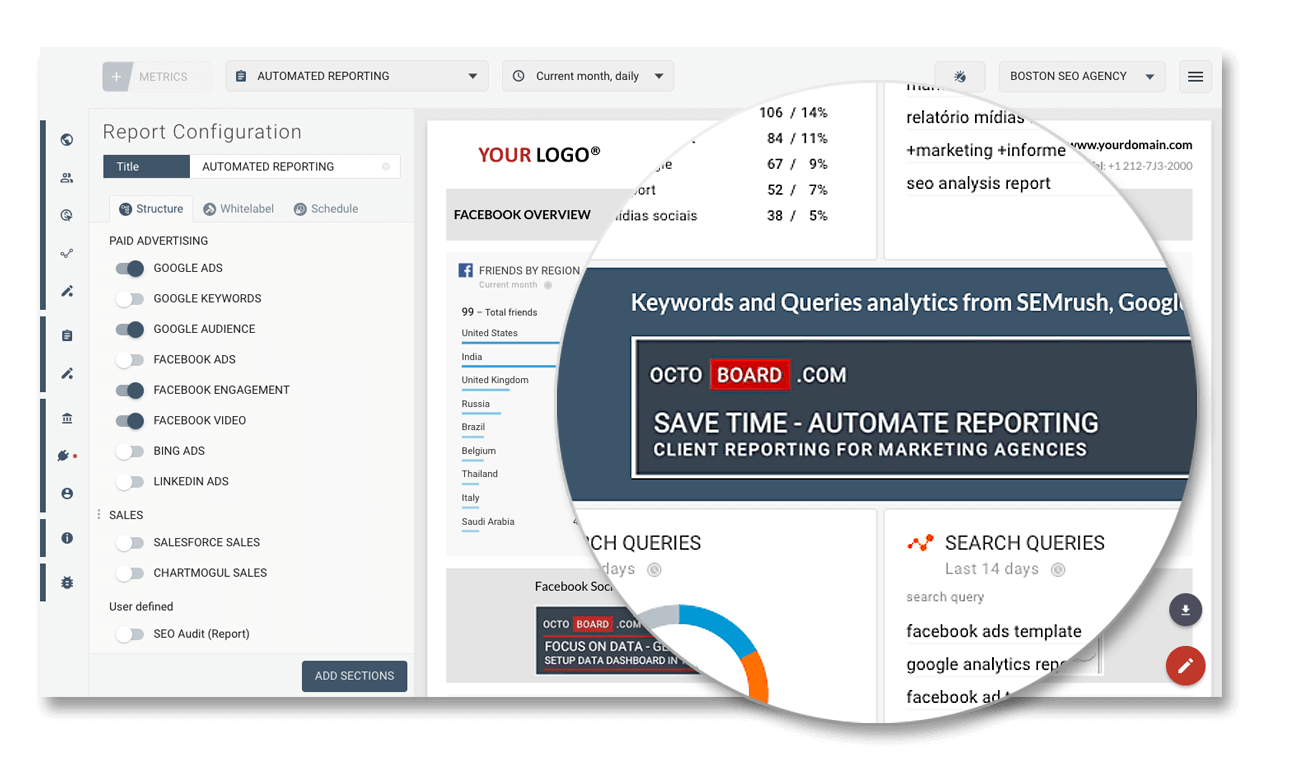
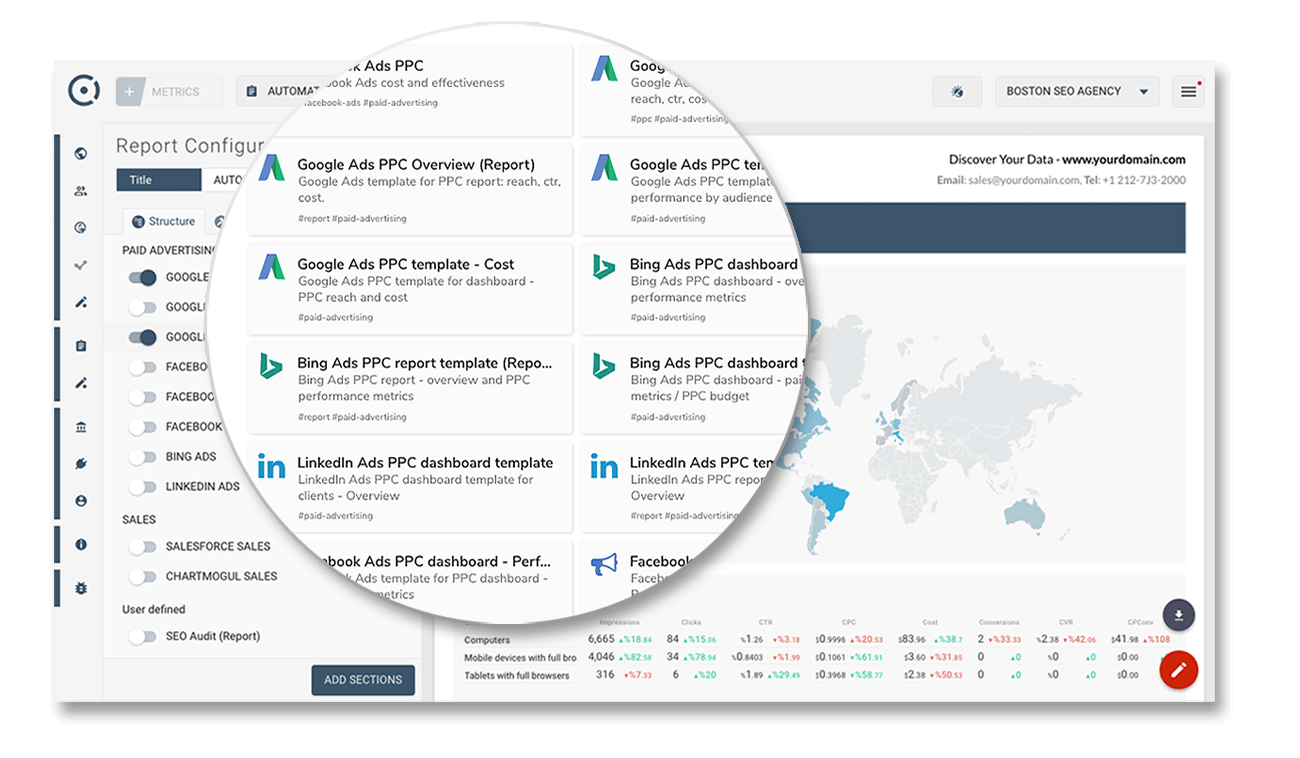
Build reports quickly — Use our SEO templates
No need to study all metrics or build reports from scratch. We have created over 350 templates for your dashboards and reports for you to choose from.
You can also create custom reports or modify any of the existing templates.
Use any KPI for any SEO channel - clicks, impressions, CTR, conversion rates, CPM. Visualise and share data with your clients and marketing department team members.
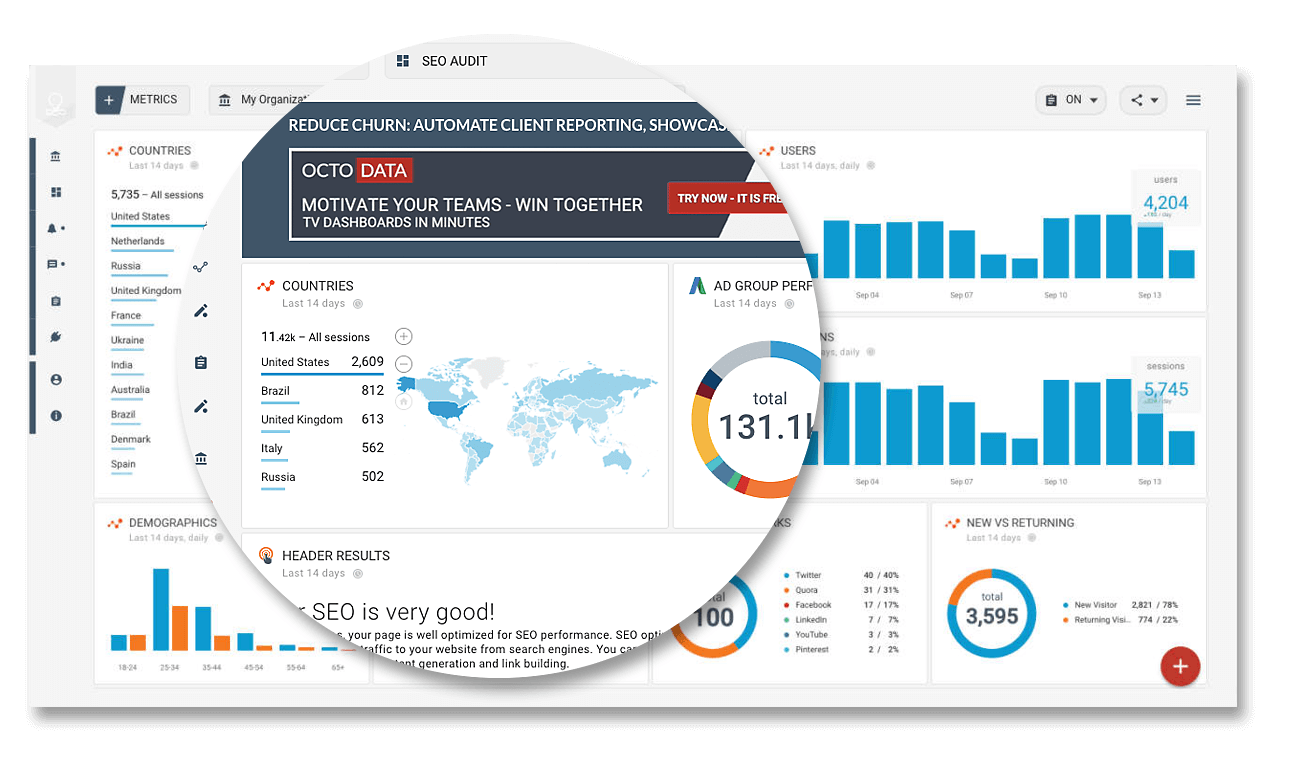
Reduce churn
Show your work to clients
Show how hard your agency work for your clients. Show graphs and metrics that demonstrate positive historical changes and results.
Compare website traffic growth and prove ROI to any business with regular and automated SEO reporting.
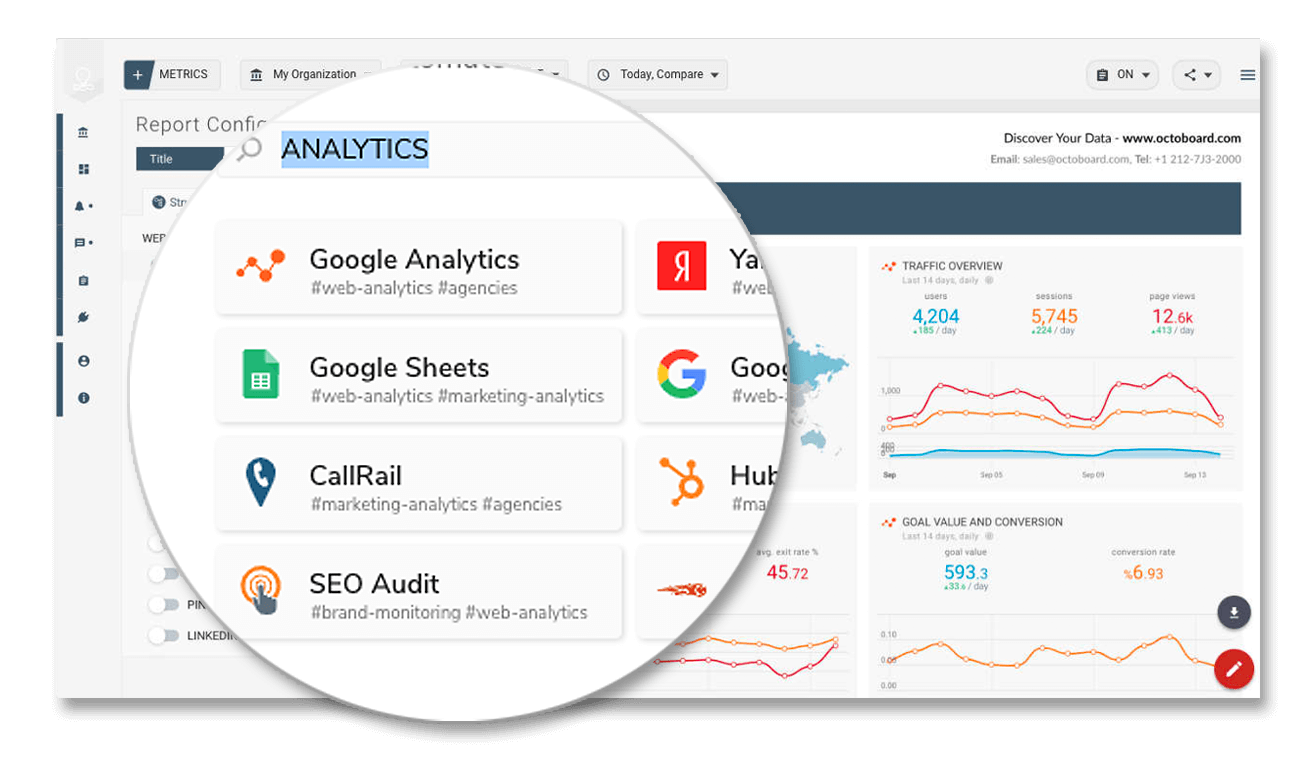
Monitor data trends — Use web analytics reports
Combine Google Analytics, Yandex, Bing, Google Search Console in one report or online SEO dashboard. Filter by traffic channel - organic, paid, email, social and others.
Covers Organic Sessions, Top Landing pages, Traffic Sources, Bounce Rate, Campaign Performance and much more!
Improve website ranking
Track top pages and queries
Connect with Google Search Console to monitor your top pages and search queries. Rank them by impressions or CTRs.
Create landing page SEO reports. Combine this information with Audience statistics from Google Analytics and optimise your content to better suit your website audience.
Extra revenue
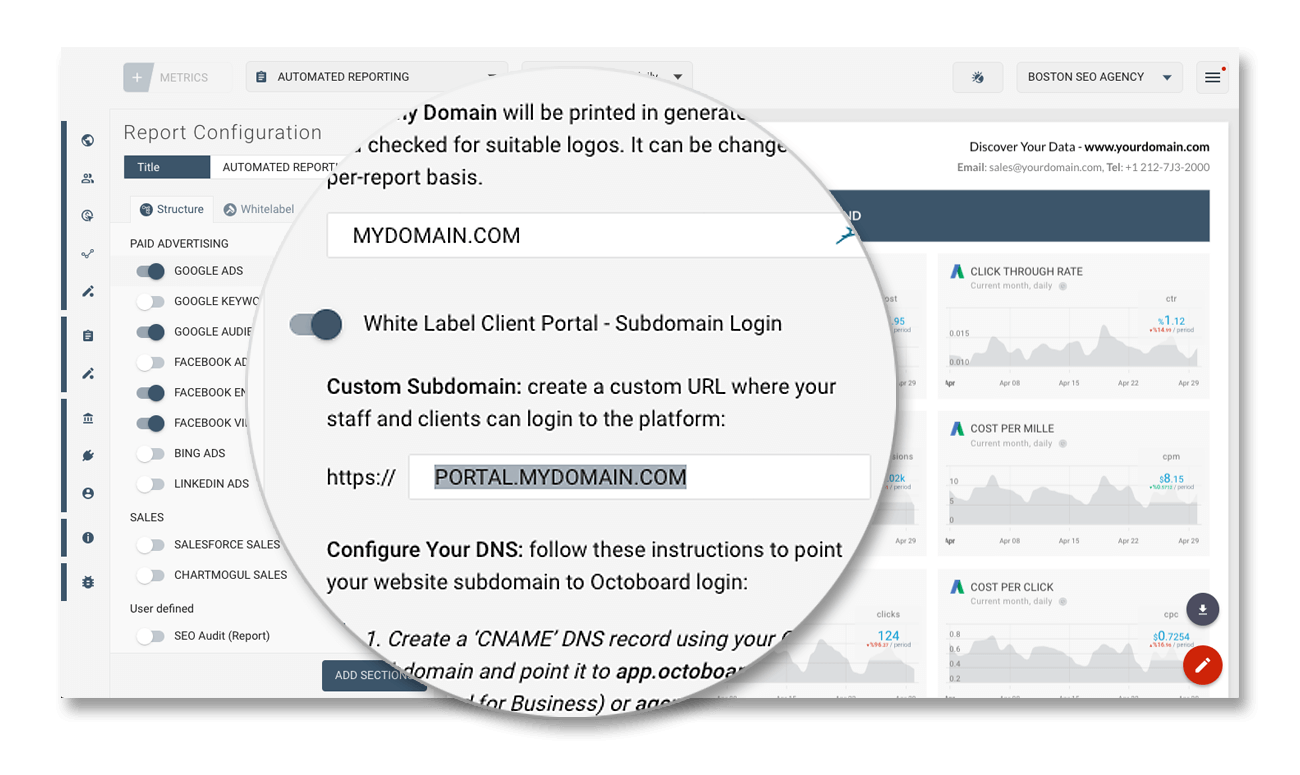
Create client portals
You can build client portals and host them on your website. Enable this feature and your clients will be redirected to login pages that look as if they are part of your site. Octoboard will do the heavy lifting behind the scene.
It is 100% white label. Businesses use client portals to create more value for customers, reduce churn and build extra revenue streams. How much you charge your clients for accessing your portal is entirely up to you.

Increase your sales with lead generation features
Enable B2B leads or your account and start offering captured leads to your clients at a premium. Octoboard provides this feature as a free add-on.
Convert B2B website visitors into leads
Add white-labeled script to your clients' website pages and our platform will provide you with an overview of every captured lead. Discover companies behind IP addresses - cities, company details, business domain, browsed content.
Embed SEO audits
Create multiple embedded SEO Audit forms, capture visitors' details and help increase sales for your customers. Export leads and unlock new revenue streams for your marketing agency.
Offer SEO Services
Run SEO Audits
Octoboard offers SEO Audits as a free add-on to all our customers. You can run audits for your client websites, add results to client portals, online dashboards and show your progress in automated reports.
Create Audits from scratch or use our ready-made templates.
Add SEO Audits to your website
You can generate unlimited SEO Audit reports from your dashboards or from Audit Forms embedded on your website.
Designed for agencies —
Increase your revenue
It works great for any online business as well as for marketing agencies who can install forms on client websites. We offer this feature as a free add-on to all Octoboard plans. How much you charge your agency clients for collected leads is up to you!
Free add-on —
Reduce costs
If you are paying for another platform that provides SEO Audit Lead generation feature, you can switch to Octoboard and reduce your monthly and yearly subscription fees. Embedded SEO Audit Forms is a free add-on in all Octoboard premium plans.
Keyword Rank Tracker
SEO keyword rank monitoring – across multiple locations, languages and competitor websites. Charge your clients for daily SERP reports and weekly updates.
Competition Monitoring
Report on competitor domains for all your clients! Track historical changes in keywords rankings over time. Add competition monitoring to your automated client reports and portals.
Share with clients
Build portals and reports
Add client portal to your website. Invite clients and let them explore your collection of dashboards and reports. Octoboard will do all the work.
Share with teams
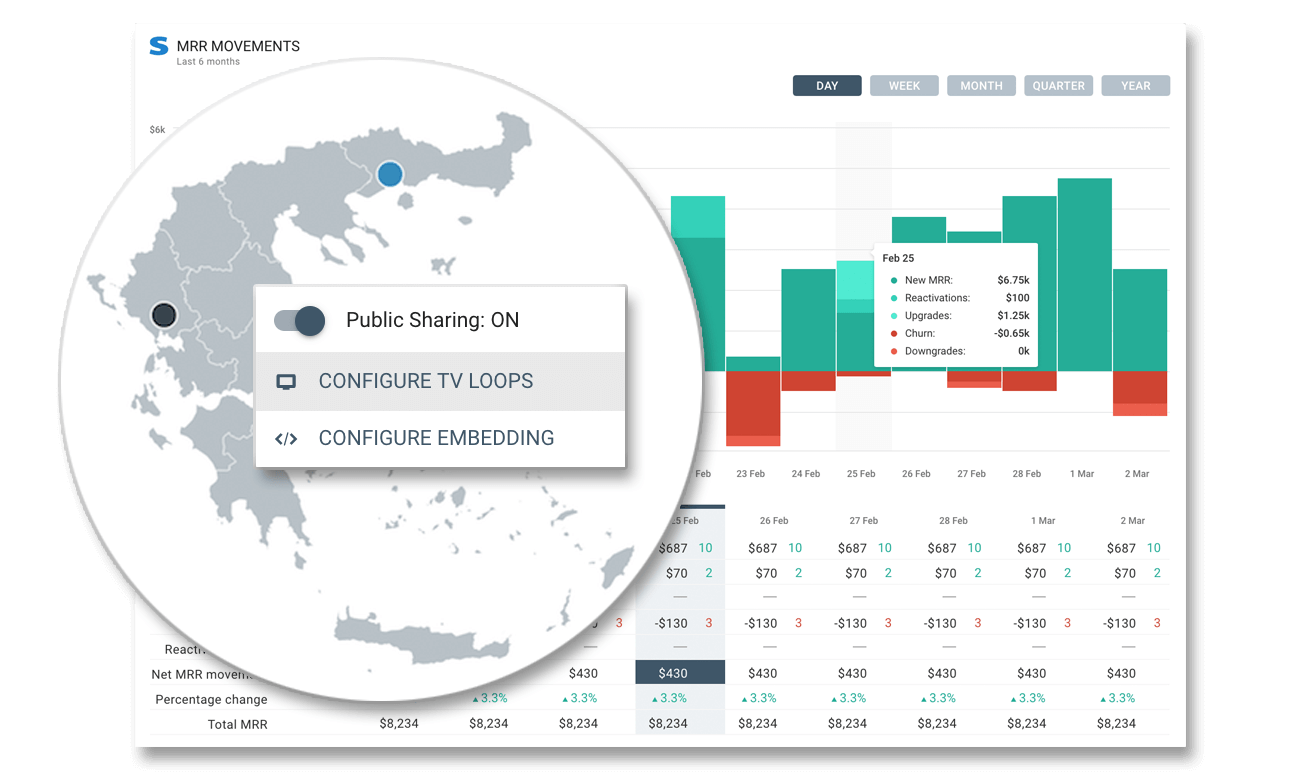
Public links and embedding
Make any dashboard or report public. Embed data views into any page of your website. Setup is very easy and does not require IT support.
Secure and private
Manage data visibility
You decide what data to share or to keep private. Access rights for individual users and clients is under your control.
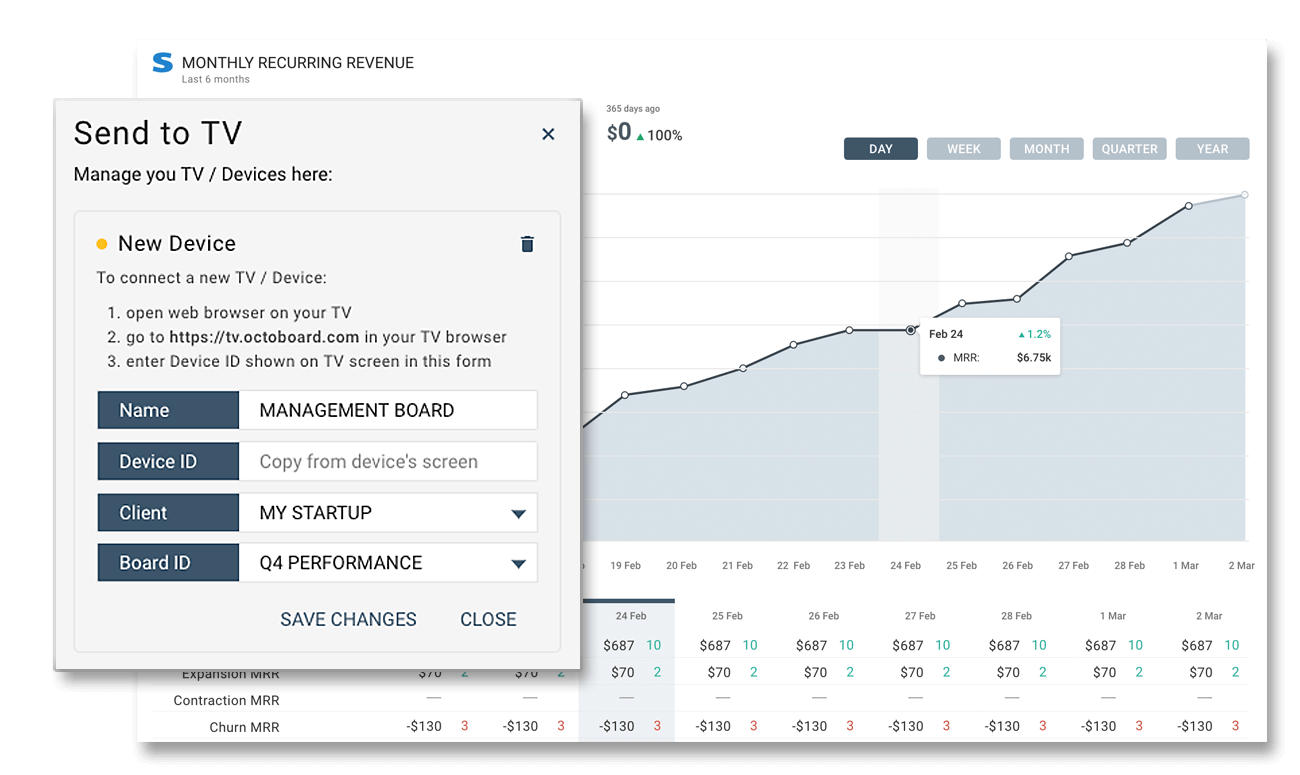
Send data to office TV
Manage your devices
Manage your devices, office TVs and monitors directly in Octoboard. No need to use remote control.
All Configurable
From Your Desktop
Set font size, themes, configure TV Loops and select dashboards to display - all within our platform.
Show Real-time Data Streams
Project to your Office TV real-time website traffic, online sales, email leads and subscriptions.
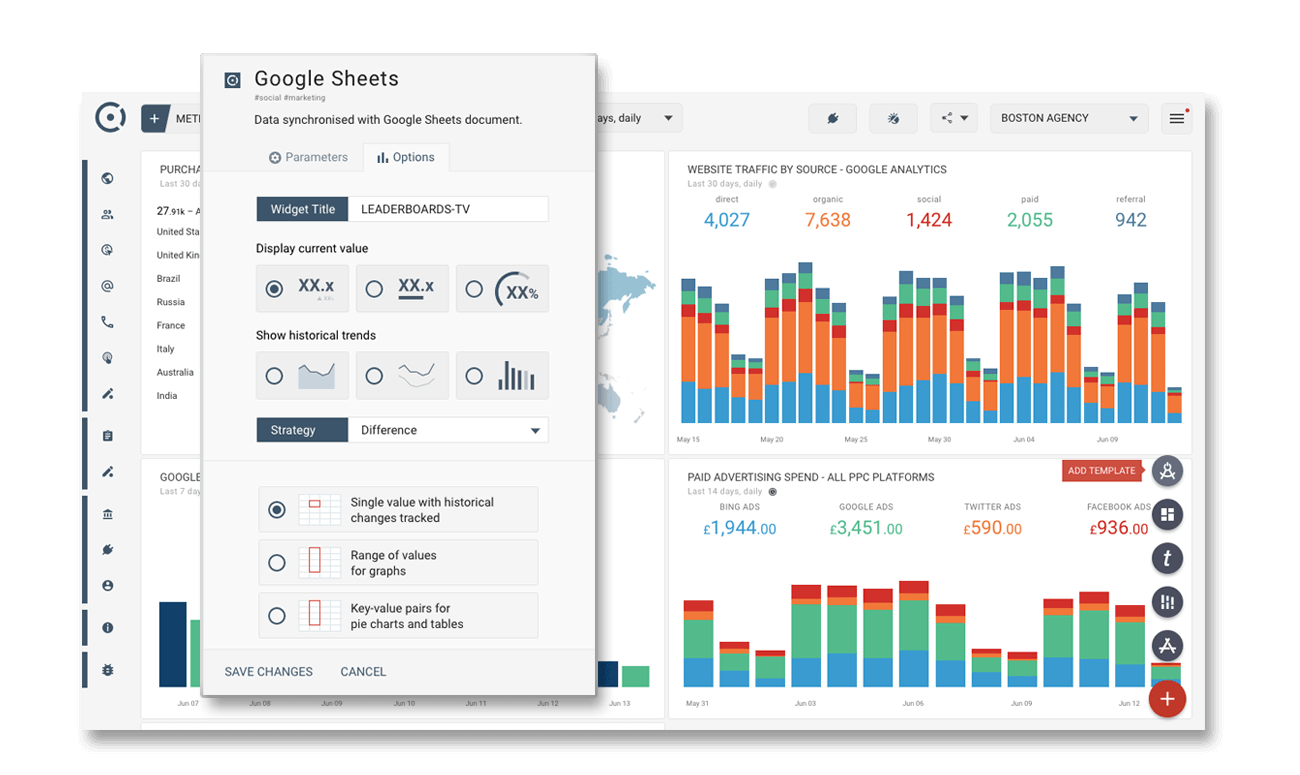
Google Sheets Integration
Included in every plan
Convert any Google Sheets document to a dashboard or PDF report and display it on Office TV, client portal, intranet website or send by email.
This is a free add-on and a feature of any Octoboard plan.
Load Proprietary Data
Combine with any data source
Use any visualisation. Octoboard can monitor changes in a Google Sheets cell and automatically build a graph of historical changes in a dashboard.
Use Google Sheets documents to display any proprietary data alongside cloud data trends from 70 integrations in over 350 data templates from Octoboard.
Document Updates
Tracked Automatically
Update your document using any available method - Zapier, data imports, manual data uploads.
Octoboard will identify any changes and will update your Office TV dashboards automatically.
Over 300 customisable templates used by top marketing teams
Youtube
VK - Depricated