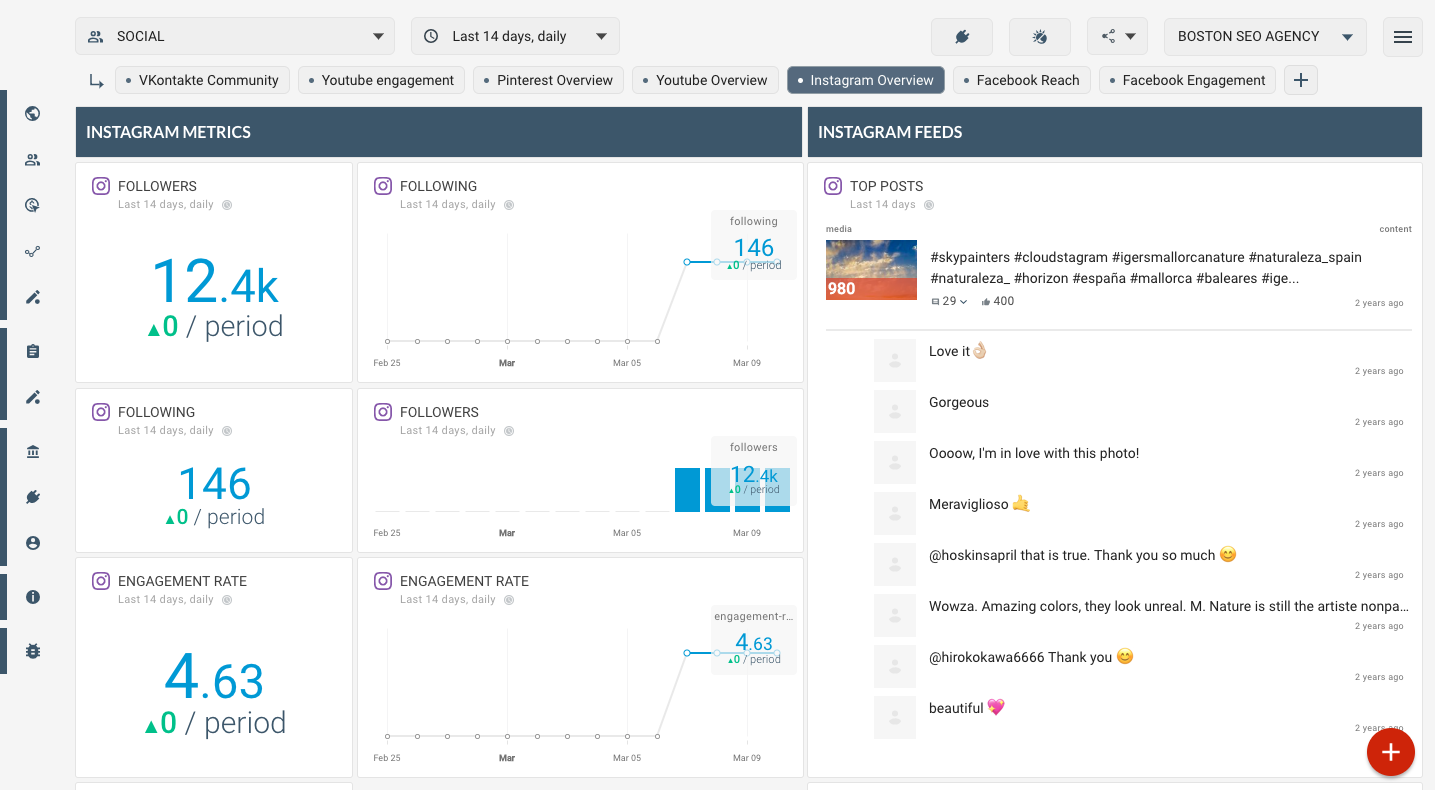
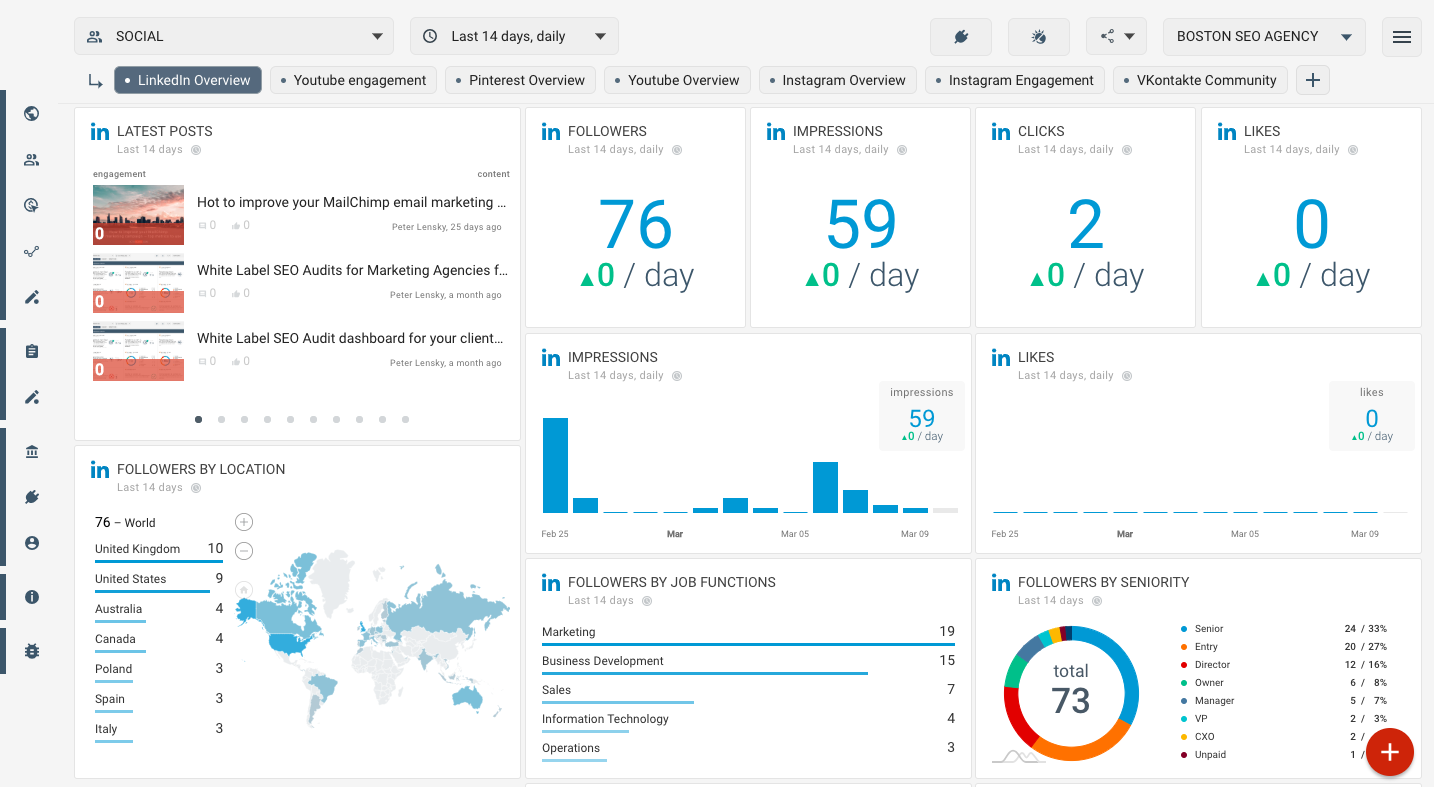
Beste Social-Media-Berichterstattungstool für Marketingteams
Automatisieren Sie Social-Media-Berichte, Dashboards und Datenportale für Marketingteams und Kunden.

Kein
Gespräch verpassen
Beobachten Sie Engagementsignale aus sozialen Netzwerken, Erwähnungen und Blog-Kommentar-Feeds. Engagieren Sie sich wieder mit Ihren Lesern!
Konkurrenz
überwachen
Stellen Sie das Konkurrenten-Dashboard ein, finden Sie heraus, was funktioniert, lernen Sie Marketing und soziale Taktik von den Besten.
Immer auf dem
Laufenden bleiben
Fügen Sie RSS-Feeds, Google-News, Twitter-Suche hinzu und bleiben Sie immer über die neuesten Trends in der Branche informiert
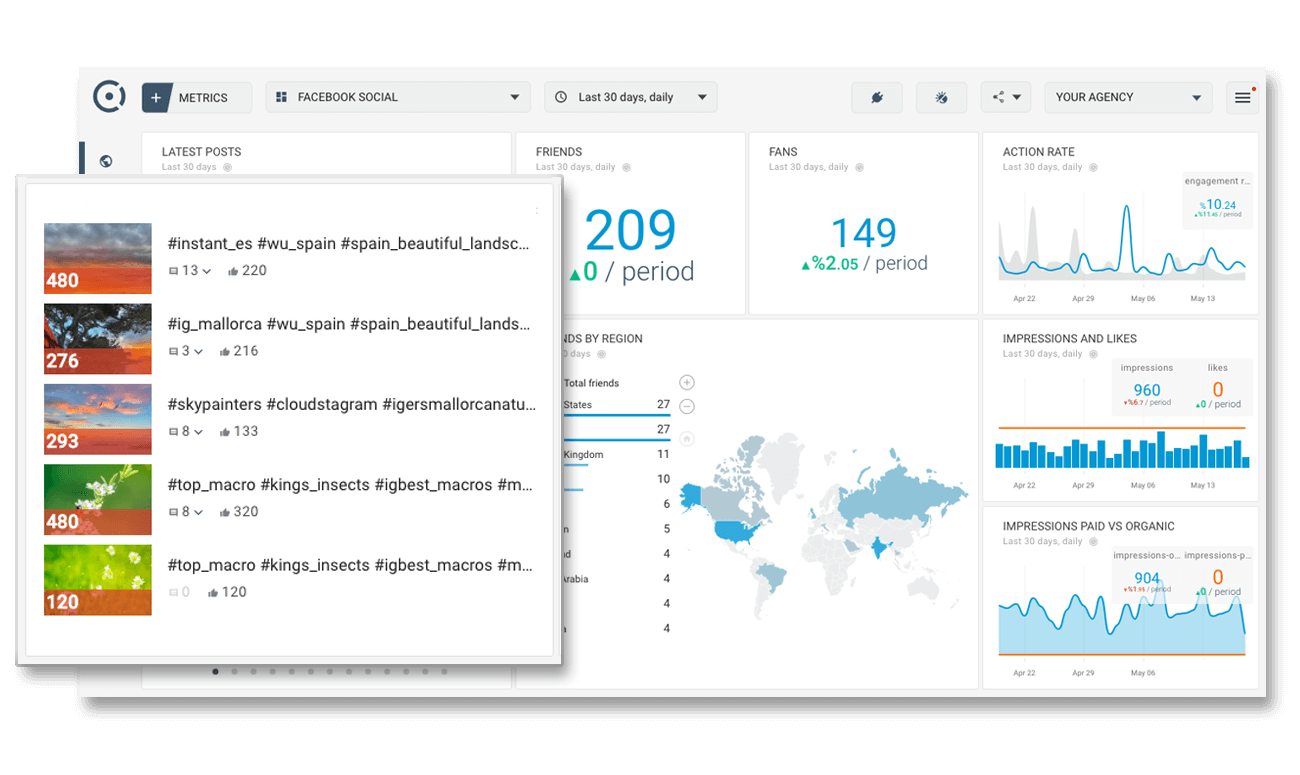
Sparen Sie Zeit — Keine Logins mehr
Octoboard sammelt automatisch Daten aus all Ihren Cloud-Anwendungen. Wir sorgen für Datenkonsistenz und sparen Ihnen viel Zeit bei der Datenvisualisierung, -freigabe und -berichterstattung.
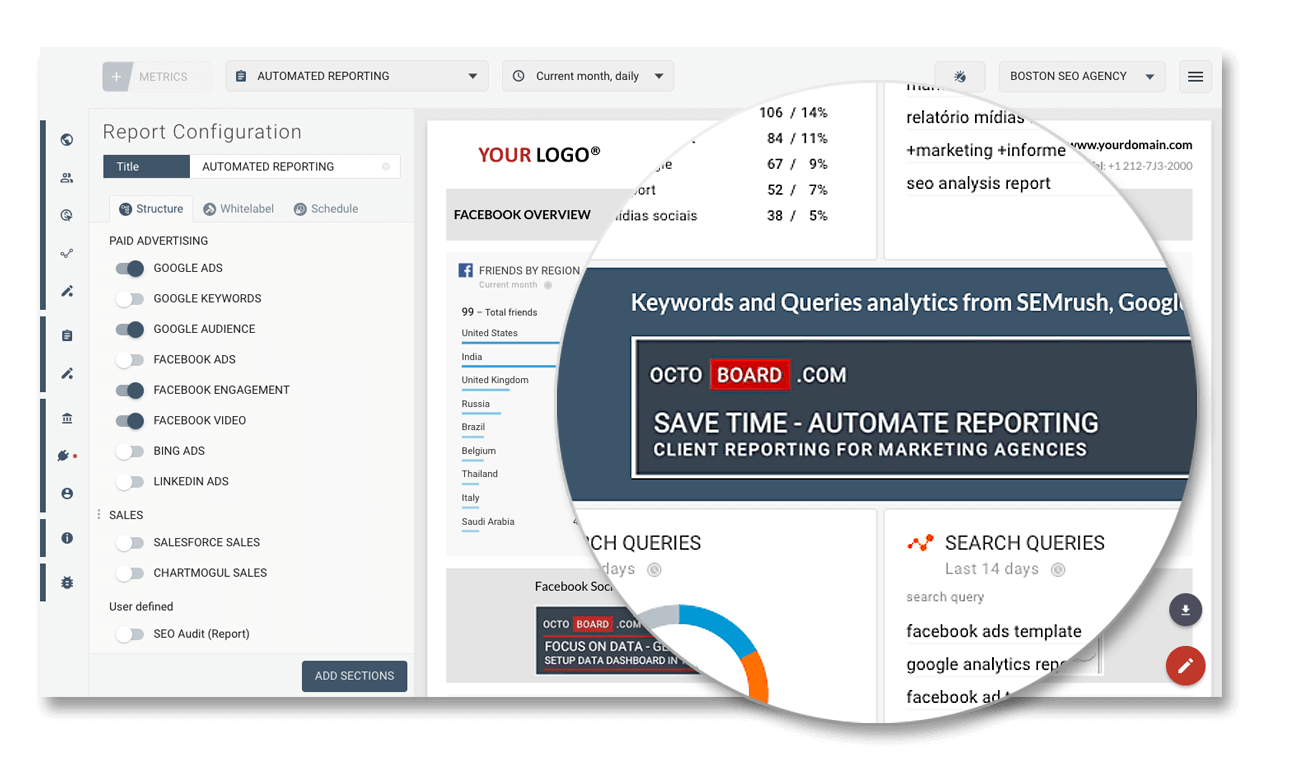
Clever investieren in Paid Werbung
Messen Sie den Erfolg von bezahlten Werbekampagnen. Verbinden Sie Google Analytics, Google Adwords und Yandex Metrika.
SEO-Ranking verbessern
Fügen Sie MOZ- und ALEXA-Statistiken hinzu. Setzen Sie Ziele und erhalten Sie mehr Traffic von Suchmaschinen.
Überwachen Sie Daten-Trends in allen SEO- und SEM-Plattformen
Verbringen Sie keine Zeit mehr mit Tabellenkalkulationen. Wir werden uns mit all Ihren SEO-Systemen verbinden, Daten automatisch sammeln und aktualisieren. Die Einrichtung dauert weniger als 3 Minuten.
Nutzen Sie Ihre Kundenverbindungen zu Google Analytics, Yandex, Bing, Google Search Console und beginnen Sie, großartig aussehende Berichte zu senden.
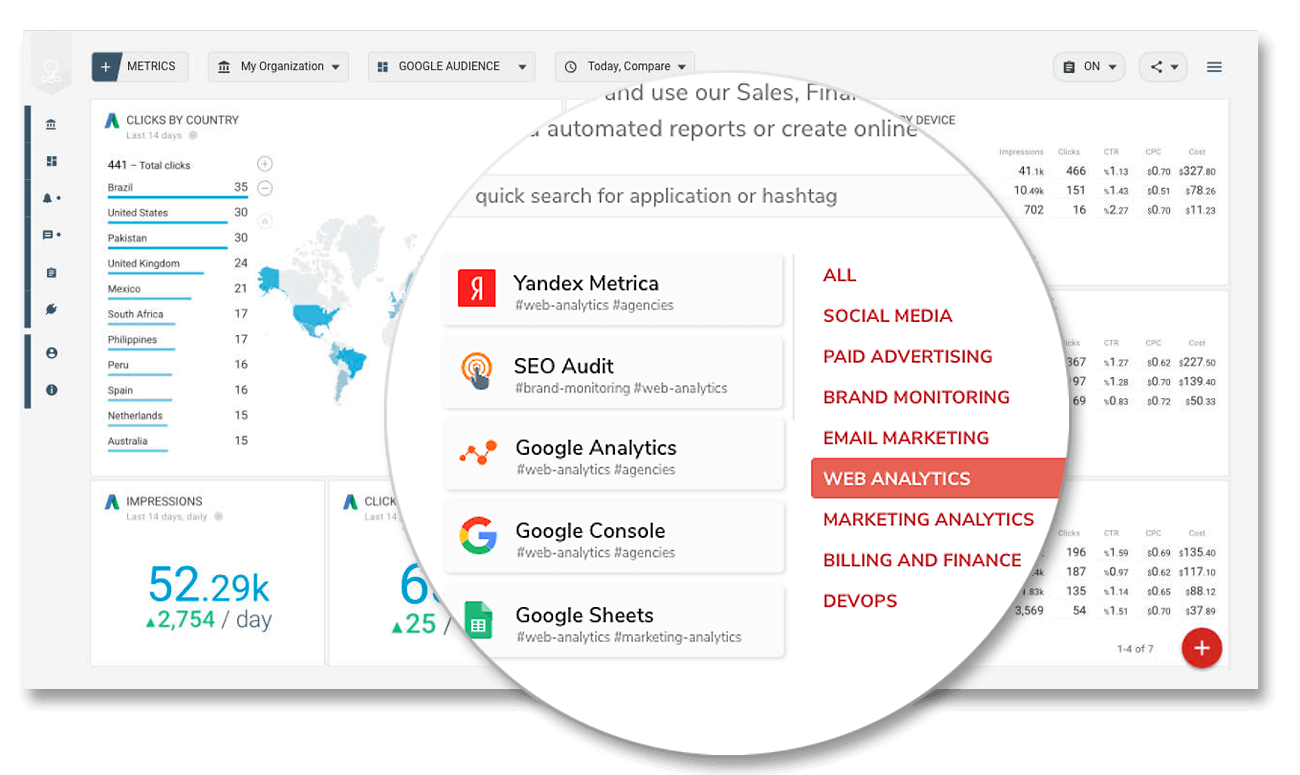
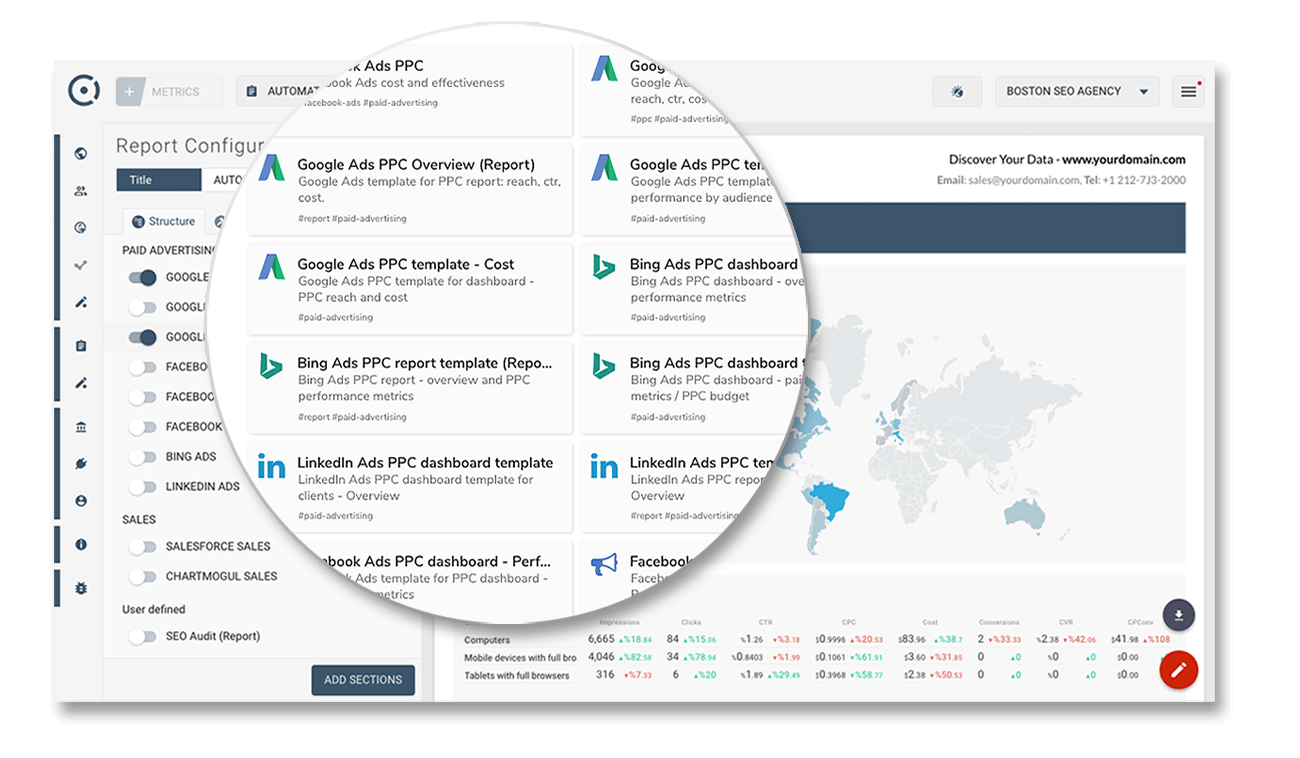
Erstellen Sie schnell Berichte - Verwenden Sie unsere SEO-Vorlagen
Keine Notwendigkeit, alle Metriken zu studieren oder Berichte von Grund auf neu zu erstellen. Wir haben über 350 Vorlagen für Ihre Dashboards und Berichte erstellt, aus denen Sie wählen können.
Sie können auch benutzerdefinierte Berichte erstellen oder eine der vorhandenen Vorlagen ändern.
Verwenden Sie jede KPI für jeden SEO-Kanal - Klicks, Impressionen, CTR, Konversionsraten, CPM. Visualisieren und teilen Sie Daten mit Ihren Kunden und Teammitgliedern der Marketingabteilung.
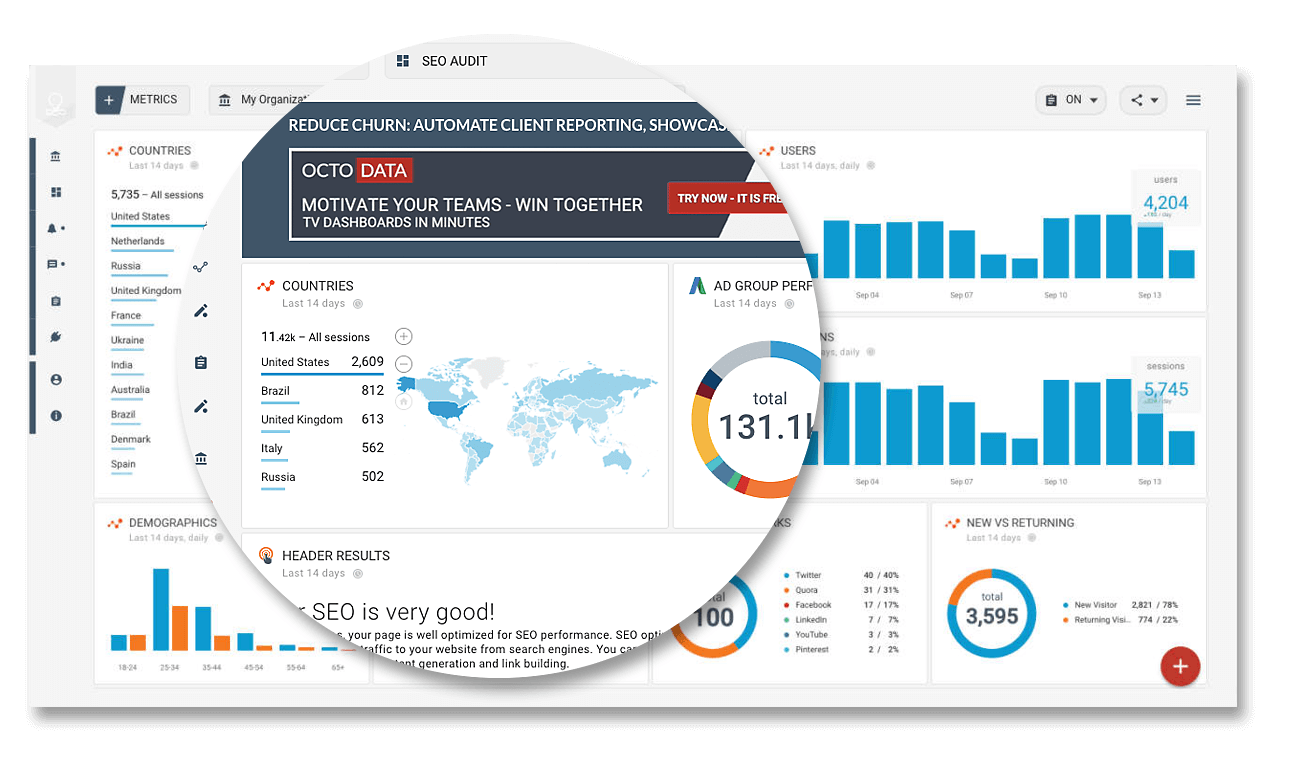
Reduzieren Sie Abwanderung
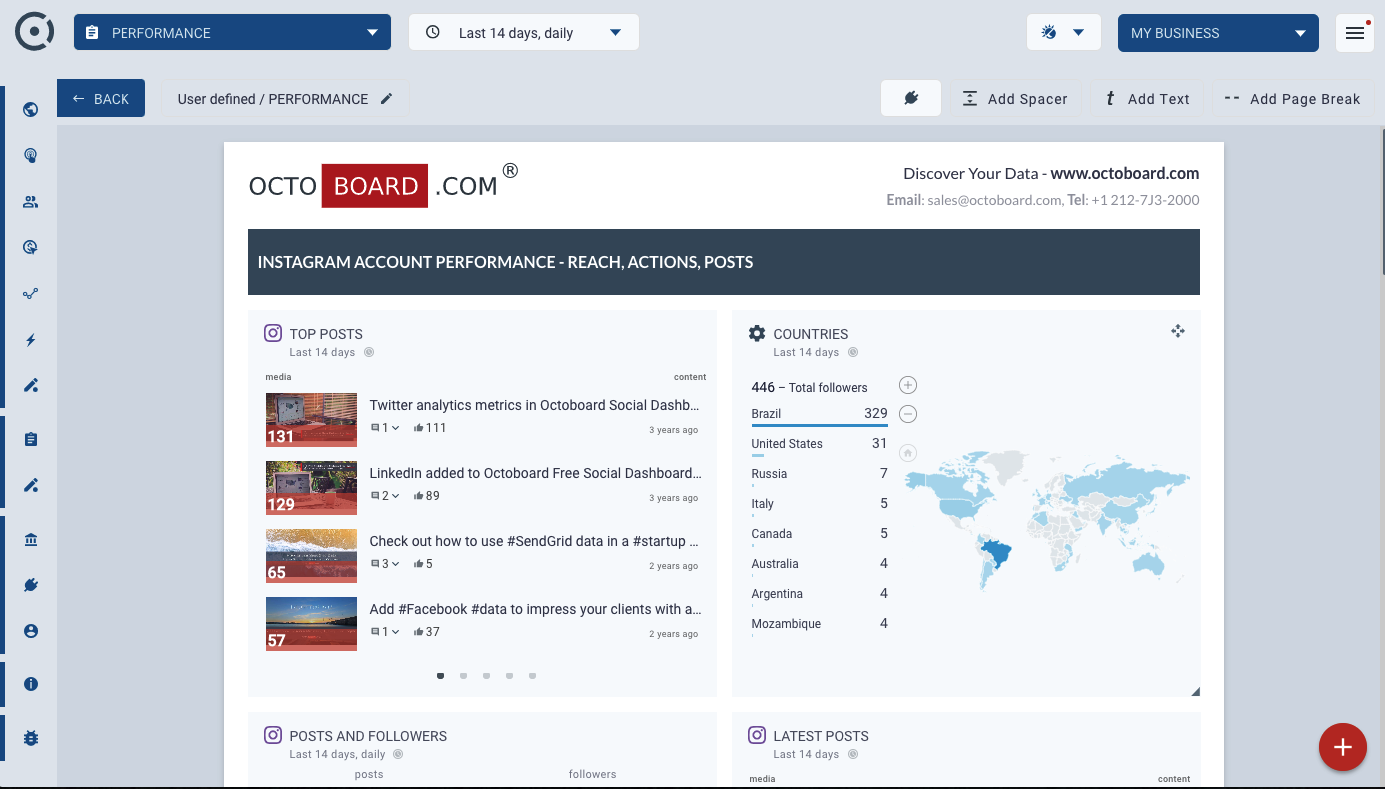
Zeigen Sie Ihre Arbeit den Kunden
Zeigen Sie, wie hart Ihre Agentur für Ihre Kunden arbeitet. Zeigen Sie Grafiken und Metriken, die positive historische Veränderungen und Ergebnisse demonstrieren.
Vergleichen Sie das Wachstum des Website-Verkehrs und beweisen Sie den ROI für jedes Unternehmen mit regelmäßigen und automatisierten SEO-Berichten.
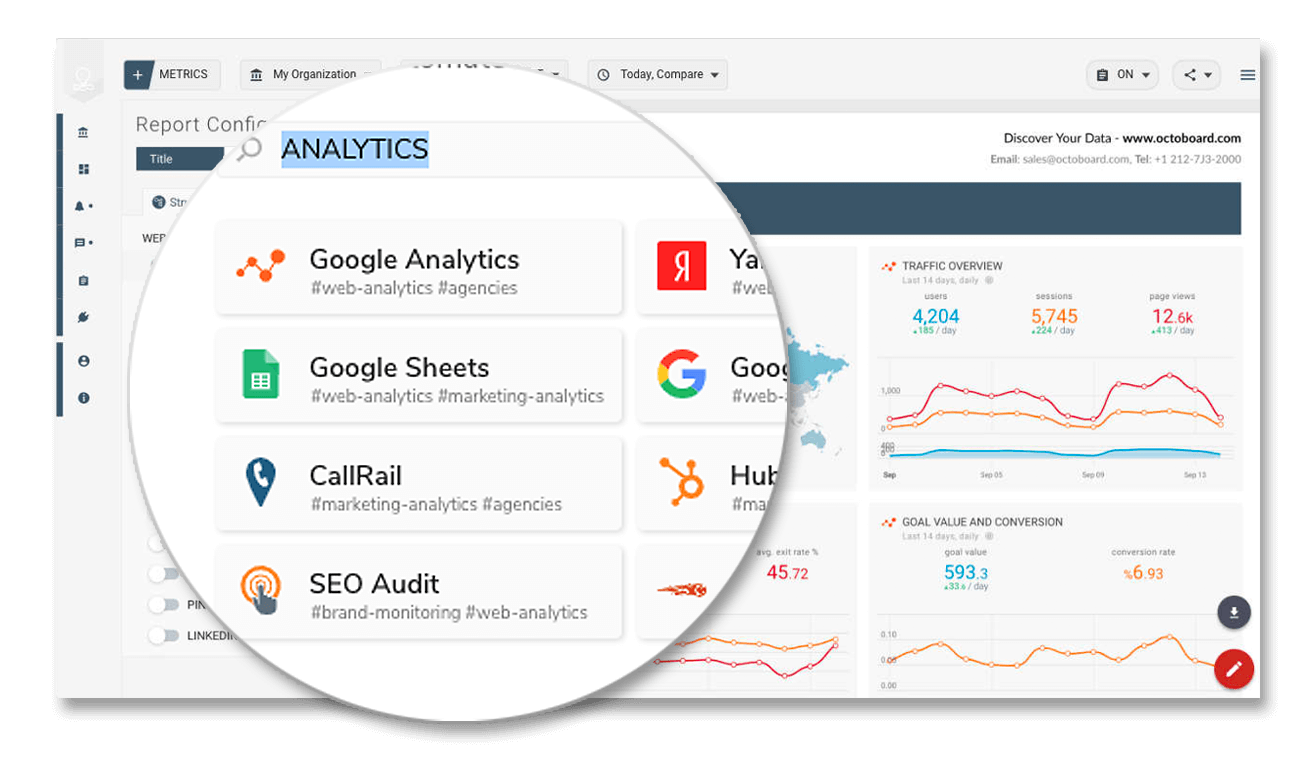
Überwachen Sie Daten-Trends — Verwenden Sie Web-Analyse-Berichte
Kombinieren Sie Google Analytics, Yandex, Bing, Google Search Console in einem Bericht oder Online-SEO-Dashboard. Filtern Sie nach Traffic-Kanal - organisch, bezahlt, E-Mail, sozial und andere.
Abdeckung von organischen Sitzungen, Top-Landing-Seiten, Traffic-Quellen, Absprungrate, Kampagnenleistung und vielem mehr!
Verbessern Sie das Website-Ranking
Verfolgen Sie Top-Seiten und Anfragen
Verbinden Sie sich mit Google Search Console, um Ihre Top-Seiten und Suchanfragen zu überwachen. Ordnen Sie sie nach Impressionen oder Klickrate.
Erstellen Sie Landing-Page-SEO-Berichte. Kombinieren Sie diese Informationen mit Publikumsstatistiken von Google Analytics und optimieren Sie Ihren Inhalt, um Ihre Website-Besucher besser anzusprechen.
Zusätzlicher Umsatz
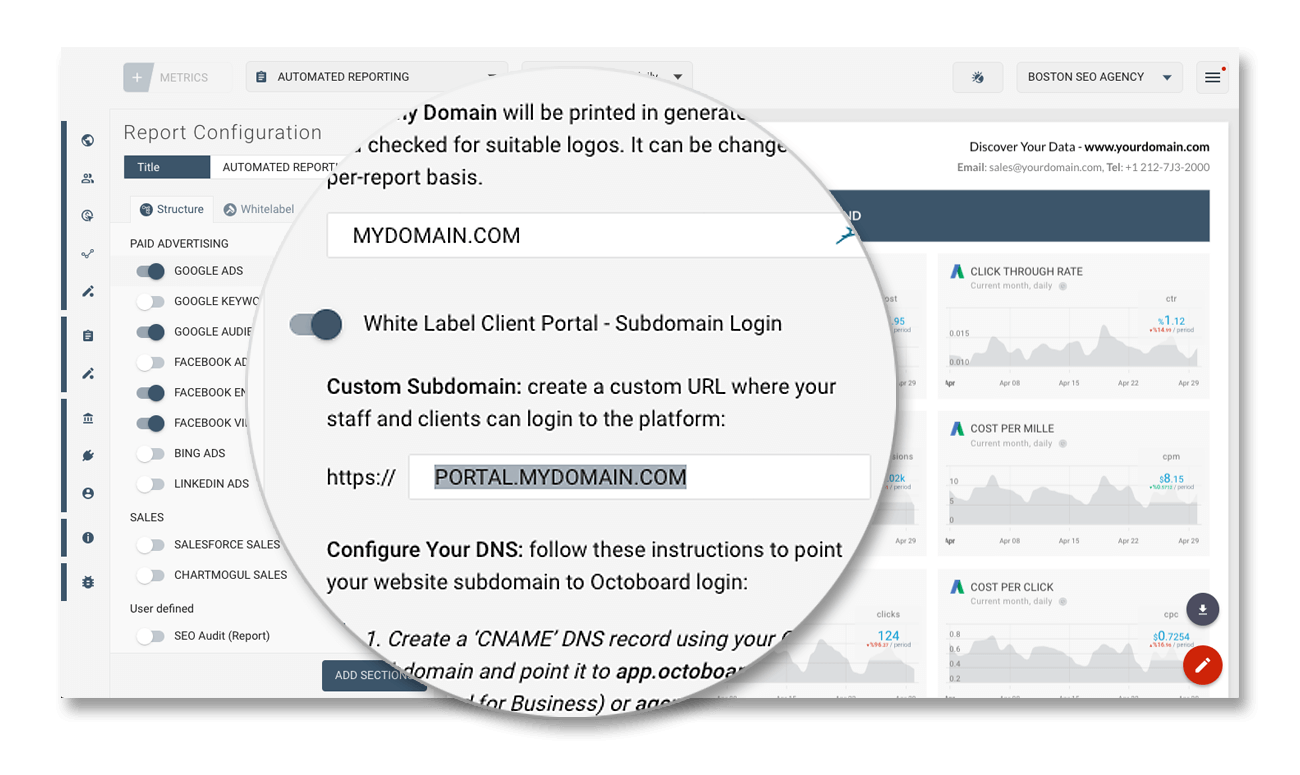
Kundenportale erstellen
Sie können Kundenportale erstellen und sie auf Ihrer Website hosten. Aktivieren Sie diese Funktion und Ihre Kunden werden zu den Anmeldeseiten weitergeleitet, die so aussehen, als ob sie Teil Ihrer Seite sind. Octoboard wird die ganze harte Arbeit hinter den Kulissen erledigen.
Es ist ein komplettes White Label. Unternehmen verwenden Kundenportale, um für Kunden mehr Wert zu schaffen, Kundenabwanderung zu senken und um zusätzliche Einnahmequellen zu schaffen. Es ist Ihnen überlassen, wie hoch die Gebühren sind, die sie von Ihren Kunden verlangen.

Steigern Sie Ihren Umsatz mit Lead-Generierungsfunktionen
Aktivieren Sie B2B-Leads in Ihrem Konto und bieten Sie erfasste Leads zu einem Premium-Preis an Ihre Kunden an. Octoboard bietet diese Funktion als kostenloses Add-On an.
Konvertieren Sie B2B-Website-Besucher in Leads
Fügen Sie ein White-Label-Skript auf den Website-Seiten Ihrer Kunden hinzu und unsere Plattform liefert Ihnen einen Überblick über jeden erfassten Lead. Entdecken Sie Unternehmen hinter IP-Adressen - Städte, Firmendetails, Geschäftsbereiche, durchsuchte Inhalte.
SEO-Audits einbetten
Erstellen Sie mehrere eingebettete SEO-Audit-Formulare, erfassen Sie die Details der Besucher und helfen Sie, den Umsatz für Ihre Kunden zu steigern. Exportieren Sie Leads und schalten Sie neue Einnahmequellen für Ihre Marketingagentur frei.
SEO-Dienstleistungen anbieten
SEO-Audits durchführen
Octoboard bietet SEO-Audits als kostenloses Add-On für alle Kunden an. Sie können Audits für die Websites Ihrer Kunden durchführen Ergebnisse den Kundenportalen, Online-Dashboards hinzufügen undIhren Fortschritt in automatisierten Berichten anzeigen.
Audits von Grund auf neu erstellen oder Ihregebrauchsfertige Vorlage verwenden.
Fügen Sie SEO-Audits zu Ihrer Website hinzu
Sie können unbegrenzt viele SEO-Audit-Berichte von Ihren Dashboards oder von in Ihre Website eingebetteten Audit-Formularen generieren.
Entwickelt für Agenturen —
Steigern Sie Ihren Umsatz
Es funktioniert auch hervorragend für jedes Online-Geschäft sowie für Marketing-Agenturen, die Formulare auf Kunden-Websites installieren können. Wir bieten dieses Feature als kostenloses Add-On für alle Octoboard-Pläne an. Wie viel Sie Ihren Agenturkunden für gesammelte Leads berechnen, liegt bei Ihnen!
Kostenloses Add-On —
Kosten senken
Wenn Sie für eine andere Plattform bezahlen, die die Funktion zur Generierung von SEO-Audit-Leads bietet, können Sie zu Octoboard wechseln und Ihre monatlichen und jährlichen Abonnementgebühren reduzieren. Eingebettete SEO-Audit-Formulare sind ein kostenloses Add-On in allen Octoboard-Premium-Plänen.
Tracker für die Einstufung von Suchbegriffen
Überwachung der Einstufung von SEO-Stichwörtern – in mehreren Standorten, Sprachen und Webseiten der Konkurrenz. Auferlegen von Gebühren Ihrer Kunden für tägliche SERP-Berichte und wöchentliche Aktualisierungen.
Überwachung der Konkurrenz
Über die Domains der Konkurrenz für all Ihre Kunden Bericht erstatten! Historische Veränderungen der Stichwörter-Einstufungen im Laufe der Zeit nachverfolgen. Die Überwachung der Konkurrenz Ihren automatisierten Kundenberichten und -portalen hinzufügen.
Mit Kunden teilen
Portale und Berichte erstellen
Kundenportal zu Ihrer Website hinzufügen. Kunden einladen und ihnen ermöglichen, Ihre Sammlung an Dashboards und Berichten zu erkunden. Octoboard wird alles erledigen.
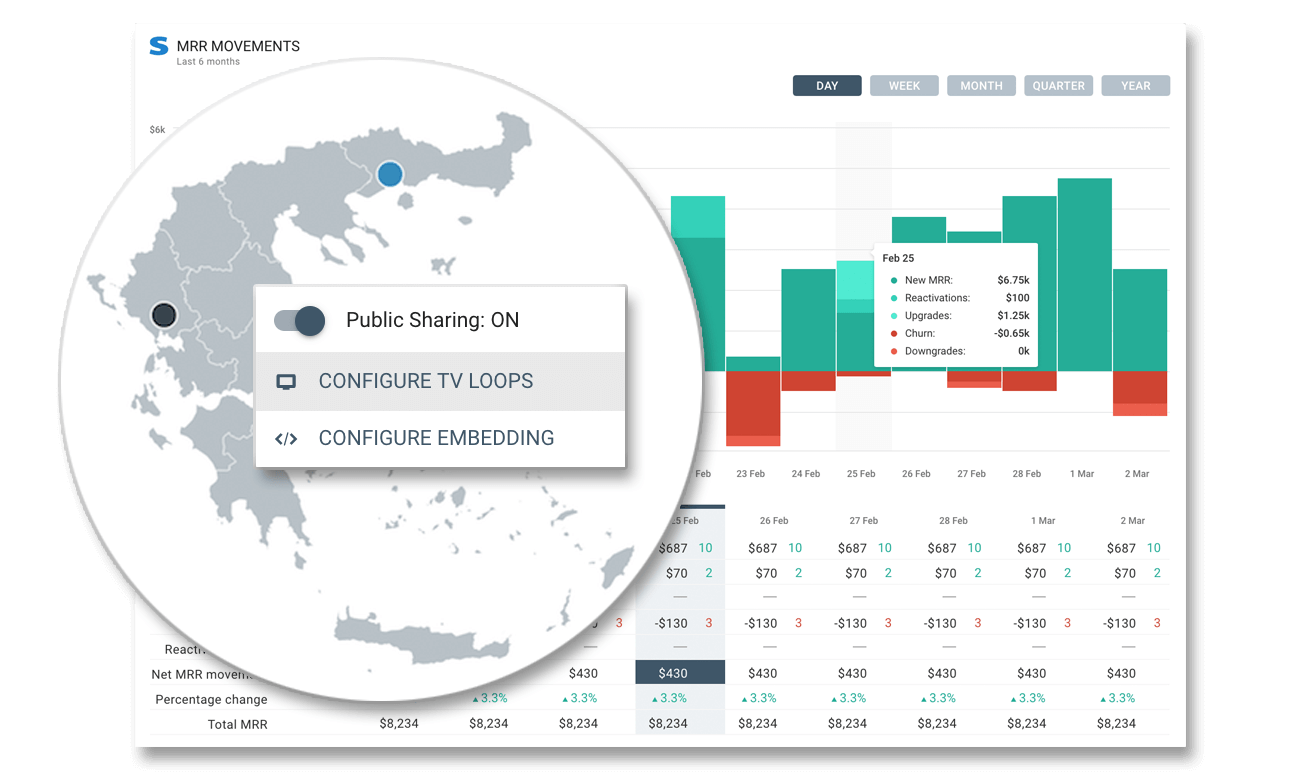
Öffentliche Links und Einbettungen
Mit Teams teilen
Ein Dashboard oder einen Bericht veröffentlichen. Datenansichten in eine beliebige Seite Ihrer Website einbetten. Die Einrichtung ist sehr einfach und ein IT-Support ist nicht nötig.
Sicher und privat
Datensichtbarkeit managen
Sie entscheiden, welche Daten geteilt werden oder privat bleiben. Sie kontrollieren Zugangsberechtigungen für einzelne Benutzer und Kunden.
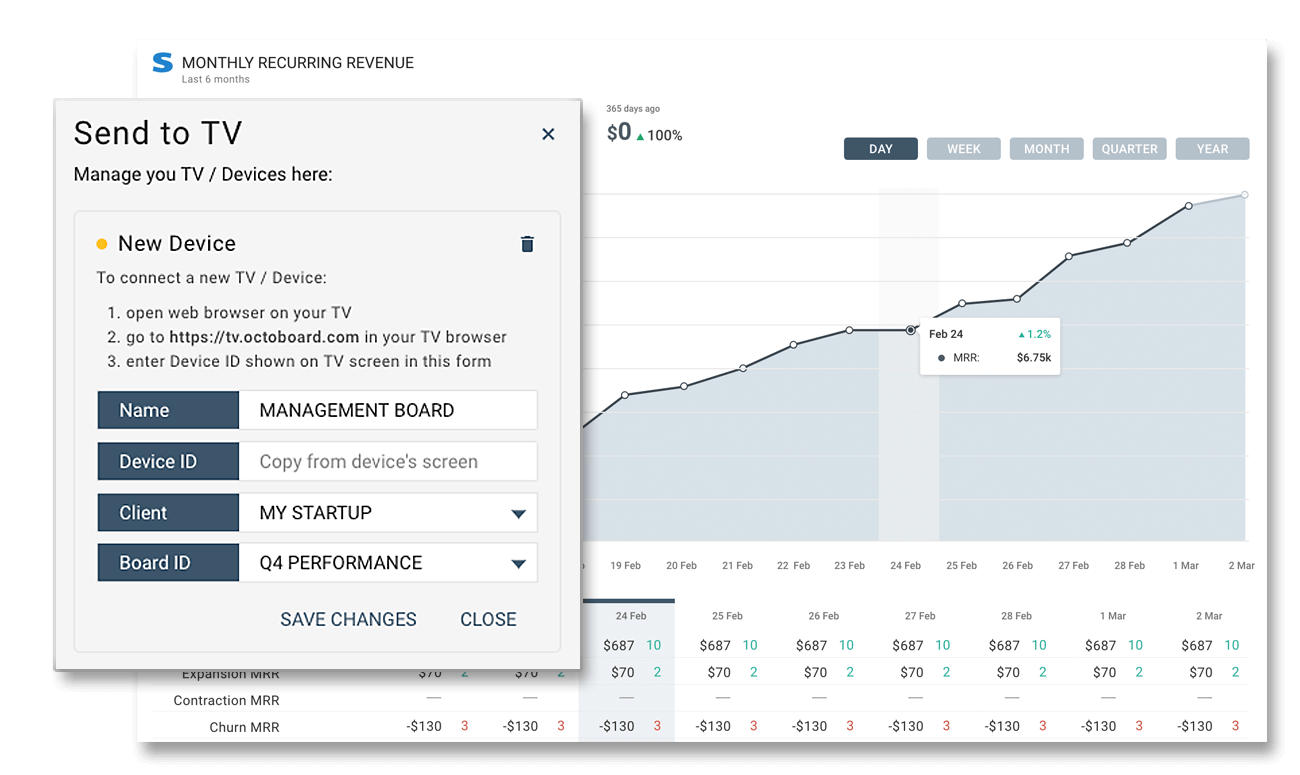
Daten zum Fernseher im Büro senden
Ihre Geräte verwalten
Verwalten Sie Ihre Geräte, Fernseher im Büro und Monitore direkt auf Octoboard. Die Nutzung einer Fernbedienung ist nicht nötig.
Alle Geräte können
von Ihrem Desktop aus konfiguriert werden
Schriftgröße, Themen, TV-Loops und anzuzeigende Dashboard einstellen - All dies auf Ihrer Plattform.
Echtzeit- Datenströme und Anzeigen
Echtzeit-Website-Verkehr, Online-Verkäufe, E-Mail-Leads und Abonnements auf auf Ihren Büro-Fernseher projizieren.
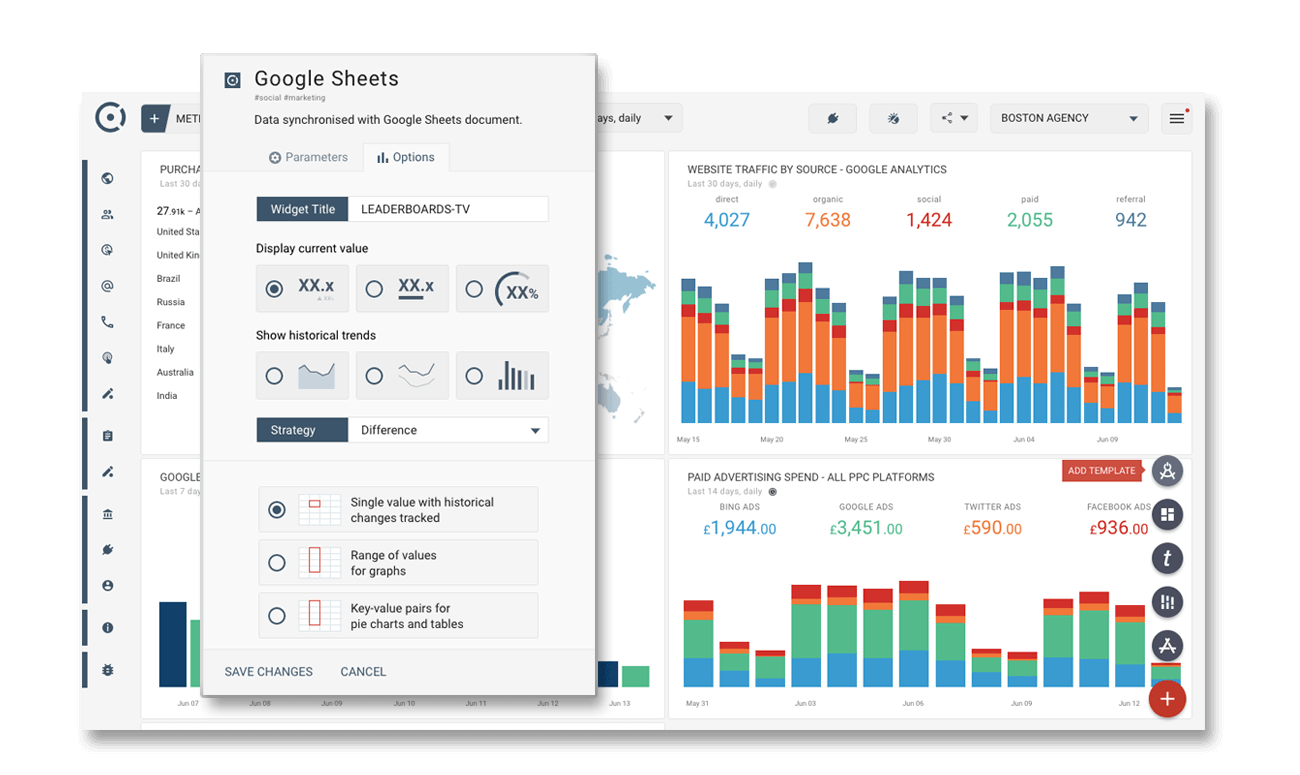
Integration von Google Sheets
Ist Teil eines jeden Plans
Ein Google Sheet-Dokument zu einem Dashboard- oder PDF-Bericht konvertieren und ihn auf einem Büro-Fernseher, Kundenportal, Intranet-Website anzeigen oder per E-Mail senden.
Es ist ein kostenloses Add-On und eine Funktion jedes Octoboard-Plans.
Firmeneigene Daten laden
und mit einer beliebigen Datenquelle verbinden
Sie können eine beliebige Visualisierung verwenden. Octoboard kann Änderungen zu einer Google Sheets-Zelle überwachen undeinen Graph von historischen Änderungen in einem Dashboard erstellen.
Google Sheets-Dokumente verwenden, um firmeneigene Daten zusammen mit Cloud-Datentrends von 70 Integrationen in mehr als 350 Datenvorlagen von Octoboard anzuzeigen.
Aktualisierungen an Dokumenten
werden automatisch angezeigt
Aktualisieren Sie Ihr Dokument mit einer beliebigen verfügbaren Methode - Zapier, Datenimporte, manuelle Daten-Uploads.
Octobaord wird Änderungen identifizieren und die Dashboards Ihrer Büro-Fernseher automatisch entsprechend aktualisieren.
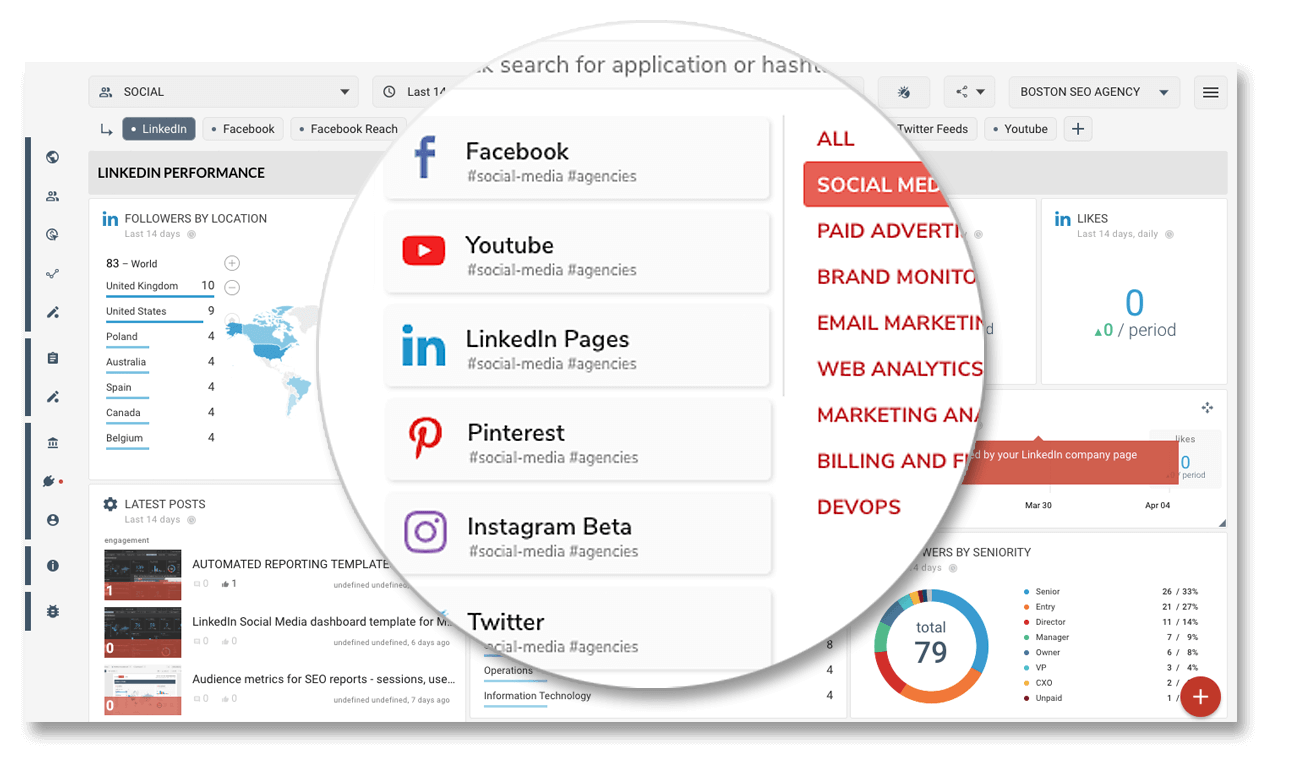
Über 300 anpassbare Vorlagen, die von führenden Marketingteams verwendet werden.
Youtube
VK - Depricated